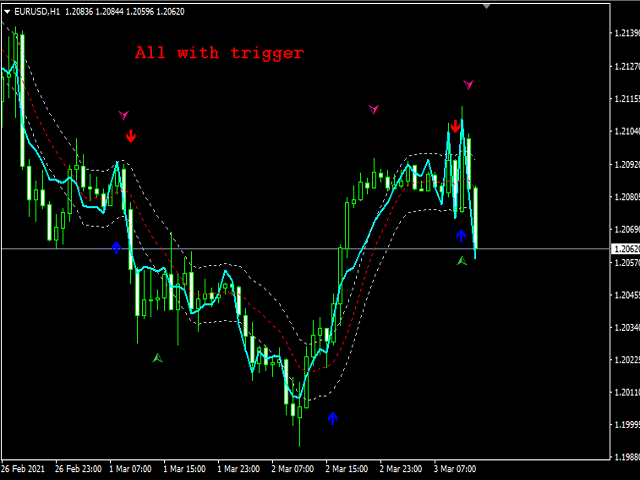
Cci Ma levels chart alert

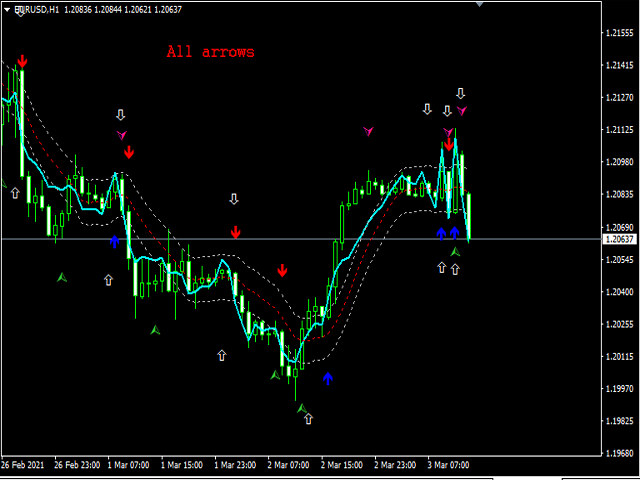
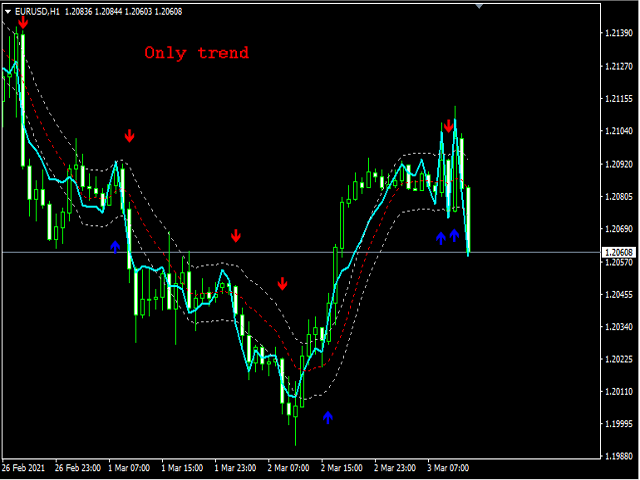
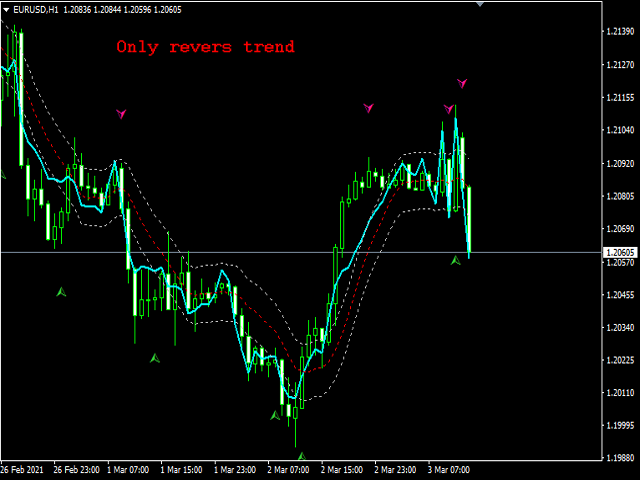
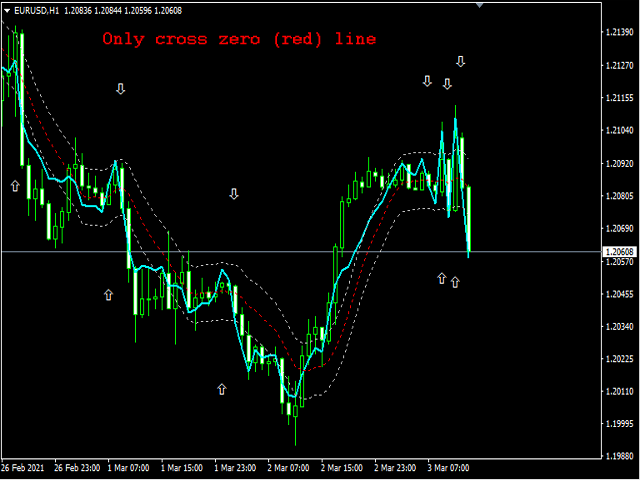
CCi indicator with dynamic levels based on the standard MA, taken as the basis for reading the levels, and modified data of the standard CCi relative to the MA. The input parameter CutCCi, if greater than 0, limits the vertical drawing of the CCi graph, but does not affect the calculations. There are 3 options for displaying arrows: arrows when crossing levels to exit the level zone - trend, arrows to return after exiting the level zone - reverse and crossing the zero level (red MA line). You can separately enable / disable each option for drawing arrows, on which bar to draw and enable the alarm separately for each option of the signal separately. If the Trigger option of some arrows is enabled, repeating one arrow 2 or more times will be excluded - the arrows will be displayed only one by one buy / sell. The MTF mode did not start, because by setting the MA period, you can adjust to any mode.
おすすめのプロダクト
Super Reversal Pattern Indicator Unlock the power of advanced pattern recognition with our Super Reversal Pattern Indicator. Designed for traders seeking precision and reliability, this indicator identifies one of the most effective reversal patterns in technical analysis, offering a significant edge in your trading strategy. Key Features: Non-Repainting Accuracy: Enjoy the confidence of non-repainting technology. Once a Super Reversal Pattern is detected, it remains static, providing consiste
「Auto FIBO Pro」Crypto_Forex インジケーターは、取引の補助ツールとして最適です。 - インジケーターは、フィボナッチ レベルとローカル トレンド ライン (赤色) を自動的に計算してチャート上に配置します。 - フィボナッチ レベルは、価格が反転する可能性のある重要な領域を示します。 - 最も重要なレベルは、23.6%、38.2%、50%、61.8% です。 - リバーサル スキャルピングやゾーン グリッド取引に使用できます。 - Auto FIBO Pro インジケーターを使用して、現在のシステムを改善する機会も多数あります。 - Info Spread Swap Display があり、接続されている外国為替ペアの現在のスプレッドとスワップを表示します。 - ディスプレイには、アカウントの残高、エクイティ、マージンも表示されます。 - Info Spread Swap Display は、チャートのどのコーナーにも配置できます。 高品質のトレーディングロボットとインジケーターをご覧になるにはここをクリックしてください! これは、この MQL5 ウェブサイ
Noize Absorption Index - is the manual trading system that measures the difference of pressure between bears forces and bulls forces. Green line - is a noize free index that showing curent situation. Zero value of index shows totally choppy/flat market.Values above zero level shows how powerfull bullish wave is and values below zero measures bearish forces.Up arrow appears on bearish market when it's ready to reverse, dn arrow appears on weak bullish market, as a result of reverse expectation. S
これは、キャンドルの終値を予測する指標です。 このインジケータは、主にD1チャートでの使用を目的としていますが. この指標は、従来の外国為替取引とバイナリオプション取引の両方に適しています。 インジケーターは、スタンドアロンのトレーディングシステムとして使用することも、既存のトレーディングシステムへの追加として機能させることもできます。 このインジケーターは、現在のキャンドルを分析し、キャンドル自体の内部の特定の強度係数と、前のキャンドルのパラメーターを計算します。 したがって、この指標は、市場の動きのさらなる方向性と現在のキャンドルの終値を予測します。 この方法のおかげで、この指標は、短期の日中取引だけでなく、中期および長期の取引にも適しています。 インジケーターを使用すると、市場の状況の分析中にインジケーターが生成する潜在的な信号の数を設定できます。 インジケーターの設定には、このための特別なパラメーターがあります。 また、インジケーターは、チャート上のメッセージの形式で、電子メールで、およびPUSH通知の形式で、新しい信号について通知することができます。 購入後は必ず私に書いて
Intraday Levels shows intraday levels grid for intraday trading Shows a grid for the day levels, gives you a guide to know the trend and to measure intraday trades (stop-loss and take-profit). Parameters are: Levels Mode: Basic mode: Shows highest, lowest and middle levels. Advanced mode: Shows highest, lowest, middle and intermediate levels. Fibonacci mode: Shows session Fibonacci retracements levels. Momentum mode: Shows delayed Advanced levels to identify momentum. Smooth Period (Momentum m
Color Stochastic Enhanced Stochastic Oscillator with Cross Detection and Visual Signal Support Overview Color Stochastic is a customized version of the classic Stochastic Oscillator designed for momentum analysis and crossover visualization. The indicator provides color-based signal marking and configurable crossover detection at user-defined overbought and oversold levels. It can be used as part of: Momentum analysis Mean reversion workflows DCA-based strategies Multi-indicator confirmation sys
Chart Patterns Detect 15 patterns (Ascending Triangle, Descending Triangle, Rising Wedge, Falling Wedge, Bullish Flag, Bearish Flag, Bullish Rectangle, Bearish Rectangle Symmetrical triangle, Head and Shoulders, Inverted Head and Shoulders, Triple top, Triple Bottom, Double Top, Double Bottom) Use historical data to calculate the probability of each pattern to succeed (possibility to filter notification according to the chance of success) gives graphic indication about the invalidation level and
トレンドオシレーターは、高度なカスタム Crypto_Forex インジケーター、効率的な取引ツールです! - 高度な新しい計算方法を使用 - パラメーター「計算価格」のオプションは 20 種類。 - これまで開発された中で最もスムーズなオシレーター。 - 上昇トレンドの場合は緑色、下降トレンドの場合は赤色。 - 売られすぎの値: 5 未満、買われすぎの値: 95 以上。 - このインジケーターを使用すると、標準戦略をアップグレードする機会が十分にあります。 - PC およびモバイルアラート付き。 高品質のトレーディングロボットとインジケーターをご覧になるにはここをクリックしてください! これは、この MQL5 Web サイトでのみ提供されるオリジナル製品です。
「ダイナミック・スキャルピング・オシレーター」は、MT4向けの高度なカスタムCrypto_Forexインジケーターです。効率的な取引ツールです! - 新世代のオシレーター - 使い方は画像をご覧ください。 - ダイナミック・スキャルピング・オシレーターは、適応型の売られ過ぎ/買われ過ぎゾーンを備えています。 - オシレーターは、動的な売られ過ぎ/買われ過ぎエリアから正確なエントリーポイントを見つけるための補助ツールです。 - 売られ過ぎ値:グリーンラインより下、買われ過ぎ値:オレンジラインより上。 - このインジケーターは、プライスアクションパターンと組み合わせるのに最適です。 - 標準的なオシレーターよりもはるかに正確です。 - PCとモバイルの両方でアラート機能付き。 高品質のトレーディングロボットとインジケーターをご覧になるにはここをクリックしてください! これは、このMQL5ウェブサイトでのみ提供されるオリジナル製品です。
このインジケーターは アグレッシブなスキャルピング と バイナリーオプションの速いエントリー のために設計されており、 毎バー でシグナルを生成し、常に何が起こっているかを正確に把握できます。 Happy Scalpingチャンネルに参加する: MQL5 再描画しません :現在のバーのシグナルは リアルタイム で生成されるため、まだバーが形成されている間に、前のバーの終値に対して価格が上がるか下がるかによってシグナルが変わる可能性があります。 しかし、バーが 閉じる と、シグナルの色は 完全に固定されます 。変更されず、消えず、動かず、 見るものがそのまま残ります。 なぜこのように設計されたのか? 多くのスキャルパーは、特に価格が ブレイクアウトや急激な動き をする際に、すぐにシグナルを受け取ることを重視しています。そのため、その瞬間に迅速に取引を行い、すぐにピップを獲得することができます。 一方で、バーが閉じた後の 確認を待つ ことを好むトレーダーもおり、その場合でもこのインジケーターを問題なく使用できます。 どちらのアプローチも有効です 。このシステムはどちらのスタイルにも
Power Renko is an indicator which plots Renko bricks underneath the chart using a histogram. You can select the brick size and the timeframe of the Renko bricks as well as whether or not to use the close price or the high/low price of the candles. Renko bricks are based on price alone, not time, therefor the Renko bricks will not be aligned with the chart's time. They are extremely useful for trend trading and many different strategies can be formed from them. Buffers are provided allowing you t
Advanced Trend Regime
Shellard Securities (Pty) Ltd
The indicator has been designed to function on any time-frame and any pair.   This regime filter will help the trader better evaluate whether the current market is trending, and in which direction. It quickly reacts to changes in market dynamics using a series of advanced calculations. The user is able to select whether the calculation remains standard, or if a further filter constraint is added to the calculation.   A Yellow moving average of the signal has been included for the trader to smoot
The indicator shows the potential trend direction by cyclical-wave dependence. Thus, all the rays of the intersection will be optimal rays, in the direction of which the price is expected to move, taking into account the indicator period. Rays can be used as a direction for potential market movement. But we must not forget that the approach must be comprehensive, the indicator signals require additional information to enter the market.
Trend PRO Expert Advisor  is developed base on the PipFinite Trend PRO Indicator, the best indicators on the market so far. PipFinite  Trend Pro's smart algorithm detects the trend, filters out market noise and gives entry signals with exit levels.  This EA open order when the indicator has buy/sell signals and set SL/TP follow the indicator rules. You can read more information about PipFinite Trend PRO indicator  here . Important Information   This EA will only work if you purchased  PipFinte
SMC Venom Model BPR インジケーターは、スマート マネー (SMC) コンセプトで取引するトレーダー向けのプロフェッショナル ツールです。価格チャート上の 2 つの主要なパターンを自動的に識別します。 FVG   (フェアバリューギャップ) は、3 本のローソク足の組み合わせで、最初のローソク足と 3 番目のローソク足の間にギャップがあります。ボリュームサポートのないレベル間のゾーンを形成し、価格修正につながることがよくあります。 BPR   (バランス価格範囲) は、2 つの FVG パターンの組み合わせで、「ブリッジ」を形成します。これは、価格がボリュームアクティビティの少ない動きで動くときに、ブレイクアウトしてレベルに戻るゾーンで、ローソク足の間にギャップを作成します。 これらのパターンは、大規模な市場プレーヤーと一般参加者の相互作用が発生するチャート上のボリュームと価格動向の分析に基づいて、トレーダーが主要なサポート/レジスタンス レベル、ブレイクアウト ゾーン、エントリ ポイントを識別するのに役立ちます。 インジケーターは、長方形と矢印の形でパターンを視
EARLY REMINDER: The Starting price is 65 price will rise soon up to 365$ and then 750$ after first 10 copies of sales. Grab this offer now! Introduction Hello, traders! Welcome to the demonstration of the Forex Beast Indicator , a comprehensive tool designed to assist aspiring traders in navigating the complexities of the forex market. This indicator incorporates seven essential components to provide a well-rounded trading experience: Moving Averages Colored Zones Support and Resistance Levels
Heiken Ashi candle chart is an improved version of The Japanese candle chart, which can effectively filter the market "noise" of the Japanese candle chart. It is favored by many traders for its simplicity and intuition. For trend traders, the HA candle chart is a magic tool. Unlike the traditional Japanese candle chart, Heikenashi does not reflect the opening price, high price, low price and closing price of the market. Instead, Heikenashi calculates the value of a single K line in the dominant
We present you the indicator "Candle closing counter", which will become your indispensable assistant in the world of trading. That’s why knowing when the candle will close can help: If you like to trade using candle patterns, you will know when the candle will be closed. This indicator will allow you to check if a known pattern has formed and if there is a possibility of trading. The indicator will help you to prepare for market opening and market closure. You can set a timer to create a pre
The indicator displays the data of the Stochastic oscillator from a higher timeframe on the chart. The main and signal lines are displayed in a separate window. The stepped response is not smoothed. The indicator is useful for practicing "manual" forex trading strategies, which use the data from several screens with different timeframes of a single symbol. The indicator uses the settings that are identical to the standard ones, and a drop-down list for selecting the timeframe. Indicator Paramet
これは、価格ラベル付きのAdvanced ZigZagDynamic および/または ExtendedFractals インジケーターの極値に基づくサポートおよびレジスタンスレベルのMTFインジケーターです(無効にすることができます)。 MTFモードでは、より高いTFを選択できます。デフォルトでは、レベルはZigZagインジケータードットに基づいて生成されます。フラクタルインジケータードットは、ZigZagと一緒に、またはその代わりに使用することもできます。使用を簡素化し、CPU時間を節約するために、計算はバーの開口部ごとに1回実行されます。 パラメーター: ForcedTF-レベル計算のチャート時間枠(現在の時間枠と等しいか、それを超える場合があります) MinPipsLevelWidth-ポイント単位の最小レベル幅(非常にタイトなレベルに使用) Use ZigZag Extremums points -ZigZagピークを使用してサポート/抵抗レベルを計算することを有効/無効にします Fixed pips range -ジグザグインジケーターを計算するための最小値と最大値の間の距離
The Stepping Trend Indicator     The Steppi ng Trend indicator uses the  average true range  (ATR indicator) in its calculation. This gives you control to set your own average true range period, I set the Default as 10.   Indicator Details. Green Arrow Up: This means you are at the starting point of a new bullish trend, it’s time to buy.   Red  Arrow  Down : This means you are at the starting point of a new  bearish  trend, it’ s time to sell .   What if you miss the Arrow Signal?   No prob
The Super Arrow Indicator provides non-repainting buy and sell signals with exceptional accuracy. Key Features No repainting – confirmed signals remain fixed Clear visual arrows: green for buy, red for sell Real-time alerts via pop-up, sound, and optional email Clean chart view with no unnecessary clutter Works on all markets: Forex, gold, oil, indices, crypto Adjustable Parameters TimeFrame Default: "current time frame" Function: Sets the time frame for indicator calculation Options: Can be set
VR Cub
Vladimir Pastushak
VR Cub は、質の高いエントリーポイントを獲得するためのインジケーターです。このインジケーターは、数学的計算を容易にし、ポジションへのエントリーポイントの検索を簡素化するために開発されました。このインジケーターが作成されたトレーディング戦略は、長年にわたってその有効性が証明されてきました。取引戦略のシンプルさはその大きな利点であり、初心者のトレーダーでもうまく取引することができます。 VR Cub はポジション開始ポイントとテイクプロフィットとストップロスのターゲットレベルを計算し、効率と使いやすさを大幅に向上させます。取引の簡単なルールを理解するには、以下の戦略を使用した取引のスクリーンショットを見てください。 設定、設定ファイル、デモ版、説明書、問題解決方法は、以下から入手できます。 [ブログ] レビューを読んだり書いたりすることができます。 [リンク] のバージョン [MetaTrader 5] エントリーポイントの計算ルール ポジションをオープンする エントリーポイントを計算するには、VR Cub ツールを最後の高値から最後の安値までストレッチする必要があります。 最初
[ZhiBiCCI]インディケータは全てのサイクル使用に適しており、そして全ての市場品種にも適しています。 [ZhiBiCCI]緑色の実線は強気の発散の逆転です。緑色の点線は古典的な強気の発散です。 [ZhiBiCCI]赤への実線は逆弱気の発散である。赤い点線は古典的な弱気の発散です。 [ZhiBiCCI]はパラメータ(アラート、メール送信、通知送信)で設定でき、(true)に設定するとインスタント信号をアラームウィンドウに送信し、Eメール、インスタントメッセージを送信できます。 パラメータ設定の説明 [displayAlert]:これはアラームスイッチで、trueに設定され、矢印が表示されればプロンプトに自動的に警告され、falseに設定されれば警告されません。 [sendmail_NO_OFF]:これはメールを送信するためのスイッチで、trueに設定します。矢印が表示されていればMT4で設定したメールボックスにメールを送信し、falseに設定されていればメールを送信しません。 [sendnotification_NO_OFF]:これはインスタントメッセージを送信するた
Money Flow Profile MT5 HERE   Here   our more valuable tools SMC Trend Trading   ,  Easy SMC Trading  ,  Institutional SMC Architect Volume Analysis Tools  ,  Volume flow Profile  ,  Market volume profile  , FVG with Volume  , Liquidity Heatmap Profile  ,  Volume Spread Analysis This Master Edition is engineered for clarity and speed, featuring a unique Auto-Theme Sync system that instantly beautifies your chart layout upon loading. Key Features: True Money Flow Calculation: Goes beyond stand
"The trend is your friend" is one of the best known sayings in investing, because capturing large trendy price movements can be extremely profitable. However, trading with the trend is often easier said than done, because many indicators are based on price reversals not trends. These aren't very effective at identifying trendy periods, or predicting whether trends will continue. We developed the Trendiness Index to help address this problem by indicating the strength and direction of price trend
Improved version of the free HMA Trend indicator (for MetaTrader 4) with statistical analysis. HMA Trend is a trend indicator based on the Hull Moving Average (HMA) with two periods. HMA with a slow period identifies the trend, while HMA with a fast period determines the short-term movements and signals in the trend direction. The main differences from the free version: Ability to predict the probability of a trend reversal using analysis of history data. Plotting statistical charts for analyzi
About the Lyne indicator Lyne is a Metatrader 4 (MT4) indicator, the essence of which is to transform the accumulated historical data. The Lyne indicator makes it possible to detect various features and patterns in price dynamics that are invisible to the naked eye. Based on this information, traders can anticipate further price movement and adjust their strategy accordingly. This indicator has proven itself in the scalping strategy. The indicator works without repainting.
Magic Filter MTF is perfect for any strategy. you do not need to load the chart with extra indicators like this one indicator will replace all additional filters for you it can also be a great strategy. it combines well with trading at local minima and maximums (resistance levels) multi-timeframe-multi-currency indicator 4 screen system is used 4 rows of arrows UTB indicators adjusted for different periods when two arrows pointing in the same direction on the same timeframe coincide,I t c
このプロダクトを購入した人は以下も購入しています
Neuro Poseidon is a new indicator by Daria Rezueva. It combines precise trading signals with adaptive TP/SL levels - creating best possible trades as a result! Message me and get  Neuro Poseidon Assistant  as a gift to automize your trading process! What makes it stand out? 1. Proven profitability on all assets and timeframes 2. Only confirmed BUY and SELL signals present on the chart 3. Adaptive TP & SL levels generated by the software for each trade 4. Easy to understand - suitable for all
Gann Made Easy は、ミスター・ギャンの理論を使用した取引の最良の原則に基づいた、プロフェッショナルで使いやすい外国為替取引システムです。 W・D・ガン。このインジケーターは、ストップロスとテイクプロフィットレベルを含む正確な買いと売りのシグナルを提供します。 PUSH通知を利用して外出先でも取引可能です。 ご購入後、取引方法の説明と優れた追加インジケーターを無料で入手するには、私にご連絡ください! おそらく、ギャンの取引手法についてはすでに何度も聞いたことがあるでしょう。通常、ギャンの理論は初心者のトレーダーだけでなく、すでにある程度の取引経験がある人にとっても非常に複雑なものです。なぜなら、ギャンの取引手法は理論的にはそれほど簡単に適用できるものではないからです。私はその知識を磨き、最良の原則を私の外国為替インジケーターに組み込むために数年を費やしました。 このインジケーターは非常に簡単に適用できます。必要なのは、それをチャートに添付し、簡単な取引推奨事項に従うだけです。このインジケーターは常に市場分析の仕事を行い、取引の機会を探します。適切なエントリーポイントを検出す
Prop Firm Sniper MT4  is a professional market structure indicator that automatically identifies high-probability BUY and SELL opportunities using BOS and CHoCH analysis. Recommended Timeframes: For backtesting, use the indicator on   M5 or M15   for Gold (XAUUSD), and   M15 or H1   for more volatile Forex pairs such as   GBPUSD, USDJPY, EURGBP , and similar markets. CONTACT ME AFTER PURCHASE TO CLAIM YOUR FREE BONUSES! Prop Firm Sniper  is a professional market structure indicator designed t
M1 SNIPER は使いやすいトレーディングインジケーターシステムです。M1時間足向けに設計された矢印インジケーターです。M1時間足でのスキャルピングのためのスタンドアロンシステムとして、また既存のトレーディングシステムの一部としても使用できます。このトレーディングシステムはM1時間足での取引に特化して設計されていますが、他の時間足でも使用できます。元々、この手法はXAUUSDとBTCUSDの取引用に設計しましたが、他の市場においても役立つと考えています。 インジケーターのシグナルは、トレンドの方向と逆方向に取引できます。インジケーターのシグナルを利用して両方向に取引するのに役立つ特別な取引テクニックをご紹介します。この手法は、特別な動的なサポートとレジスタンスの価格帯を利用することに基づいています。 ご購入後、M1 SNIPER矢印インジケーターをすぐにダウンロードできます。さらに、M1 SNIPERツールのすべてのユーザーに、以下のスクリーンショットに表示されているApollo Dynamic SRインジケーターを無料で提供しています。この2つのインジケーターを組み合わせることで
Trend Catcher ind
Ramil Minniakhmetov
5 (9)
トレンドキャッチャーインジケーター トレンドキャッチャーインジケーターは、開発者独自の適応型トレンド分析指標を組み合わせることで、市場価格の動きを分析します。短期的なノイズを除去し、根底にあるモメンタムの強さ、ボラティリティの拡大、価格構造の挙動に焦点を当てることで、真の市場方向性を特定します。また、移動平均線、RSI、ボラティリティフィルターなどの平滑化およびトレンドフィルタリング機能を備えたカスタマイズ指標も使用します。 実際の運用状況のモニタリングやその他の製品については、こちらをご覧ください: https://www.mql5.com/en/users/mechanic/seller ご注意ください。私はTelegramでEAや設定を販売していません。詐欺です。すべての設定はブログで無料で公開しています。 重要!ご購入後すぐにご連絡ください。手順とボーナスをお送りします!
この製品は 2026 年の市場向けに更新され、最新の MT5 ビルドに最適化されています。 価格更新のお知らせ: Smart Trend Trading System は現在 $99 で提供されています。 次の 30 件の購入 後、価格は $199 に上がります。 特別オファー: Smart Trend Trading System を購入後、私にプライベートメッセージを送ることで、 Smart Universal EA を無料 で受け取り、Smart Trend のシグナルを自動売買に変えることができます。 Smart Trend Trading System は、リペイントなし、再描画なし、遅延なしの完全なトレーディングシステムです。よりクリーンなシグナル、より明確なトレンド方向、そしてより整理された取引方法を求めるトレーダー向けに作られています。 Online course , manual and [download presets] . このシステムは、トレンド検出、反転ゾーン、Smart Cloud、トレーリングストップロジック、サポートとレジスタンス、ローソク足の色分け
ORB Seeker
Marcela Goncalves De Oliveira
発売記念特別価格! たったの59ドル! 10個売れた後、価格は値上げされ、最終価格は199ドルになります。 ご購入後、ご連絡いただければ、ブレイクアウトシグナルに基づいて完全に自動化された最適化済み設定ファイルで取引できる無料のボーナスEAをお送りします。 クリーンなセッションブレイクアウトを自信を持ってキャッチしましょう! ORB Seekerは、正確性、シンプルさ、柔軟性、そして明確なチャート構造を求めるトレーダー向けに開発された、プロ仕様のオープニングレンジブレイクアウト(ORB)インジケーターです。 このシステムは、あらゆる銘柄のプレマーケットまたはカスタムセッションのレンジを自動的にプロットし、エントリー、ストップロス、テイクプロフィット、およびオプションの50%部分TPレベルを含む明確なブレイクアウトシグナルを提供します。すべての計算結果はリアルタイムでチャート上に表示されます。 ロンドン市場オープン、ニューヨーク市場セッション、アジア市場セッション、または独自のカスタム市場時間帯で取引できます。ORB Seekerは選択したセッション時間帯に合わせて調整されるため、市
RelicusRoad Pro: 定量的市場オペレーティングシステム 【期間限定】無制限アクセス 70% OFF - 2,000人超のトレーダーと共に なぜ多くのトレーダーは「完璧な」インジケーターを使っても失敗するのでしょうか? それは、文脈を無視して 単一の概念 だけでトレードしているからです。文脈のないシグナルは単なるギャンブルです。勝ち続けるには、 根拠の重なり(コンフルエンス) が必要です。 RelicusRoad Proは単なる矢印インジケーターではありません。完全な 定量的市場エコシステム です。独自のボラティリティモデリングを用いて、価格が推移する「適正価値の道(Fair Value Road)」をマッピングし、ノイズと真の構造的ブレイクを判別します。 推測はやめましょう。機関投資家レベルの「ロード・ロジック」でトレードを。 コアエンジン:「Road」アルゴリズム システムの中心となる Road Algo は、市場環境にリアルタイムで適応するダイナミックなボラティリティチャネルです。 安全ライン(平衡点) と、価格が数学的に反転しやすい 拡張レベル を投影します。 Si
Miraculous Indicator – ガン・スクエア・オブ・ナインに基づく100%非リペイントのFXおよびバイナリーツール この動画では、FXおよびバイナリーオプションのトレーダー向けに特別に開発された、非常に正確で強力な取引ツールである Miraculous Indicator を紹介しています。このインジケーターがユニークなのは、伝説的な ガン・スクエア・オブ・ナイン と ガンの振動の法則 に基づいている点で、現代の取引で利用できる最も正確な予測ツールの一つとなっています。 Miraculous Indicatorは 完全に非リペイント であり、ローソク足が確定した後にシグナルが変化したり消えたりすることはありません。つまり、見たものがそのまま利用できます。これにより、トレーダーは自信を持ってエントリーおよびエグジットを行うための信頼性と一貫性のある根拠を得ることができます。 主な特徴: ガン・スクエア・オブ・ナインとガン理論に基づいて構築 100%非リペイントのシグナルシステム すべての時間枠(M1、M5、H1、H4、日足、週足)で機能 FXおよびバイナリーオプション取引
BTMM State Engine Pro is a MetaTrader 4 indicator for traders who use the Beat The Market Maker approach: Asian session context, kill zone timing, level progression, peak formation detection, and a multi-pair scanner from a single chart. It combines cycle state logic with a built-in scanner dashboard so you do not need the same tool on many charts at once. What it does Draws the Asian session range; session times can follow broker server offset or be set in inputs. Tracks level progression (L
Scalper Inside PRO Scalper Inside PRO は、独自の内蔵アルゴリズムを用いて相場の方向性や主要なターゲット価格を評価する、デイトレード向けのトレンド&スキャルピングインジケーターです。本インジケーターはエントリーポイントとエグジットポイント、および複数の利益確定ターゲット価格を自動的に計算し、詳細なパフォーマンス統計を表示します。これにより、さまざまな銘柄や戦略がヒストリカルデータ上でどのように機能したかを確認できます。これは、現在の相場環境に適した銘柄を選ぶのに役立ちます。また、ご自身の矢印インジケーターを Scalper Inside PRO に接続し、その統計やヒストリカルシグナルをすばやく確認することも可能です。 Scalper Inside PRO マニュアルおよび設定の説明: こちらをクリックして読む 本インジケーターはあらゆる銘柄および時間足で動作し(デイトレードには M5 を推奨)、複数の内蔵戦略を備えています。単独のスキャルピングツールとして、またトレードシステムの分析コンポーネントとして使用できます。 主な機能 独自の次世代トレ
Price & Time Market Structure Indicator A professional market structure tool that analyzes waves through both price and time — not price alone. Main Description NeoWave PRO is a professional market structure indicator for MetaTrader 4 designed for traders who want to move beyond traditional one-dimensional wave tools such as ZigZag, swing indicators, and basic high/low systems. Most wave indicators analyze only one thing: Price. But a real market wave is not only a price movement. A true wave de
Dynamic Forex28 Navigator - 次世代の Forex 取引ツール。 現在 49% オフ。 Dynamic Forex28 Navigator は、長年人気のインジケーターを進化させたもので、3 つの機能を 1 つにまとめています。 Advanced Currency Strength28 インジケーター (レビュー 695 件)  + Advanced Currency IMPULSE with ALERT (レビュー 520 件) + CS28 コンボ シグナル (ボーナス)。 インジケーターの詳細 https://www.mql5.com/en/blogs/post/758844 次世代の Strength インジケーターが提供するもの  オリジナルで気に入っていたすべての機能が、新機能と精度の向上によって強化されました。 主な機能: 独自の通貨強度計算式。 すべての時間枠でスムーズかつ正確な強度ライン。 トレンドの特定と正確なエントリーに最適です。 ダイナミックマーケットフィボナッチレベル (マーケットフィボナッチ)。 このインジケーターに固有
トレンドトレーディング は、タイミングのプルバックとブレイクアウトにより、市場で起こっているトレンドから可能な限り利益を得るように設計された指標です。確立されたトレンドの中で価格が何をしているかを分析することにより、取引の機会を見つけます。 [ インストールガイド | 更新ガイド | トラブルシューティング | よくある質問 | すべての製品 ] 自信を持って効率的に金融市場を取引する むち打ちにならずに確立されたトレンドから利益を得る 収益性の高いプルバック、ブレイクアウト、早期の逆転を認識する この指標は、独自の品質とパフォーマンスを分析します 複数時間枠のダッシュボードを実装します インジケーターは再描画されていません 電子メール/音声/視覚アラートを実装します 確立されたトレンドは多くの取引機会を提供しますが、ほとんどのトレンド指標はそれらを完全に無視しています。インジケーターの解釈はかなり簡単です: (1) トレンドの変化 (2) トレンドの方向への後退 (3) トレンドの方向へのブレイクアウト 赤いダッシュ は下降トレンド中の修正です 青いダッシュ は上昇トレンド中
この製品は 2026 年の市場向けに更新され、最新の MT5 ビルドに最適化されています。 価格更新のお知らせ: Atomic Analyst は現在 $99 で提供されています。 次の 30 件の購入 後、価格は $199 に上がります。 特別オファー: Atomic Analyst を購入後、私にプライベートメッセージを送ることで、 Smart Universal EA を無料 で受け取り、Atomic Analyst のシグナルを自動売買に変えることができます。 Atomic Analyst は、リペイントなし、再描画なし、遅延なしの Price Action トレーディングインジケーターで、手動取引、シグナルの明確化、EA 自動化のために設計されています。 User manual: settings, inputs and strategy.     &   User Manual PDF . 価格行動、強さ、モメンタム、マルチタイムフレーム方向、高度なフィルターを分析し、トレーダーがノイズを減らし、弱いセットアップを避け、より構造化された取引判断を行えるようにします。 こ
CRT Candle Range Theory HTF MT4.   Ultimate CRT Indicator: Advanced ICT Concepts and Malaysian SnR Trading System Master the Market Maker's Footprints with the Most Advanced Candle Range Theory Indicator Discounted   Price   $50  !!     Secure your lifetime access   now   before it switches to   subscription-only ! Unlock the true power of  Smart Money Concepts (SMC)  and trade precisely like the institutions with the  Ultimate CRT Indicator . Built exclusively for serious traders, this indicat
現在40%オフ 初心者やエキスパートトレーダーに最適なソリューション! このインジケーターは、独自の機能と新しい計算式を取り入れた、ユニークで高品質、かつ手頃な価格のトレーディングツールです。たった1枚のチャートで28の為替ペアの通貨強度を読み取ることができます。新しいトレンドやスキャルピングチャンスの引き金となるポイントを正確に特定することができるので、あなたのトレードがどのように改善されるか想像してみてください。 ユーザーマニュアルはこちら  https://www.mql5.com/en/blogs/post/697384 これが最初の1本、オリジナルだ! 価値のないクローンを買わないでください。 特別な サブウィンドウの矢印で強い通貨の勢いを表示 GAPがあなたのトレードを導く! 基準通貨や気配値が売られすぎ・買われすぎのゾーン(外相フィボナッチレベル)にあるとき、個別チャートのメインウィンドウに警告表示。 通貨がレンジの外側から反落した場合、プルバック/リバーサルのアラート。 クロスパターンの特別なアラート 複数の時間枠を選択可能で、トレンドを素早く確認できます
現在40%オフ! 初心者やエキスパートトレーダーに最適なソリューション! このインジケータは、独自の機能と秘密の数式を組み込んだ、ユニークで高品質かつ手頃な価格のトレーディングツールです。たった1枚のチャートで28の通貨ペアのアラートを表示します。新しいトレンドやスキャルピングチャンスの引き金となるポイントを正確に把握することができるので、あなたのトレードがどのように改善されるか想像してみてください! 新しい基本的なアルゴリズムに基づいて構築されているため、潜在的な取引の特定と確認がより簡単になります。これは、通貨の強さや弱さが加速しているかどうかをグラフィカルに表示し、その加速のスピードを測定するためです。加速すると物事は明らかに速く進みますが、これはFX市場でも同じです。つまり、反対方向に加速している通貨をペアにすれば、利益を生む可能性のある取引を特定することができるのです。 通貨の勢いを示す縦の線と矢印は、あなたの取引の指針となるでしょう。 ダイナミックマーケットフィボナッチ23レベルはアラートトリガーとして使用され、市場の動きに適応します。もしインパルスが黄色のトリガ
KURAMA GOLD SIGNAL PRO(MT4版)— 7層フィルター・自動TP/SL・品質スコア・サイン履歴保存搭載 XAUUSD完全トレードシステム リアルタイムでリペイントしません。サインが出た瞬間、矢印・エントリー・TP・SLはその場で固定され、後から動きません。あなたがトレードするのは、この「リアルタイムで出たサイン」です。さらにv7.20では、実際に通知されたサインを自動保存し、再起動後もそのまま復元します。 購入者限定特典 買い切りライセンスをご購入いただいた方に、AI Zone Radar($59相当)+完全PDFマニュアルを無料プレゼント。本体価格に$59相当の特典が付いてきます。購入後にMQL5でメッセージをお送りください。 AI Zone Radar: https://www.mql5.com/en/market/product/175834 ゴールドトレーダーのコミュニティで実際に使用され、精度と使いやすさで高く評価されています。 あな
MetaBands M4
Vahidreza Heidar Gholami
3.5 (6)
MetaBandsは、強力でユニークなアルゴリズムを使用してチャンネルを描画し、トレンドを検出して、トレーダーに取引の入出ポイントを提供することができます。チャンネル指標に加えて、強力なトレンド指標でもあります。入力パラメータを使用して新しいチャンネルを作成するために、異なるタイプのチャンネルを統合することができます。MetaBandsは、市場のイベントについてユーザーに通知するために、すべてのタイプのアラートを使用します。 特徴 ほとんどのチャンネルアルゴリズムをサポート 強力なトレンド検出アルゴリズム 異なるタイプのチャンネルを統合する能力 マルチタイムフレームおよびマルチカレンシー(シグナルマトリックス) すべてのタイプのアラート機能(サウンド、画面フラッシャー、プッシュ通知、メール、ポップアップ、矢印) 再描画しない トレンド検出 MetaBandsは、チャネル内を振動する青いラインを使用してトレンドを検出します。ラインがチャネルの上部バンドに達すると、下降トレンドの開始を示し、下部バンドに達すると上昇トレンドの開始を示します。青いラインが中心ラインに近づくと、市場はコンソリ
PRO Renko Systemは、特別にRENKOチャートを取引するために設計された高精度の取引システムです。 これは、様々な取引商品に適用することができる普遍的なシステムです。 システムは効果的に正確な逆転信号へのアクセスを与えるいわゆる市場の騒音を中和する。 表示器は非常に使いやすく、信号の生成に責任がある1つの変数だけがあります。 あなたは簡単にお好みの任意の取引ツールとレンコバーのサイズにツールを適応させることができます。 私はいつもあなたが私のソフトウェアで収益性の高い取引を支援するために余分なサポートを提供する準備ができています! 私はあなたに幸せで収益性の高い取引をしたいです! ご購入後にご連絡ください! 私はあなたに私のレンコチャートジェネレータを送信します。 私はまた、私の個人的な推奨事項やシステムの他のモジュールを無料で共有します!
このインジケーターは実践的なトレードに最適な自動波動分析のインジケーターです! 場合... 注:   Tang Lun (Tang Zhong Shuo Zen) の命名規則の影響で、私は波のグレーディングに西洋の名前を使用することに慣れていません。基本的な波を ペン 、二次波のバンドを セグメント と名付けました。同時に、 セグメント にはトレンドの方向が指定されます (この命名方法は将来のノートで使用されます。最初に言っておきます)。ただし、アルゴリズムは曲がりくねった理論とはほとんど関係がないため、付けるべきではありません。これは、私の市場分析 によって要約された、絶えず変化する複雑な運用ルール を反映しています。 バンドは標準化され、人によって異なることがないよう定義されており、市場参入を厳密に分析する上で重要な役割を果たす人為的な干渉の描画方法が排除されています。 このインジケーターを使用することは、取引インターフェイスの美しさを改善することと同等であり、元の K ライン取引を放棄し、取引の新しいレベルに連れて行きます。また、宣伝の観点から顧客の認識も向上します。 イ
Advanced Supply Demand
Bernhard Schweigert
4.91 (300)
現在30%オフ 初心者にもエキスパートトレーダーにも最適なソリューション このインジケーターは独自の機能と新しい公式を多数内蔵しており、ユニークで高品質かつ手頃な取引ツールです。このアップデートでは、2つの時間枠ゾーンを表示できるようになります。より長いTFだけでなく、チャートTFとより長いTF(ネストゾーンを表示)の両方を表示できます。すべてのSupply Demandトレーダーの皆さんのお気に召すはずです。:) 重要情報の公開 Advanced Supply Demandの可能性を最大化するには、 https://www.mql5.com/ja/blogs/post/720245 にアクセスしてください。   エントリーまたはターゲットの正確なトリガーポイントを正確に特定できれば取引がどのように改善されるか想像してみてください。新しい基盤となるアルゴリズムに基づいて構築されているため、買い手と売り手の間の潜在的な不均衡をさらに簡単に特定できます。これは、最も強い需要と供給のゾーンと、過去のパフォーマンス(古いゾーンを表示)がグラフィカルに表現されるためです。これらの機能は、最適な
IX Power MT4
Daniel Stein
4.82 (11)
IX Power: 指数、商品、暗号資産、外国為替市場の洞察を発見 概要 IX Power は、指数、商品、暗号資産、外国為替市場の強弱を分析するための多用途ツールです。 FX Power が全ての利用可能な通貨ペアデータを活用して外為ペアで最高の精度を提供する一方、 IX Power は基礎資産の市場データにのみ焦点を当てています。この特性により、 IX Power は非外為市場に最適であり、単純な外為分析にも信頼性の高いツールです。どのチャートでもスムーズに機能し、取引判断を向上させるための明確で実行可能な洞察を提供します。 1. IX Power がトレーダーにとって価値がある理由 複数市場での強弱分析 • IX Power は指数、商品、暗号資産、外為シンボルの強弱を計算し、それぞれの市場に合わせた洞察を提供します。 • US30、WTI、ゴールド、ビットコイン、または通貨ペアなどの資産を監視して取引機会を発見できます。 幅広い市場に適応 • 外為取引では、 FX Power が関連する全ての通貨ペアを分析することで比類のない精度を提供します。 • IX Power
Reversal Identifier MT5 - チャート上の反転ポイントを検出できるインジケーターです。 再描画や遅延なしで動作し、フラクタルピークとトラフを識別し、反転ポイントを矢印で表示します。 このインジケーターは、トレンドの方向転換や調整が起こる前の早期反転ポイントを特定します。 このインジケーターの最適な使用方法は、2つの時間足を使用することです。上位時間足でトレンドを判断し、下位時間足でエントリーシグナルを受け取ります。 このインジケーターは単独で使用することも、他のインジケーターやトレーディングシステムと組み合わせて使用​​することもできます。 "Filter level" は、矢印の表示頻度を調整するパラメーターで、1 から 5 の範囲で設定できます。これにより、矢印の表示頻度を制御し、リスクと機会を調整できます。 あらゆる金融商品で使用できるように設定されています。 適切な時間足は、M5、M15、M30、H1、H4です。青色の矢印は下降反転、赤橙色の矢印は上昇反転を示します。 このインジケーターは再描画しません。矢印はローソク足の終値で固定されます。 矢
Multicurrency and multi-timeframe indicator Inside Bar (IB). In the parameters, you can specify any desired currencies and timeframes. The panel displays the last found Inside Bar (and Mother Bar) pattern, the current price position and the breakout of the levels of the Mother and Inside Bars. You can set the size and color for bars and text in the cells. The indicator can also send notifications when levels are broken. The dashboard highlights Double Inside Bar in a special color. By clicking
トレンドラインプロ   市場の真の方向転換点を理解するのに役立ちます。この指標は、真のトレンド反転と主要プレーヤーが再び参入するポイントを示します。 分かりますか     BOSライン   複雑な設定や不要なノイズなしに、より長い時間足でのトレンドの変化と重要なレベルを把握できます。シグナルは再描画されず、バーが閉じた後もチャート上に残ります。 VERSION MT 5     -     RFI LEVELS PRO インジケーター と組み合わせることで、その潜在能力を最大限に発揮します。 インジケーターが示す内容: 本当の変化   トレンド(BOSライン) 一度シグナルが現れたら、それは有効です!これは、リペイント機能を持つインジケーターとの重要な違いです。リペイント機能を持つインジケーターは、シグナルを発した後、それを変更し、資金の損失につながる可能性があります。これにより、より高い確率と精度で市場に参入できます。また、矢印が現れた後、目標値(利益確定)に達するか、反転シグナルが現れるまで、ローソク足の色を変更する機能もあります。 繰り返しエントリ       主要プレーヤーの
Enigmera
Ivan Stefanov
5 (8)
ENIGMERA: 市場の中心 重要:MQL5.comのデモはStrategy Testerで実行されており、Enigmeraの機能を完全には反映していない場合があります。詳細については、説明、スクリーンショット、ビデオをご確認ください。質問があれば、遠慮なくメッセージを送ってください! インジケーターのコードは完全に書き直されました。バージョン3.0は新機能を追加し、インジケーターの開始以来蓄積されたバグを修正しました。 紹介 このインジケーターとトレーディングシステムは、金融市場への注目すべきアプローチです。ENIGMERAはフラクタルサイクルを使用して、サポートとレジスタンスのレベルを正確に計算します。真の蓄積フェーズを示し、方向と目標を提供します。トレンドでも修正でも機能するシステムです。 動作方法 インジケーターのほとんどの機能は、チャートの左側にあるボタンで制御され、市場の状況に迅速に対応できるようになっています。 ボタン ON/OFF – インジケーター全体を表示または非表示にします。 Channel – サポートチャネルを有効にし、許容範囲の偏差を示します。 Dev
Current event:  https://c.mql5.com/1/326/A2SR2025_NoMusic.gif A. A2SR とは何ですか ?   * 先行テクニカル指標です (塗り直しなし、ラグなし)。 -- ガイダンス : -- https://www.mql5.com/en/blogs/post/734748/page4#comment_16532516 -- そして https://www.mql5.com/en/users/yohana/blog A2SR には、サポート (需要) とレジスタンス (供給) のレベルを決定する特別な手法があります。 ネットで見かける通常の方法とは異なり、A2SR は実際の SR レベルを決定する独自のコンセプトを持っています。 元の手法はインターネットから取得されたものではなく、インターネット上で公開されたこともありません。 A2SR は、取引スタイルに応じて SR レベルを自動選択します。 時間枠を変更しても、SR レベルはその位置にとどまります。 実際のSRは、使用する時間枠から取得されるわけではないため. A2SR
多くの矢印インジケーターは、シグナルだけを表示して、その後の判断はすべてトレーダー任せです。KT Alpha Hunter Arrows は、最初から完成されたトレードプランを提供します。 各シグナル矢印が表示されると、エントリーライン、ストップロス、4つのテイクプロフィット水準、そして現在の銘柄と時間足を今トレードする価値があるかを示すリアルタイムのエッジ判定が、チャート上にまとめて描画されます。付属の Trade Manager EA は、手動でエントリーした後の管理をサポートし、相場が荒れて感情が揺れやすい場面でも、トレードの規律を保ちやすくします。リペイントなし。確定足のみでシグナルを表示。Forex、ゴールド、指数、その他あなたが取引するあらゆる銘柄向けに設計されています。 主な機能 リペイントしない買い・売り矢印。シグナルは足が確定した後にのみ表示されます。 各シグナルにエントリーライン、構造的なストップロス、4つのテイクプロフィット水準を表示。 Edge Dashboard が、現在のチャート上で買いと売りのセットアップを個別に評価。 判定システム:No Edge、Ma
作者のその他のプロダクト
A signal indicator consisting of several well-known indicators that process data sequentially. 2 options - for schedule and basement. In the settings it is possible to enable alerts about the change of trend (alerts) sound, by e-mail and push. It is possible to change the colors and thickness of the lines, the colors and codes of the arrows, the number of calculation bars and separately configure the parameters included in the indicators.
FREE
Amka Ccf
VLADISLAV AKINDINOV
4.8 (5)
A trend indicator is a hybrid of several well-known indicators that process data sequentially with signaling a trend change. Final processing of the AMka indicator data. The indicator is conventionally not drawing - upon restarting, it can change some of the chart data, but if you do not touch it, it will not redraw. It is possible to issue an alert, sound, send an e-mail or a message to another terminal when the trend changes.
FREE
Advisor for semi-automatic trading with a virtual multi-level trail of take profit and stop loss, a trail of target profit, martingale functions, manual opening of orders, managing third-party orders, counting trading instruments, displaying current information and statistics on a chart. It is possible to set several levels of trailing take profit and stop loss and to each level to assign the percentage of partial closing of the order. The percentage of the lot when closing the level is calculat
The indicator is a mathematical analog of a two-level RC (resistor-capacitor) filter. On the chart (default colors), the red line is the standard terminal Moving Average, the values ​​of which are filtered by the first level filter (yellow line) and then by the second level filter (blue line). Moving Average sets the preliminary smoothing of the price series.  The indicator has the ability to use the sticking together of any combination of its own charts among themselves, if they are at a dist
Trend indicator with calculation of dynamic levels and signaling their intersection. Description of input parameters: StepTF = true; - Calculation of the indicator by closing the bar (true) or by each tick (false) BarsCount = 300; - Number of settlement bars Price = PRICE_CLOSE; - Type of price used TimeFrame = PERIOD_CURRENT; - Estimated timeframe TrendPeriod = 9; - Trend calculation period TrendDeviations = 4.9; - coefficient of deviation PeriodTrendSmooth = 1; - Trend smoothing perio
MEA2RTEn
VLADISLAV AKINDINOV
The adviser works on the basis of terminal indicators. It can work in martingale mode if you set the number of unidirectional orders to be greater than 1 and adjust the lot coefficients and the step of opening the knees, which can be opened taking into account the indicator signal. If the adviser is launched on several instruments and the comments of the orders are the same, then you can limit the number of simultaneously trading advisers - the advisers themselves will track how much they are c
Arrow indicator of trend reversal with 2-level signaling and multi timeframe. The indicator line consists of 4 colors, indicating the divergence level and possible trend reversals. Light arrows indicate a weak trend, dark arrows indicate a strong one. Sensitivity levels and steps are set in the settings. Signals are output to the mailbox and mobile terminal.
The Expert Advisor trades on a trend reversal on any instrument and timeframe. Testing was carried out on the H4 timeframe. Trades are not frequent and therefore, to increase the number of trades, it is advisable to put on several instruments. To control the number of simultaneously trading advisors, a limit for trading symbols is set and advisors must have the same order comments. Closing deals can be done in virtual mode (preferably). There are information and statistics panels. Indicator base
The indicator is designed for pair trading with 2 highly correlated instruments.  Indicator charts can be displayed as lines or histograms. There is an MTF mode, the maximum and minimum deltas for the calculated number of bars are displayed with a check for a specified minimum value. It is possible to enable the calculation of trade operations with checking the current correlation coefficient for the minimum specified, the current delta in points or percent of the maximum (minimum) delta and c
Growth and trend reversal indicator. It does not redraw in the bar calculation mode and can redraw on the 0th bar in the tick calculation mode. The trend line and level lines with their own settings are calculated separately. There are 2 types of arrows - for the intersection of trend lines and the reverse intersection of trend lines (reversal). The arrows are buffer and you can output signals to the Expert Advisor. The arrows can be duplicated with a sound signal, a message from the terminal,
Indicator of trend deviation with a static level. The deviation coefficient is set for the trend histogram. Signals are the intersection of the level trend histogram in the direction of the trend or during a trend reversal - the option is selected in the indicator settings by the "Revers" parameter. There are all the necessary settings for the design of the indication and sending messages to mail or a mobile terminal. All input parameters have an intuitive name. Analog for MT5: https://www.mql5
The indicator consists of a base of the standard CCI and levels calculated on the basis of MAs, which move following the price. To strengthen the trend movement, the deviation coefficient is used. To exclude triggering in a flat, the minimum trend limiter is used. Signal arrows are displayed on the indicator chart and the price chart - everything is turned off. There is an arrow trigger function - the arrows alternate when it is turned on. You can display signals on a chart, on e-mail and on a m
The utility is designed to control all account orders with the ability to automatically close them by: profit, breakeven or trailing profit in points separately for each order separately profit, breakeven or trailing profit in points for buy orders of each symbol profit, breakeven or trailing profit in points for sell orders of each symbol profit, breakeven or trailing profit in points for buy+sell orders of each symbol profit, breakeven or trailing profit in points for the entire account as a
The indicator is designed to display information about current trading. The current information and statistics panel displays data on the number of trading orders, their profit and the number of lots. The equity status as a percentage of the balance of funds and the total profit of all orders on this instrument are also displayed. In the statistics panel, you can see information on closed orders from the beginning of the specified date in the settings. The panels have flexible settings for size
The Expert Advisor is designed for pair trading with 2 instruments with high positive or negative correlation. Instrument lots are balanced automatically depending on the tick value of the instrument, and therefore it is advisable to use the base lot of at least 0.05. The function of refills is built-in, taking into account the number of knees and the coefficients of multiplication and addition of lots. Trades are opened when there is a discrepancy by a specified distance in points of instrument
The Expert Advisor is designed for pair trading with 2 selected instruments with automatic calculation of the correlation coefficient and determination of one of 8 possible entries by 4 for positive and negative correlation. The inputs used are set in the settings: 1 and 3 for trading for a fall in the delta between instruments, 2 and 3 for trading for a rise in the delta (a more dangerous trading option). There are trade control buttons, information and statistical panels. There is a wide range
The Expert Advisor is based on a proprietary triple indicator. Each of the 3 parts of the indicator can be disabled and individually configured. Initially, it was supposed to enter trade at a trend reversal, but you can set up an entry along the trend. It is possible to control the main functions using the buttons on the chart, including opening positions manually. There are grid functions with the total profit of all unidirectional positions (for hedging accounts) with martingale functions (opt
Indicator of trend deviation with a static level. The deviation coefficient is set for the trend histogram. Signals are the intersection of the level trend histogram in the direction of the trend or during a trend reversal - the option is selected in the indicator settings by the "Revers" parameter. There are all the necessary settings for the design of the indication and sending messages to mail or a mobile terminal. All input parameters have an intuitive name. Analog for MT4: https://www.mql5.
The indicator is designed for pair trading with 2 highly correlated instruments.  Indicator charts can be displayed as lines or histograms. There is an MTF mode, the maximum and minimum deltas for the calculated number of bars are displayed with a check for a specified minimum value. It is possible to enable the calculation of trade operations with checking the current correlation coefficient for the minimum specified, the current delta in points or percent of the maximum (minimum) delta and c
The indicator calculates the correlation coefficient of 2 instruments, shifts the chart of the 2nd instrument relative to the 1st and displays the charts of both instruments on the current chart. The maximum positive and negative deltas and the current delta as a percentage of the maximum are calculated. It is possible for signals to set a delta for entry and exit with displaying the direction of entry into trade for each instrument. The space between the charts is also filled with different col
The scanner is designed to scan signal buffers of indicators (arrows) and display the nearest signal bar on the panel in color and digital display. Symbols to be scanned, time frames and the number of bars to be scanned are specified, starting from the current (0th) bar. There is also a complex signal, which indicates a list of timeframes on which the indicator signal must match.   You can collapse the indicator by clicking the left mouse button on the upper left corner of the panel (name) a
このインジケーターは、前日、週、月の最高値と最低価格を示します。 極値のブレイクアウトを特定し、取引へのエントリーの方向を決定するように設計されています。 反転レベルをより正確に判断するには、フィボナッチ レベルを表示できます。 また、高値と安値の間のスペースにプロットして、前の請求期間中の価格の動きをより明確に示すこともできます。 現在のローソク足(バー)が閉じるまでの時間を示します。 バージョン 2.0 では、ジグザグ反転信号の 3 つの新しいレベルが追加され、各レベルのアラームが提供されます。 This indicator shows the highest and lowest prices of the previous day, week and month. It is designed to identify extreme breakouts and determine the direction of entry into a trade. To more accurately determine reversal levels, you can view Fi
The indicator is designed to help in making a decision on the direction of trading (buy or sell). It is a history scanner that searches for matches of the current pattern (combination of several current bars) with historical data in percentage terms by the relative vertical position of candles relative to each other, the size of each candle, the size of the candle body and the candle shadows. In history, the matches found are indicated by vertical lines on the candle of the beginning of the soug
The indicator is a combination of 3 identical moving averages with a JMA calculation option with different smoothing depth settings. When the fast line crosses the middle and slow lines, the color of all lines changes, and only when the fast line crosses the middle and slow lines in the opposite direction will the color change - a trigger is triggered that does not allow switching directions if only the middle or slow line was crossed, so that the readings do not jump and there is a confident
The indicator is designed to display information about current trading. The current information and statistics panel displays data on the number of trading orders, their profit and the number of lots. The equity status as a percentage of the balance of funds and the total profit of all orders on this instrument are also displayed. In the statistics panel, you can see information on closed orders from the beginning of the specified date in the settings. The panels have flexible size and color se
The Expert Advisor is designed for hedging accounts, as it trades simultaneously in both directions. You can use it for trading a single order or a grid of orders in martingale mode. It uses a built-in indicator consisting of a combination of 5 candlesticks with flexible settings. There is a limit on the number of symbols that can be traded simultaneously. Trading can be performed on any symbol with any timeframe, but it has been optimized for gold trading. The Expert Advisor has built-in func
The Expert Advisor is designed for trading two highly correlated instruments on a hedging account in multi-currency mode. Instruments can be of any type, and the settings include lot optimization options, including manual lot assignment for each instrument. Additional positions can be opened during a drawdown with adjusted initial lots for both instruments simultaneously or only for the one with the drawdown. Trading can be performed in manual, semi-automatic, or automatic mode. Manual control
フィルタ:
レビューなし
レビューに返信