Henry
- インディケータ
- バージョン: 1.2
- アクティベーション: 5

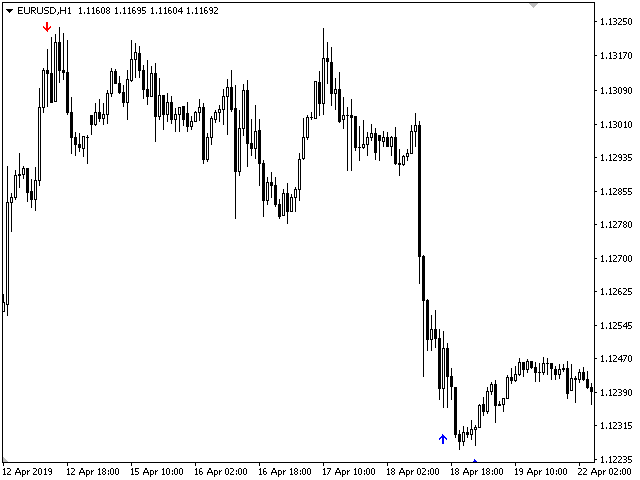
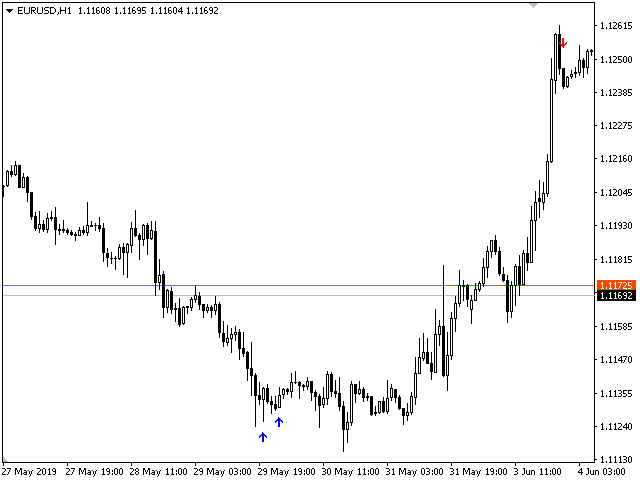
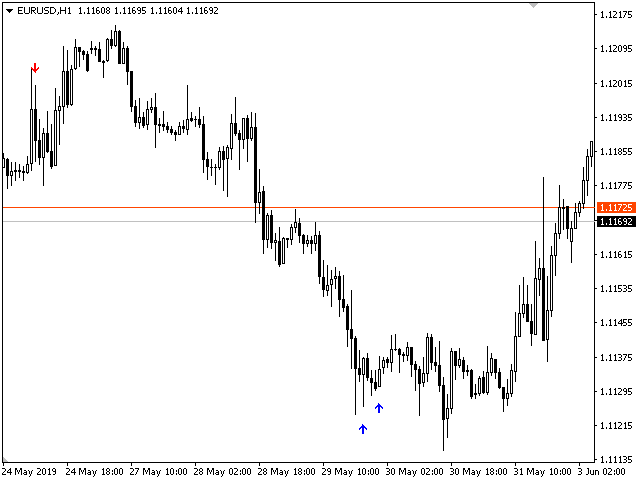
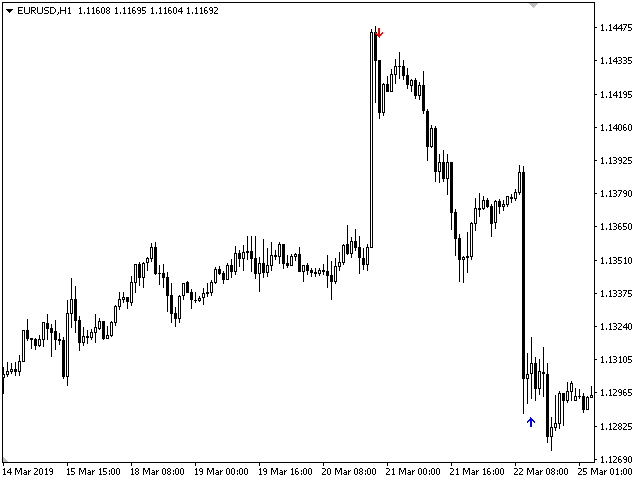
Henry - An indicator by which you can determine the levels and trend. The indicator calculates the saturation levels of the price
chart. A signal to exit the resale area is a buy signal. A signal to exit the overbought area is a sell signal. Usually, you need to set
relative values for the overbought and oversold levels of Bottom and Top - for this indicator.
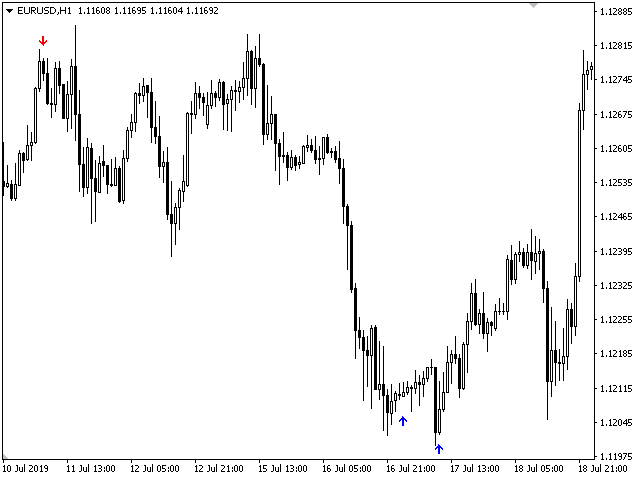
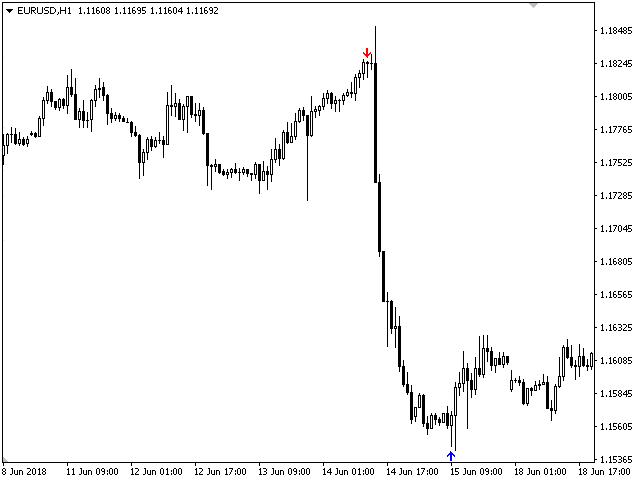
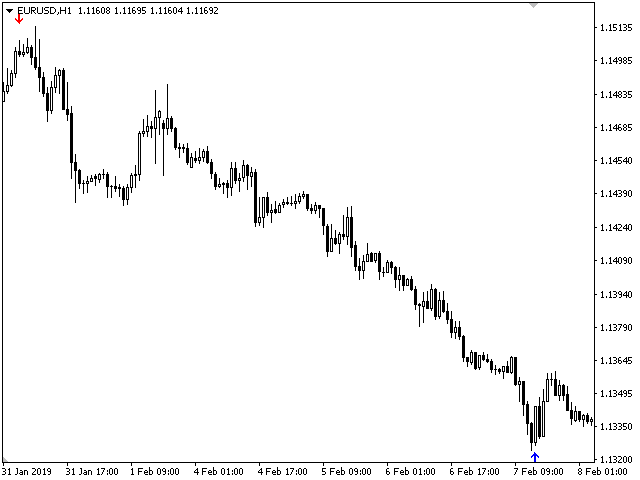
Most often, a good trend is visible on the price chart visually. But an experienced trader must clearly understand the current balance of
power in the market before entering. And the indicator will help the trader make decisions by helping him with appropriate signals.
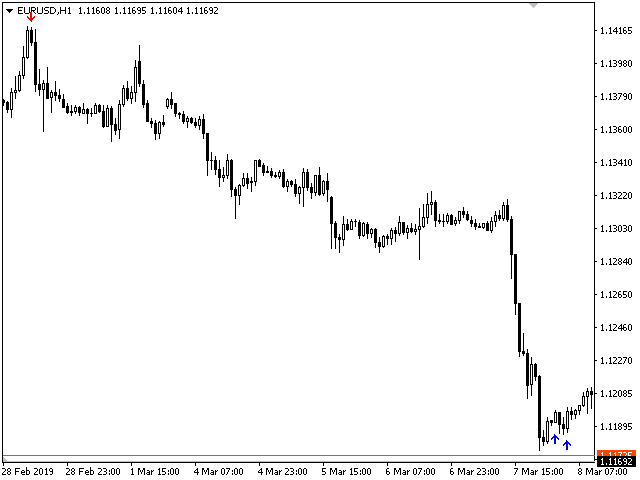
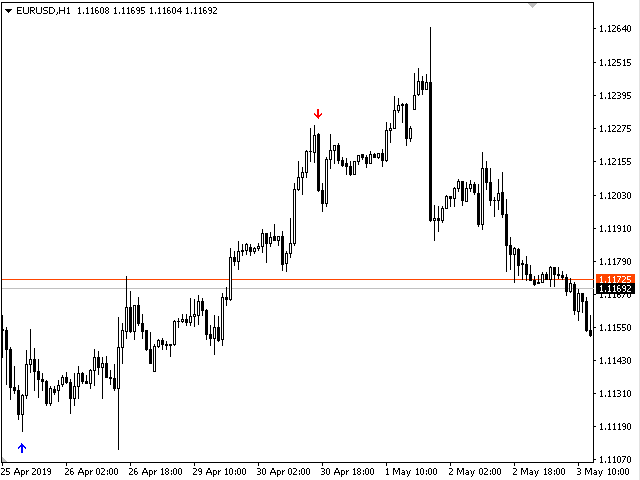
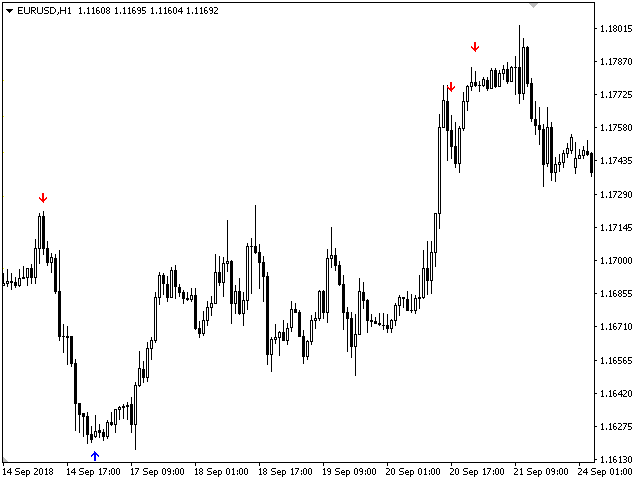
Currency pairs never rise or fall in a straight line. The market uses your fear in order to prevent you from taking advantage of a strong
position. At such times, you are most vulnerable.
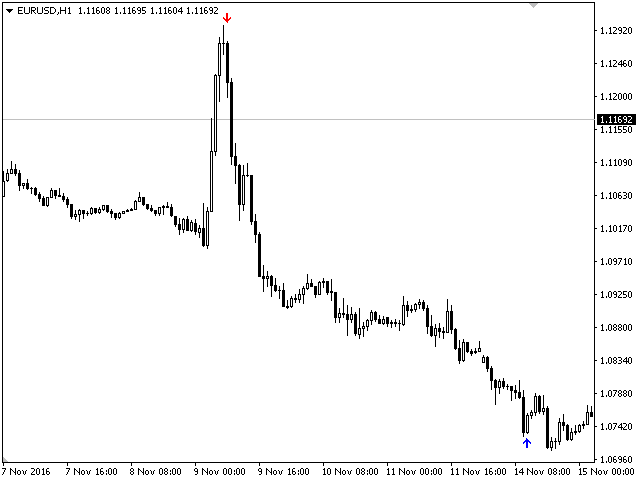
When used simultaneously on multiple timeframes, this indicator will truly "make the trend your friend." With it, you can monitor trends on
multiple time frames in real time. This indicator works on all timeframes.