Zigzag X2
- インディケータ
- バージョン: 1.0
- アクティベーション: 5
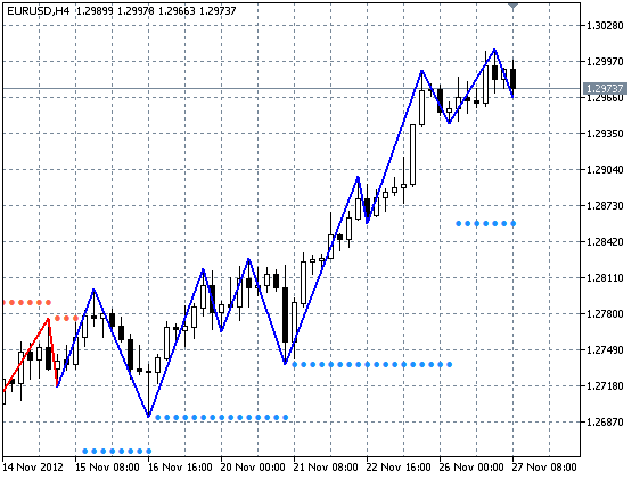
Zigzag x2 The Zig
Zag indicator plots points on the
chart whenever prices reverse by a percentage greater than a pre-chosen variable. Straight lines are then drawn, connecting these points.
The indicator is
used to help identify price trends. It eliminates random price fluctuations and attempts to show trend changes The indicator lowers
the impact of random price fluctuations, highlighting underlying bull and bear power. more · Gartley Pattern Definition