Royal Ace Signal Bar
- インディケータ
-
Harry Irawan Chandra
 Call Me Ace
 - バージョン: 1.0
- アクティベーション: 5
Are you a trend trader tired of noise, spikes and whipsaws? The Royal Ace Signal Bar indicator tracks the market trend with an unmatched reliability, by ignoring sudden fluctuations and market noise around the mean price. It allows you to be steady when everyone else is shaky.
- Amazingly easy to trade
- The indicator needs no optimization at all
- It implements a multi-timeframe dashboard
- The indicator is non-repainting
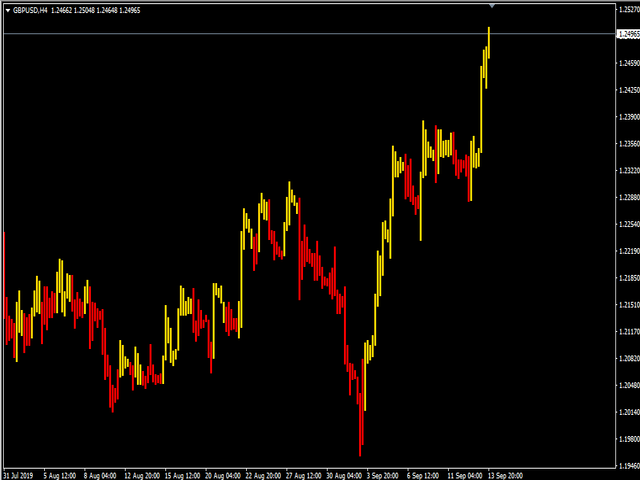
Anatomy of the Indicator
The Royal Ace Signal Bar indicator displays a colored bar. If the price is gold you should be looking for long trades, and if the mean price is red, you should be looking for short trades. Use this indicator in H4 timeframe or higher. You can combine this indicator with 66 EMA.
Strategy To Trade With Royal Ace Signal Bar
* See at Daily Signal : Red candle (sell), Gold Candle (Buy)
* Then go down to the 4h or the 1h timeframe and enter the same direction arrows only
* Take Profit at same range with previous candle from your entry price, example high - low previous candle 50 pips, use it for take profit
* Stop Loss at High or Low 2 previous candle (Look at higher or lower price)
* And you can use 66 EMA for screening the trend.
** Candle above MA and Gold Candle (Buy)
** Candle above MA and Red Candle (Nothing) wait for pullback
** Candle below MA and Red Candle (Sell)
** Candle below MA and Gold Candle (Nothing) wait for retrace
*** For Intraday Trader just buy/sell at 2nd bar in daily timeframe
Before you buy or rent, try demo first. Thank You