Fibo Double in One Trade
- インディケータ
- バージョン: 1.1
- アクティベーション: 5

This indicator is a proof of concept of pyramid trading strategy. It draws fibonacci level automatically from higher high to lower low or from lower low to higher high combinate with Pyramid Trading Strategy for better risk reward ratio.
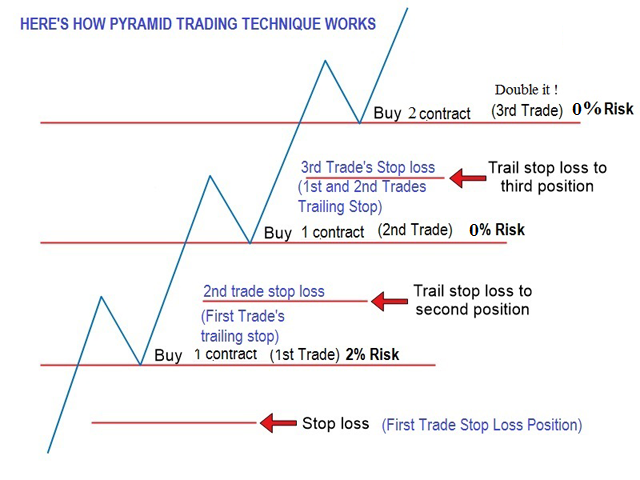
What is Pyramid Trading Strategy?
The pyramid forex trading strategy is a something every forex trader should know about because it makes the difference between making some pips with some risk in only one trade or some pips with less the risk by applying the pyramid trading technique. The basic concept of pyramiding into a position is that you add to the position as the market moves in your favor. Your stop loss moves up or down (depending on trade direction of course) to lock in position as you add lots / contracts. This is how you keep your overall risk while increasing your position size on the trade.
Advantages of Pyramid Trading Strategy:
1. This is one technique where you can increase position in one trade properly.
2. The only risk on the multiple trades you take is the risk on the current trade because all the rest of the trades must have their trailing stops moved to lock in position.
Disadvantages of The Pyramid Trading Strategy:
1. you cannot apply pyramid strategy to every trade as sometimes, your trading system may give only one signal or the trend direction may change.
2. Some forex traders would tend to move their stop losses (increase stop loss distance…thus increasing their risk) when they see price heading the other way to nearly knocking off their stop losses. Don’t do that. The only loss you should suffer is the loss of the most recent trade,all the other trades, when the trailing stop loss gets hit.
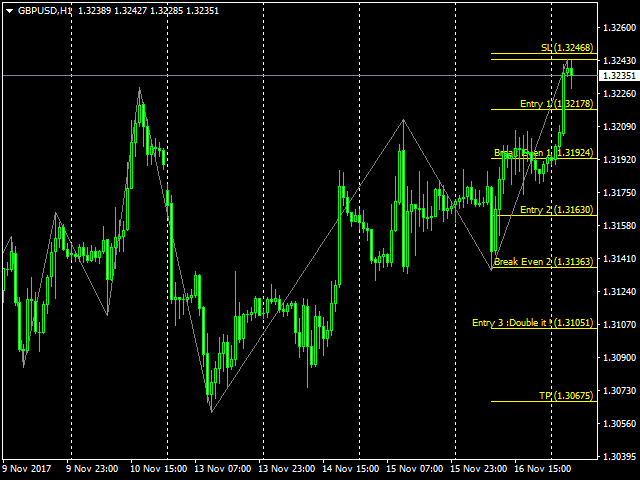
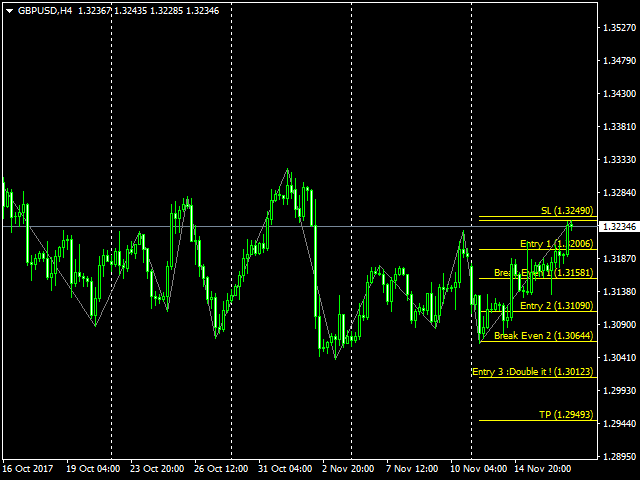
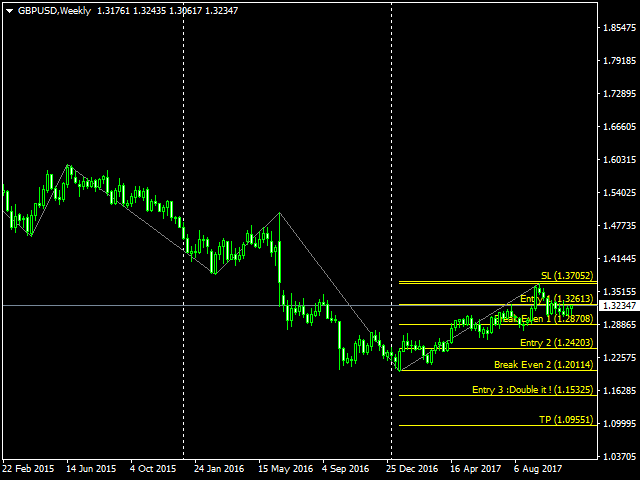
How to trade using Fibo Double in One Trade :
- Entry order (Buy/Sell) at Entry 1 retracement level with a stop-loss order placed at SL (can be adjusted by your spread pips manually).
- Second entry for pyramiding at Entry 2 with the same lot as entry 1, put your stop-loss order at Break Even 1, and move entry 1 stop-loss (trailing) to Break Even 1 level (For now, Entry 1 and Entry 2 has the same Stop-loss at Break Even 1 level).
- Third entry for pyramiding at Entry 3, DOUBLE your lot with break-even risk, put all your stop-loss order at Break Even 2, move entry 1 and entry 2 stop-loss (trailing) to Break Even 2 level (Now all Stop-loss at Break Even 2 level).
- Taking profit Entry 1, Entry 2 and Entry 3 at TP level at once.
- Remember, this is not a HOLY GRAIL system, do not over trade and mind your risk between 2%-4% in every trade, doesn't matter how many you got stop-loss or break-even, it might have 8 consecutive loss with 1 gain for worst case scenarios depends on market structure for that day. We highly suggest you learn about pyramiding strategy for a better understanding of how this indicator works.
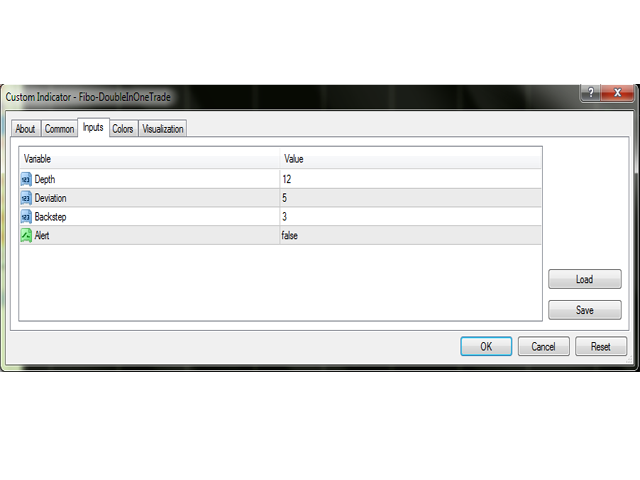
Parameters
- Depth - shift = counted bars - depth (default 12).
- Deviation - the higher/lower price deviation (default 5).
- Backstep - show entry points in history on the chart for visual analysis.
- Alert - enable/disable push alerts when price touches the Fibo area.