BUY or SELL or WAIT
- インディケータ
- バージョン: 1.10
- アップデート済み: 23 3月 2020
- アクティベーション: 5

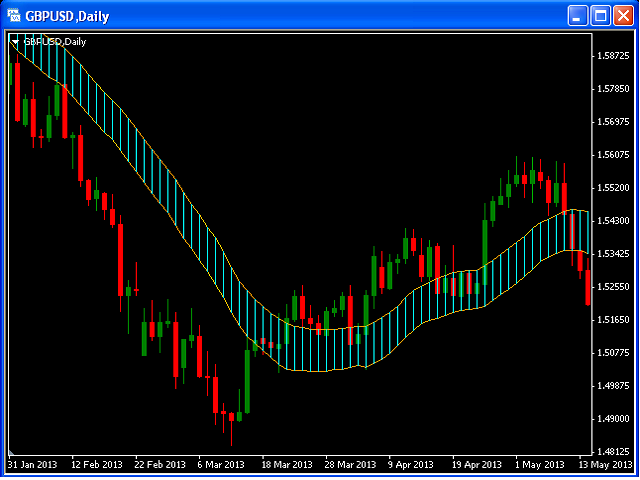
The input parameter counted_bars determines on how many bars the indicator lines will be visible.
The input parameter barsNum is the period for bands calculation.
- When PriceClose for previous bar is above upper band a Long position may be opened.
- When PriceClose for previous bar is under lower band a Short position may be opened.
- If the current Price is between bands it is time to wait.