Rsi Macd Warden

The RSI.MACD Warden is a powerful indicator for MetaTrader 4 that uses a versatile algorithm to identify RSI, MACD, and Stochastic divergences. This indicator is designed to look back at a set number of bars and draw lines when a normal or hidden divergence is identified. The smaller the lookback period, the faster the indicator will be. The indicator can identify both normal and hidden divergences and is more accurate in identifying normal divergences.

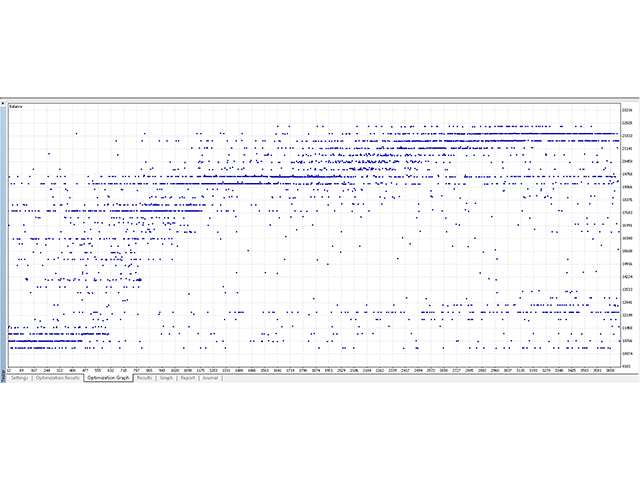
We've conducted a great number of tests to improve the indicator's performance. A trading robot was developed to find the best input settings for each time frame and currency pair. These tests were run on high-capacity computing machines and the results showed stunning performance for the EURUSD M5 time frame for the period of 1 April 2017 - 15 May 2017.

Traders are advised to test the indicator before buying and to conduct individual tests for each time frame of a chosen currency pair. Our indicator is a stand-alone product and can provide trading signals on its own. Get started with the RSI.MACD Warden today and improve your trading strategies!

Key features

  • NORMAL and HIDDEN divergences.
  • High accuracy of signals if a correct set of inputs is applied.
  • Flexible and adaptive to various trading conditions.
  • The indicator doesn’t wait for a confirmation bar to trigger a signal. A trader should make trading decisions for every signal individually.
  • Lines are drawn both on the chart and the indicator windows for a set in inputs number of bars. The indicators on the chart must have the same settings you have in RSI.MACD Warden to draw divergence lines correctly.
  • Turn MACD and Stochastic filters ON/OFF. A signal is triggered when an RSI divergence is confirmed by a respective MACD and/or Stochastic divergence.
  • Inbuilt filters reduce the number of false signals. Tweaking the filters will let you set a specific pattern with high probability of winning trades.
  • Push/Email/Terminal alerts. This option is convenient if your run a VPS and want to receive signals on your mobile 24/5.
  • The indicator works with virtually all trading instruments.
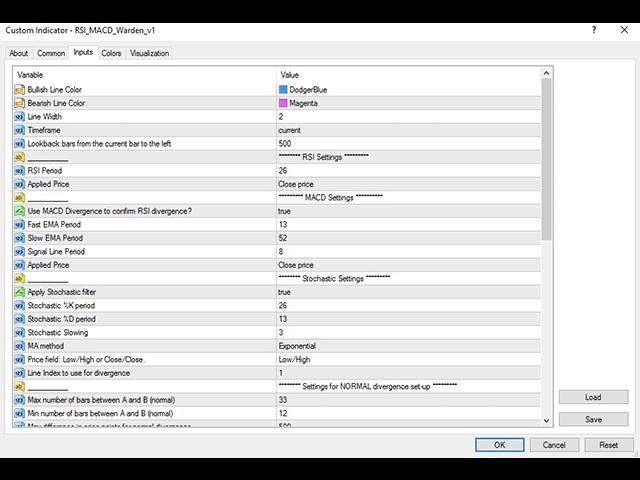

Inputs

Please note that for every time frame and currency pair input settings can be different to achieve higher accuracy of signals.

A good level of knowledge of RSI, MACD and Stochastic indicators is required to tune up the indicator for each time frame and currency pair individually.

  • Lookback bars - number of bars to the left from the current bar to look for divergences
  • RSI - settings
  • MACD - settings
  • Stochastics - settings
  • Settings for filters to tune up the indicator for high accuracy signals.
  • 1 Point = 1/10 of a pip in a pair.

Your feedback is much appreciated to improve the indicator's performance. We are already working on further updates.


Risk warning

**Trading foreign currencies can be a challenging and potentially profitable opportunity for investors. However, before deciding to participate in the Forex market, you should carefully consider your investment objectives, level of experience, and risk appetite. Most importantly, do not invest money you cannot afford to lose. The possibility exists that you could sustain a loss in excess of your initial investment. You should be aware of all the risks associated with foreign exchange trading and seek advice from an independent financial advisor if you have any doubts. Nothing in this product, including but not limited to our other copyrighted software products, is intended to be nor should it be understood by you as being investment advice from or by us.

おすすめのプロダクト
Crypto_Forex MT4用インジケーター「RVIと2本の移動平均線」。リペイント機能なし。 - Relative_Vigor_Index (RVI) 自体は、トレンド相場で非常に有用なテクニカルモメンタムインジケーターです。 - 「RVIと2本の移動平均線」インジケーターを使用すると、RVIオシレーターの高速移動平均線と低速移動平均線を確認できます。   PC and Mobile Alerts. - このインジケーターは、特にD1、H4、H1、M30といった長い時間軸でのモ​​メンタムトレードに最適です。 - このインジケーターはパラメータ設定が非常に簡単で、どの時間軸でも使用できます。 - 買いと売りのエントリー条件は画像で確認できます。 - 買いエントリー条件: (1) 黄色の高速移動平均線が青色の低速移動平均線を上回っている、(2) 赤色のRVIラインが黄色の高速移動平均線を上回っている、(3) 赤色のRVIラインが黄色の高速移動平均線から上方に反発している。 - 売りエントリー条件: (1) 黄色の高速MAが青色の低速MAを下回っている、(2) 赤色のRVIライン
This is a combination of multiple oscillators into a single divergence system that creates the impression of a more reliable divergence indicator. It is multi-currency based and works best on 15 minutes timeframe and above. Every time a signal is generated, it shows an alert to the user. It is more ideal if combined with other price action indicators or trading systems.
The Qv² Trend is an indicator that aims to identify trends. Buying trend signals are indicated by arrows pointing up. Selling trend signals are indicated by arrows pointing down. It can be used in all deadlines. It can be used in all pairs. I use it on the H1 with a period of 24. Important note: I recommend using it in markets that naturally show trends. For in range markets I present my other indicator on this link OBOS  
MACDivergence MTF
Pavel Zamoshnikov
4.29 (7)
Advanced ideas of the popular MACD indicator: It detects and displays classic and reverse divergences (three methods of detecting divergences). It uses different color to highlight an uptrend and a downtrend. Two methods of determining a trend: а) MACD crosses the 0 level (classic signal); б) MACD crosses its own average (early signal). This is a multi-timeframe indicator: it can display MACD data from other timeframes. Two methods of drawing: classic histogram and line. It generates sound and v
The MACD CloseBars indicator is a trading system based on the MACD indicator popular among many traders, which is built on the principle of bars closing above the moving averages selected in the indicator settings. The signal for entering/exiting the market is the frame of the bars colors according to the trend: in case the bars in the main window of the chart are closed above/below the Fast Moving Average, Slow Moving Average individually or both together. Indicator Parameters Fast Moving Aver
MACD Multicurrency Scanner MT4は、移動平均収束拡散(MACD)戦略を使用して複数の通貨ペアを分析するために設計された高度なトレーディングインジケーターです。このツールは、さまざまな時間枠での潜在的な売買シグナルを特定することで、トレーダーが取引パフォーマンスを最適化するのに最適です。 ユーザーフレンドリーなインターフェースを備えたMACD Multicurrency Scanner MT4は、トレーダーが情報に基づいた意思決定を行うことを可能にします。リアルタイムのアラートと視覚的シグナルを提供することで、迅速なforex市場での機会を捉えるのを容易にします。 MQL製品のインストールガイド | MT4/MT5で購入したMQL製品を更新する | 一般的なトラブルシューティングガイド | インジケーター設定 / ガイド 主な特徴 バッファ統合:インジケーターの値をアクセス可能なバッファとして公開し、自動取引戦略のためにExpert Advisorによって読み取れるようにします。 視覚的矢印シグナル:Plotsは、シグナルキャンドル上に直接BUY/SELL矢印
Binary Chronos – MT4用バイナリーオプションインジケーター バッファー信号 :矢印表示でエントリーが簡単、自動売買にも対応。 ️ 満期 :デフォルトは1本のローソク足。 トレンドフォロー :トレンドを分析し、最適なエントリーポイントを検出。 現在の足でエントリー :シグナルは即時エントリー用。 ️ マーチンゲール :初回取引が失敗したら 次の足で1回だけマーチン 。 LevelEn :値が高いほど、シグナルの品質と精度が向上します。 どの時間足でも対応 。 リペイントなし :信頼性の高い安定したシグナル。 アラート機能 :ポップアップとサウンド通知。 Binary Chronos — リスクを抑えたトレンドエントリーが可能なインジケーター!
The Revolution Target Achiever FT -  Auto_Setting 1000 Points  Hi all Investors and traders, We've just updated this EA to a new version 3.0, which has a much more benefits , for Investors who want to run this EA 24 hours using vps can try the Auto_Setting to achieved 1000 Points or 10 %, for traders who have their own set up and target 1-100% can use the manual_setting, THE REVOLUTION Target Achiever is suitable for the investor who want to have a simple and ready to use Expert Advisor (EA). Th
The indicator detects and displays Shark harmonic pattern (see the screenshot). The pattern is plotted by the extreme values of the ZigZag indicator (included in the resources, no need to install). After detecting the pattern, the indicator notifies of that by a pop-up window, a mobile notification and an email. The indicator highlights the process of the pattern formation and not just the complete pattern. In the former case, it is displayed in the contour triangles. After the pattern is comple
RSI TrendLine Divergency Message is an indicator for the MetaTrader 4 trading platform. Unlike the original indicator, this three in one version has a system of alerts that inform on market situation changes. It consists of the following signals: when the Main line crosses the levels of extreme zones and 50% level; when the Main line crosses the Trend line in the indicator window; divergence on the last bar. Parameters of levels of extremum, 50-level and divergence are adjustable. Parameters La
トレンドカッターは、M1 や M5 などの下位時間枠を含むあらゆる時間枠で使用できるトレンド指標です。このインジケーターは日中取引を好むトレーダーにとって理想的であり、長期取引を好むトレーダーにも役立ちます。このインジケーターは、取引システムの基礎として、またはスタンドアロンの取引ソリューションとして使用できます。 このインジケーターは、PUSH 通知を含むあらゆるタイプのアラートを提供します。 インジケーターの使い方はとても簡単です。信号に従えばいいだけです。また、このインジケーターのすべてのユーザーに、このメソッドをできるだけ効率的に使用するのに役立つ追加のインジケーターも無料で提供します。 取引のヒントと素晴らしいボーナスを入手するには、購入後にご連絡ください。
**  All Symbols  x  All Timeframes  scan just by pressing scanner button ** *** Contact me  to send you instruction and add you in "Wolfe Wave Scanner group" for sharing or seeing experiences with other users. Introduction: A Wolfe Wave is created with five-wave patterns in price. It shows supply and demand and a fight towards a balance price. T hese waves of price actions can help traders identify the boundaries of   the trend . Also  It helps forecast how the price will move in the near future
The indicator displays divergence and convergence on all instruments. It works on all timeframes. After finding divergence/convergence, the indicator draws a Buy or a Sell arrow according to the detected signal.  Settings Buy - show buy signals Sell - show sell signals Divergence - show divergence on the chart Convergence - show convergence on the chart KPeriod, DPeriod, Slowing - Stochastic settings drawPriceTrendLines - draw a line (of divergence/covergence) on a price chart drawIndicatorTren
Expert MACD 4K
Wisam Oudah Radhi Al Musawi
It is a flexible and powerful MetaTrader expert advisor that trades with the MACD indicator and implements many useful features. The MACD base indicator is used for MetaTrader. It offers several customizable MACD trading scenarios and flexible position management settings, as well as many useful features such as customizable trading sessions. Trading only on EUR / USD. H4 _________________________________________________________________________________________ EUR / USD.   H4   Easy to use and
The Trend Map indicator is designed to detect trends in price movement and allows you to quickly determine not only the direction of the trend, but also to understand the levels of interaction between buyers and sellers. It has no settings and therefore can be perceived as it signals. It contains only three lines, each of which is designed to unambiguously perceive the present moment. Line # 2 characterizes the global direction of the price movement. If we see that the other two lines are above
Zero Lag Trend Signals MT4 Zero Lag Trend Signals is a smart trend-following indicator that helps you identify market direction faster with minimal lag. Using advanced ZLEMA (Zero Lag EMA) and dynamic volatility bands, it provides clear trend visualization and precise buy/sell signals. Features • Fast trend detection (low lag) • Clear bullish & bearish trend bands • Accurate entry arrows • Built-in multi-timeframe trend panel • Non-repainting signals • Works on Forex, Gold, Crypto, Indices
MACD Trend EA
Lachezar Krastev
4.5 (2)
MACD Trend EA is based on the popular forex indicator MACD (Moving Average Convergence Divergence). It is fully automated trading expert advisor and completely FREE!  As the name suggests, this expert advisor uses a trend-following strategy and uses the MACD indicator to detect the beginning of uptrends and downtrends. MACD Trend EA Top Features - Trend Following Strategy - Money Management - Advanced Exit System + TP and SL  - Trailing Stop System - Broker protection System - Custom Magic Re
FREE
標準パラメーターを使用したMACDインジケーター波に基づく 最後と最後の2つのMACDウェーブで、それぞれ正と負のフィボナッチレベルを扱います。 現時点でMACDインジケーターで負の波が終了している場合、色は緑です。 現時点でMACDインジケーターの正の波が終了している場合、色は赤です。 Waveの終了基準は、MACDの符号が異なる2ティックです。 最後の4つのMACDウェーブのトレンドラインをプロットします。 専門家とうまく働く  その他のスクリーンショット: Figures MACD   https://www.mql5.com/ru/market/product/42031 https://www.mql5.com/en/charts/10581596/audusd-h1-alpari-international https://www.mql5.com/en/charts/10631979/usdjpy-m1-alpari-international https://www.mql5.com/en/charts/10628704/gbpusd-m15-alpa
ADX Pointer is an indicator which is based on "Average Directional Index" and draws three numbers in chart window depending on the value of ADX. In ADX Pointer you can set "ADX_Period" which is of course period of Average Directional Index and you can also set 3 levels. When ADX value exceed first level ("ADX_Level1") in chart window appears number "1", when ADX exceed second level ("ADX_Level2") appears "2" and when ADX exceed third level ("ADX_Level3") appears "3". Simple. ADX Pointer works on
This is a New Single/Multi Timeframes  Indictor based on Moving Average divergence concepts You can use it in differerent modes : Single time frame Mode :(2nd prefered) you input the time frames all the same period - you will get a square wave for Bear /Bull Areas two- time frame Mode :(1st prefered) you input the two time frames you prefer- you will get two  square waves representing the 2 timeframes  - when the two square waves are showing  a Bear area a Red down arrow will appear and the same
This indicator combines double bottom and double top reversal chart patterns together with detection of divergences between the price chart and the MACD oscillator. Features Easily detect strong reversal signals Allows to use double top/bottom and MACD divergence signals combined or independently Get email and/or push notification alerts when a signal is detected Custom colors can be used The indicator is not repainting Can easily be used in an EA (see below) Inputs ENABLE Double Top - Bottom:
Auto Optimized Bollinger Bands – 実際の市場に対応する適応型ボラティリティツール Auto Optimized Bollinger Bandsは、従来のボリンジャーバンドを強化したMT4用の高度なインジケーターで、過去のトレードシミュレーションに基づいて最適な期間と偏差の値を自動で選択します。 固定された設定に依存するのではなく、市場の実際の動きに基づいてリアルタイムで最適化を行い、ボラティリティや価格構造の変化に動的に対応できるバンドを生成します。手動での調整は不要です。 主な機能: 過去のパフォーマンスに基づいたボリンジャーバンドパラメーターの自動最適化 重要な反転ポイントでの矢印による売買シグナルを表示 アラート内蔵:サウンド、ポップアップウィンドウ、プッシュ通知 最適化の深さ、表示方法、シグナルなどのカスタマイズが可能 FX、ゴールド、株価指数、暗号通貨など様々な市場で使用可能 本ツールはデイトレードやスイングトレードに最適で、固定パラメーターの従来型インジケーターよりも、よりスマートなボラティリティ取引アプローチを提供します。
Crypto_Forex MT4用インジケーター「HTF移動平均線クロス」 - 強力なMT4用HTF移動平均線クロスインジケーターで、トレード手法をアップグレードしましょう。HTFとは、より長い時間枠での取引を意味します。 - このインジケーターは、プライスアクションエントリーを行うトレンドトレーダーに最適です。 - より長い時間枠の高速移動平均線と低速移動平均線を現在のチャートに貼り付けることができます。これはプロフェッショナルな手法です。 - HTF移動平均線クロスには、モバイルとPCの両方に対応したアラート機能が組み込まれています。 - このインジケーターは、低リスクで十分な利益を得る機会を提供します。 高品質のトレーディングロボットとインジケーターをご覧になるにはここをクリックしてください! これは、このMQL5ウェブサイトでのみ提供されるオリジナル製品です。
これはMACDに基づくトレンドフォローイングインディケーターで、200MAより上では買いのサイン、200MAより下では売りのサインを提供します。 MACDがゼロラインをクロスすると信号が生成されます。インディケーターはサポートとレジスタンスのレベルも表示し、これはストップロスとして使用できます。調整可能なパラメータにはMA期間、MACDの高速EMA、遅速EMA、サポートレジスタンスの間隔が含まれます。最近のローソク足の最低点と最高点にプロットされます。 デフォルトの設定: SR間隔:10 MA期間:200 Fast EMA:24 Slow EMA:26 アラーム機能も含まれています。 これらの値を変更すると、より頻繁または少ない信号が発生する可能性があり、最も効果的な構成を確定するためにテストすることが推奨されています。 1または4時間の時間枠が推奨されていますが、任意の時間枠で機能することができます。このインディケーターは、Forex、株式、商品などを含むすべての取引インストゥルメントで機能します。 他の製品もこちらでチェックしてください: https://www.mql5.com/
FREE
MACD divergence Simple edition 原始MACD计算方式,升级为双线MACD,使判断更加直观更加贴合大宗交易平台的研究习惯,同时还会自动用实线标出背离,不用再从0开始苦学钻研。 同时,我还提供了提醒服务,在你忙于家务无暇顾及的时候只需要打开音响,一旦达成背离,第一时间就会让你知晓。 这是一款简单版的看背离指标,MACD的九天均线被称为“信号线”,然后绘制在MACD线的顶部,它可以作为买入和卖出信号的触发器。当MACD越过信号线时,交易员可以买入操作,当MACD穿过信号线以下时,交易者可以卖出或做空操作。移动平均收敛-发散(MACD)指标可以用几种方法解释,但更常见的方法是交叉、散度和快速上升/下降。
FREE
This indicator displays entry and exit points in the market. The indicator is based on Parabolic and various mathematical and statistical methods to increase profitability and reduce the number of losing trades. The indicator helps in many cases to skip false inputs, the support and resistance lines go around the price in a certain mode, reducing losses. The dashboard shows the results of the indicator so that you can adjust it more accurately and see how the parameters affect the result. The n
Shock Wave
Camila Bernardez Camero
Shock Wave Signal – リペイントなし、ラグなし、バックペインティングなし Shock Wave Signalは、極端なCCI値を利用して任意のタイムフレームで強力なモメンタム反転を正確に検出します。価格が設定された過熱または売られ過ぎレベルに達した際、ローソク足のクローズ時に明確なエントリーシグナルを生成します。 ロジック 本インジケータは、最大600本の過去ローソク足に対して5期間のコモディティ・チャネル・インデックス(CCI)を計算します。CCIが+165を超えると買いシグナル、–165を下回ると売りシグナルを発生させることで、最も強力な勢いのみをフィルタリングします。 シグナル配置 買いマーカーはシグナル発生ローソク足の高値に、売りマーカーは同ローソク足の安値に配置されます。各矢印はローソク足クローズ時に一度だけ描画され、その後は固定されます。将来のローソク足に依存せず、リペイントやバックペインティングは一切発生しません。 タイムフレーム対応 Shock Wave SignalはM1からMN1まで動作しますが、CCIの極値が明確なトレンド転換と一致しやすいH1お
Vortex MT4
KEENBASE SOFTWARE SOLUTIONS
The Vortex Indicator was first presented by Douglas Siepman and Etienne Botes in January 2010 edition of Technical Analysis of Stocks & Commodities. Despite its based on a complex implosion phenomenon, the vortex is quite simple to interpret. A bullish signal is generated when +VI line cross above the -VI line and vice versa. The indicator is mostly used as a confirmation for trend trading strategies. The Vortex was inspired by the work of Viktor Schauberger, who studied the flow of water in tur
MACD Divergence with arrows complements the MACD indicator. It scans for divergence within the MACD oscillator then draws arrows on the entry points in the chart window. NB:The indicator does not bring up the MACD window nor does it draw lines on the MACD window. The screenshots are a mere description of how they work. The user will become alerted whenever a divergence is in progress and should WAIT for the perfect moment to make an entry. Perfect entries can be anything basic such as support an
MACD Divergence MT4
KEENBASE SOFTWARE SOLUTIONS
KT MACD ダイバージェンスは、価格とオシレーターの間に形成される通常のダイバージェンスと隠れたダイバージェンスを表示します。トレンドの反転を予測する戦略を用いている場合、MACD の通常のダイバージェンスを利用して転換点を特定できます。トレンドの継続に基づく戦略では、MACD の隠れたダイバージェンスが有効です。 KT MACD ダイバージェンスの制限事項 MACD ダイバージェンスを単体のエントリーシグナルとして使うのはリスクがあります。すべてのダイバージェンスが反転を示すとは限りません。より良い結果を得るためには、プライスアクションや他の分析手法と併用することをおすすめします。 主な機能 価格とオシレーターの間の通常および隠れたダイバージェンスを表示します。 非対称なダイバージェンスは精度向上とチャートの見やすさのために除外されます。 トレンド反転戦略およびトレンド継続戦略の両方に対応。 エキスパートアドバイザーへの組み込みに完全対応。 エントリーおよびエグジットの両方で使用可能です。 すべてのMetaTraderアラートに対応。 そもそもダイバージェンスとは? 一般的
このプロダクトを購入した人は以下も購入しています
Gann Made Easy は、ミスター・ギャンの理論を使用した取引の最良の原則に基づいた、プロフェッショナルで使いやすい外国為替取引システムです。 W・D・ガン。このインジケーターは、ストップロスとテイクプロフィットレベルを含む正確な買いと売りのシグナルを提供します。 PUSH通知を利用して外出先でも取引可能です。 ご購入後、取引方法の説明と優れた追加インジケーターを無料で入手するには、私にご連絡ください! おそらく、ギャンの取引手法についてはすでに何度も聞いたことがあるでしょう。通常、ギャンの理論は初心者のトレーダーだけでなく、すでにある程度の取引経験がある人にとっても非常に複雑なものです。なぜなら、ギャンの取引手法は理論的にはそれほど簡単に適用できるものではないからです。私はその知識を磨き、最良の原則を私の外国為替インジケーターに組み込むために数年を費やしました。 このインジケーターは非常に簡単に適用できます。必要なのは、それをチャートに添付し、簡単な取引推奨事項に従うだけです。このインジケーターは常に市場分析の仕事を行い、取引の機会を探します。適切なエントリーポイントを検出す
「 Dynamic Scalper System 」インジケーターは、トレンド波の中でスキャルピング取引を行う手法のために設計されています。 主要通貨ペアと金でテスト済みで、他の取引商品との互換性があります。 トレンドに沿った短期的なポジションオープンのシグナルを提供し、追加の価格変動サポートも提供します。 インジケーターの原理 大きな矢印はトレンドの方向を決定します。 トレンド波の中では、小さな矢印の形でスキャルピングシグナルを生成するアルゴリズムが機能します。 赤い矢印は強気方向、青い矢印は弱気方向です。 トレンドの方向には敏感な価格変動ラインが描かれ、小さな矢印のシグナルと連動します。 シグナルは次のように機能します。適切なタイミングでラインが現れるとエントリーシグナルが形成され、ラインが開いている間はポジションが保持され、完了すると取引が終了します。 推奨される動作時間枠はM1~H4です。 矢印は現在のローソク足に形成され、次のローソク足が開いている場合は、前のローソク足の矢印は再描画されません。 入力パラメータ Trend Wave Period - トレンド方向
M1 SNIPER は使いやすいトレーディングインジケーターシステムです。M1時間足向けに設計された矢印インジケーターです。M1時間足でのスキャルピングのためのスタンドアロンシステムとして、また既存のトレーディングシステムの一部としても使用できます。このトレーディングシステムはM1時間足での取引に特化して設計されていますが、他の時間足でも使用できます。元々、この手法はXAUUSDとBTCUSDの取引用に設計しましたが、他の市場においても役立つと考えています。 インジケーターのシグナルは、トレンドの方向と逆方向に取引できます。インジケーターのシグナルを利用して両方向に取引するのに役立つ特別な取引テクニックをご紹介します。この手法は、特別な動的なサポートとレジスタンスの価格帯を利用することに基づいています。 ご購入後、M1 SNIPER矢印インジケーターをすぐにダウンロードできます。さらに、M1 SNIPERツールのすべてのユーザーに、以下のスクリーンショットに表示されているApollo Dynamic SRインジケーターを無料で提供しています。この2つのインジケーターを組み合わせることで
まず第一に、この取引インジケーターは再描画されず、再描画されず、遅延しないことを強調する価値があります。これにより、手動取引とロボット取引の両方に理想的なものになります。 ユーザーマニュアル:設定、入力、戦略。 アトミックアナリストは、価格の強さとモメンタムを利用して市場でより良いエッジを見つけるためのPA価格アクションインジケーターです。ノイズや誤ったシグナルを除去し、取引ポテンシャルを高めるための高度なフィルターを備えています。複雑なインジケーターの複数のレイヤーを使用して、アトミックアナリストはチャートをスキャンし、複雑な数学的計算をシンプルなシグナルと色に変換します。これにより、どのような初心者トレーダーでも理解して使用し、一貫した取引の決定を行うことができます。 「アトミックアナリスト」は、新規および経験豊富なトレーダー向けにカスタマイズされた包括的な取引ソリューションです。プレミアムインジケーターとトップノッチの機能を1つの取引戦略に組み合わせ、すべてのタイプのトレーダーにとって汎用性のある選択肢にします。 デイリートレーディングとスキャルピング戦略:高速で正確な
An exclusive indicator that utilizes an innovative algorithm to swiftly and accurately determine the market trend. The indicator automatically calculates opening, closing, and profit levels, providing detailed trading statistics. With these features, you can choose the most appropriate trading instrument for the current market conditions. Additionally, you can easily integrate your own arrow indicators into Scalper Inside Pro to quickly evaluate their statistics and profitability. Scalper Inside
トレンドラインプロ   市場の真の方向転換点を理解するのに役立ちます。この指標は、真のトレンド反転と主要プレーヤーが再び参入するポイントを示します。 分かりますか     BOSライン   複雑な設定や不要なノイズなしに、より長い時間足でのトレンドの変化と重要なレベルを把握できます。シグナルは再描画されず、バーが閉じた後もチャート上に残ります。 VERSION MT 5     -     RFI LEVELS PRO インジケーター と組み合わせることで、その潜在能力を最大限に発揮します。 インジケーターが示す内容: 本当の変化   トレンド(BOSライン) 一度シグナルが現れたら、それは有効です!これは、リペイント機能を持つインジケーターとの重要な違いです。リペイント機能を持つインジケーターは、シグナルを発した後、それを変更し、資金の損失につながる可能性があります。これにより、より高い確率と精度で市場に参入できます。また、矢印が現れた後、目標値(利益確定)に達するか、反転シグナルが現れるまで、ローソク足の色を変更する機能もあります。 繰り返しエントリ       主要プレーヤーの
Volatility Trend System - a trading system that gives signals for entries. The volatility system gives linear and point signals in the direction of the trend, as well as signals to exit it, without redrawing and delays. The trend indicator monitors the direction of the medium-term trend, shows the direction and its change. The signal indicator is based on changes in volatility and shows market entries. The indicator is equipped with several types of alerts. Can be applied to various trading ins
まず第一に、この取引ツールはノンリペイント、ノンリドロー、ノンラグの指標であり、プロの取引に理想的ですことを強調する価値があります。 オンラインコース、ユーザーマニュアル、デモ。 スマートプライスアクションコンセプトインジケーターは、新米から経験豊富なトレーダーまで、非常 に強力なツールです。Inner Circle Trader AnalysisやSmart Money Concepts Trading Strategiesなど、20以上の有用な指標を1つに組み合わせています。このインジケーターはスマートマネーコンセプトに焦点を当て、大手機関の取引方法を提供し、彼らの動きを予測するのに役立ちます。 特に、流動性分析に優れており、機関がどのように取引しているかを理解しやすくしています。市場のトレンドを予測し、価格の動きを慎重に分析するのに優れています。機関の戦略とトレードを合わせることで、市場の動向についてより正確な予測ができます。このインジケーターは多目的であり、市場構造を分析し、重要な注文ブロックを特定し、さまざまなパターンを認識するのに優れています。 このインジケーターは
チャートを構成し、周期的な価格変動を識別するテクニカル指標。 どのチャートでも動作します。 いくつかの種類の通知。 グラフ自体に追加の矢印があります。 履歴を再描画せずに、キャンドルのクローズに取り組みます。 M5以上のTFを推奨します。 パラメータの使用と設定が簡単です。 異なるパラメータを持つ 2 つのインジケーターを使用する場合、他のインジケーターなしで使用できます。 入力パラメータは2つあります 周期性と信号持続時間 これら 2 つのパラメータは、チャート構造の処理を扱います。 Cyclicity - 反転サイクルが変化する頻度を調整し、サイクルを滑らかにします。 Signal duration - 最小数では価格変動の衝動を検出し、最大数では長期的なトレンドの動きを検出します。
Auto Optimized Parabolic RSI: 高度な3Dモメンタムエンジン ほとんどのリテール向けインジケーターは、市場のボラティリティが変化した瞬間に破綻する静的な入力値に依存しているため、失敗に終わります。Auto Optimized Parabolic RSIは、自らの数学的優位性を継続的に再計算することで「インジケーターの陳腐化」問題を解決し、機関投資家レベルの定量的適応力をMT5ターミナルに直接もたらします。 最大の強み: カスタムインメモリ3D最適化   標準的な自動最適化ツールは、インジケーターの呼び出しで端末に過負荷をかけるため、頻繁にMT5プラットフォームをフリーズさせます。本ツールは、このボトルネックを完全に回避しています。RAMベースのカスタムネイティブ計算機を内蔵した内部エンジンは、チャートを読み込んだりタイムフレームを変更したりするたびに、超高速の3Dグリッド探索を実行します。RSI期間(頻度)、SARステップ(加速度)、SAR最大値(制限速度)を同時にスイープし、プラットフォームを遅延させることなく、数万通りものパラメーターの組み合わせを絶対的
このインジケーターは、反転ポイントと価格戻りゾーンを正確に表示します。     主要プレーヤー 。新たなトレンドが形成される場所を把握し、最大限の精度で意思決定を行い、すべての取引をコントロールします。 TREND LINES PRO インジケーターと組み合わせることで、その潜在能力を最大限に発揮します。 VERSION MT5 インジケーターが示す内容: 新しいトレンドの始まりに活性化する反転構造と反転レベル。 リスクと報酬の比率を最小限に抑えた利益 確定 と 損失停止の レベルの表示     RR 1:2   。 インテリジェントな削減ロジックによるストップロス。 指定されたインジケーターから 2 つのトレンド タイプの反転パターンを表示します。 指標: トレンドを追う   TREND LINES PRO   (世界的なトレンドの変化) TREND PRO   (クイックトレンド変更) シンプルで効果的   スキャナー   リアルタイムトレンド(新機能)。 マルチタイムフレームのインストゥルメント フィルタリング。 画面   利益     LOGIC AI信号の後。 当日プラス方
Trend indicator AI
Ramil Minniakhmetov
4.49 (84)
Trend Ai indicatorは、トレンドの識別と実用的なエントリポイントと反転アラートを組み合わせることで、トレーダーの市場分析を強化する優れたツールです。 この指標は、ユーザーが自信と正確さで外国為替市場の複雑さをナビゲートすることを可能にします トレンドAiインジケーターは、主要なシグナル以外にも、プルバックやリトレースメント中に発生するセカンダリエントリポイントを識別し、トレーダーが確立されたトレンド内の価格修正を活用できるようにします。 重要な利点: *MT4およびMT5の仕事 *明確な買いまたは売りシグナル *再描画しません ·すべての資産で動作します 私はeaやセットをtelegram it詐欺で販売しないように注意してください。 すべての設定はここでブログで無料です。  重要! 指示とボーナスを得るために購入後すぐに私に連絡してください! 私の他のプロダクトと同様、実質操作の監視はここに見つけることができます: https://www.mql5.com/en/users/mechanic/seller&nbsp ; 設定および入力: すべての
このインジケーターを購入すると、プロ仕様のトレードマネージャーを無料で差し上げます。 まず第一に、このトレーディングシステムがノンリペイント、ノンリドロー、ノンラグのインジケーターであることを強調する価値がある。これにより、手動取引とロボット取引の両方に理想的なものになっています。 オンラインコース、マニュアル、プリセットのダウンロード。 「スマートトレンドトレーディングシステム MT5」は、新規および経験豊富なトレーダー向けにカスタマイズされた包括的なトレーディングソリューションです。10以上のプレミアムインジケーターを組み合わせ、7つ以上の堅実なトレーディング戦略を備えており、多様な市場状況に対応する多目的な選択肢となっています。 トレンドフォロー戦略:トレンドを効果的に乗り越えるための正確なエントリーとストップロス管理を提供します。 リバーサル戦略:潜在的なトレンドの反転を特定し、トレーダーがレンジ相場を活用できるようにします。 スキャルピング戦略:高速で正確なデイトレードおよび短期取引のために設計されています。 安定性:すべてのインジケーターはノンリペイント、ノンリドロー、ノ
MTF Supply Demand Zones
Georgios Kalomoiropoulos
4.82 (22)
次世代の自動化された需要と供給のゾーン。どのチャートでも機能する新しい革新的なアルゴリズム。すべてのゾーンは、市場の価格行動に従って動的に作成されています。 2種類のアラート --> 1) 価格がゾーンに達したとき 2) 新しいゾーンが形成されたとき もう 1 つの役に立たない指標はありません。実績のある完全な取引戦略を手に入れることができます。     新機能:     価格が需給ゾーンに達したときにアラートを出す     新しい需給ゾーンが作成されたときにアラートを発します     プッシュ通知アラート     ピップ単位のゾーン幅ラベル     MTF のもう 1 つのタイムフレーム。したがって、現在より 2 時間足高いのではなく、現在より 3 時間足し上に見えるようになります。     アラート/ゾーン/MTF 機能を有効/無効にするボタン あなたが得る利点:     取引から感情を取り除きます。     取引エントリをオブジェクト化します。     確率の高いセットアップで利益を上げましょう。     描画ゾーンから時間を節約します。
現在20%OFF! 初心者やエキスパートトレーダーに最適なソリューションです。 このインディケータは、エキゾチックペア・コモディティ・インデックス・先物など、あらゆるシンボルの通貨の強さを表示することに特化したインディケータです。金、銀、原油、DAX、US30、MXN、TRY、CNHなどの通貨の強さを表示するために、9行目にどのシンボルでも追加することができます。独自の機能を多数搭載し、新しい計算式を採用したため、ユニークで高品質、かつ手頃な価格のトレーディングツールとなっています。新しいトレンドやスキャルピングチャンスのトリガーポイントを正確に把握することができるため、あなたのトレードがどのように改善されるか想像してみてください。 ユーザーマニュアル:ここをクリック   https://www.mql5.com/en/blogs/post/708876 すべての時間枠に対応します。あなたはすぐにトレンドを見ることができるようになります! 新しいアルゴリズムに基づいて設計されているため、潜在的な取引の特定と確認がより簡単になります。これは、8つの主要通貨と1つのシンボルの強弱
The Super Arrow Indicator provides non-repainting buy and sell signals with exceptional accuracy. Key Features No repainting – confirmed signals remain fixed Clear visual arrows: green for buy, red for sell Real-time alerts via pop-up, sound, and optional email Clean chart view with no unnecessary clutter Works on all markets: Forex, gold, oil, indices, crypto Adjustable Parameters TimeFrame Default: "current time frame" Function: Sets the time frame for indicator calculation Options: Can be set
通貨強さウィザードは、取引を成功させるためのオールインワン ソリューションを提供する非常に強力な指標です。このインジケーターは、複数の時間枠のすべての通貨のデータを使用して、このまたはその外国為替ペアのパワーを計算します。このデータは、使いやすい通貨インデックスと通貨パワーラインの形式で表され、特定の通貨のパワーを確認するために使用できます。 必要なのは、取引したいチャートにインジケーターを接続することだけです。インジケーターは、取引する通貨の実際の強さを示します。このインジケーターは、トレンドに合わせて取引するときに有利に利用できる売買高の圧力の極値も示します。このインジケーターには、フィボナッチに基づく可能なターゲットも表示されます。 このインジケーターは、PUSH 通知を含むあらゆるタイプのアラートを提供します。 購入後ご連絡下さい。私の取引のヒントをあなたと共有し、素晴らしいボーナスインジケーターを無料で提供します! 幸せで有益な取引をお祈りします。
Dynamic Forex28 Navigator - 次世代の Forex 取引ツール。 現在 49% オフ。 Dynamic Forex28 Navigator は、長年人気のインジケーターを進化させたもので、3 つの機能を 1 つにまとめています。 Advanced Currency Strength28 インジケーター (レビュー 695 件)  + Advanced Currency IMPULSE with ALERT (レビュー 520 件) + CS28 コンボ シグナル (ボーナス)。 インジケーターの詳細 https://www.mql5.com/en/blogs/post/758844 次世代の Strength インジケーターが提供するもの  オリジナルで気に入っていたすべての機能が、新機能と精度の向上によって強化されました。 主な機能: 独自の通貨強度計算式。 すべての時間枠でスムーズかつ正確な強度ライン。 トレンドの特定と正確なエントリーに最適です。 ダイナミックマーケットフィボナッチレベル (マーケットフィボナッチ)。 このインジケーターに固有
Advanced Supply Demand
Bernhard Schweigert
4.91 (299)
現在40%オフ 初心者にもエキスパートトレーダーにも最適なソリューション このインジケーターは独自の機能と新しい公式を多数内蔵しており、ユニークで高品質かつ手頃な取引ツールです。このアップデートでは、2つの時間枠ゾーンを表示できるようになります。より長いTFだけでなく、チャートTFとより長いTF(ネストゾーンを表示)の両方を表示できます。すべてのSupply Demandトレーダーの皆さんのお気に召すはずです。:) 重要情報の公開 Advanced Supply Demandの可能性を最大化するには、 https://www.mql5.com/ja/blogs/post/720245 にアクセスしてください。   エントリーまたはターゲットの正確なトリガーポイントを正確に特定できれば取引がどのように改善されるか想像してみてください。新しい基盤となるアルゴリズムに基づいて構築されているため、買い手と売り手の間の潜在的な不均衡をさらに簡単に特定できます。これは、最も強い需要と供給のゾーンと、過去のパフォーマンス(古いゾーンを表示)がグラフィカルに表現されるためです。これらの機能は、最適な
Adaptive Volatility Range [AVR] is a powerful tool for identifying key trend reversal points. AVR accurately reflects the Average True Range (ATR) of volatility, taking into account the Volume-Weighted Average Price (VWAP). The indicator adapts to any market volatility by calculating the average volatility over a specific period, ensuring a stable rate of profitable trades. You receive not just an indicator but a professional automated trading system , AVR-EA . Advantages: Automated Trading Sys
説明書(ロシア語)  /  説明書 (英語)  /  バージョン MT5 主な機能: 売り手と買い手のアクティブなゾーンを表示します。 このインジケーターは、買いと売りの適切な最初のインパルスレベル/ゾーンをすべて表示します。これらのレベル/ゾーンがアクティブになると、エントリーポイントの探索が始まり、レベルの色が変わり、特定の色で塗りつぶされます。状況をより直感的に把握できるように、矢印も表示されます。 LOGIC AI - テンプレートをアクティブ化するときにエントリポイントを検索するためのゾーン(円)の表示 視認性を向上させるため、人工知能を用いて進入ポイントを探索したゾーンを表示する機能が追加されました。 より高い時間枠からのレベル/ゾーンの表示(MTFモード) より長い時間間隔でレベル/ゾーンを表示する機能を追加しました。また、インジケーターに自動トレンド検出機能(   TPSproTREND PRO   )を実装しました。 取引のための個別の専門的なステップバイステップのアルゴリズム このアルゴリズムは、トレンドの方向と逆方向の両方でデイトレードを行うために設計されていま
ブレーカートレーダーになり、価格が反転すると市場構造からの利益が変化します。 注文ブロックブレーカーインジケーターは、トレンドまたは価格の動きが枯渇に近づいており、逆転の準備ができていることを識別します。通常、反転または大規模なプルバックが発生しようとしているときに発生する市場構造の変化について警告します。 この指標は、ブレイクアウトと価格の勢いを識別する独自の計算を使用します。使い果たされる可能性のあるポイントの近くで新しい高値が形成されるたびに、インディケーターはその高値の作成を担当する最後の注文ブロックを描きます。次に、移動する価格とともに注文ブロックを追跡します。その後、価格が反対方向にシフトし、その注文ブロックを突破すると、新しい市場構造を作成し、トレンドまたは大きな後退の可能性のある反転の開始を警告します。 注文ブロックは、高値/安値が作成される前の最後の反対色のろうそくであり、価格がこれらの重要な領域を下抜けすると、トレンドの短期的ま​​たは長期的な反転の兆候です。 特徴 重要な枯渇点での市場構造の変化を警告します 価格が使い果たされるレベルに近づくと、自動的に
BTMM State Engine Pro is a MetaTrader 4 indicator for traders who use the Beat The Market Maker approach: Asian session context, kill zone timing, level progression, peak formation detection, and a multi-pair scanner from a single chart. It combines cycle state logic with a built-in scanner dashboard so you do not need the same tool on many charts at once. What it does Draws the Asian session range; session times can follow broker server offset or be set in inputs. Tracks level progression (L
TrendLine PRO MT4
Evgenii Aksenov
4.83 (167)
The Trend Line PRO indicator is an independent trading strategy. It shows the trend change, the entry point to the transaction, as well as automatically calculates three levels of Take Profit and Stop Loss protection. Trend Line PRO is perfect for all Meta Trader symbols: currencies, metals, cryptocurrencies, stocks and indices. The indicator is used in trading on real accounts, which confirms the reliability of the strategy. Robots using   Trend Line PRO   and real Signals can be found here:   
Looking for a powerful yet lightweight swing detector that accurately identifies market structure turning points? Want clear, reliable buy and sell signals that work across any timeframe and any instrument? Buy Sell Arrow MT Swing is built exactly for that — precision swing detection made simple and effective. This indicator identifies Higher Highs (HH) , Higher Lows (HL) , Lower Highs (LH) , and Lower Lows (LL) with remarkable clarity. It is designed to help traders easily visualize market stru
Advanced version of CyberZingFx Volume Plus, the ultimate MT4 indicator for traders seeking highly accurate buy and sell signals. With an additional strategy and price action dot signals that enhances its effectiveness, this indicator offers a superior trading experience for professionals and beginners alike. The CyberZingFx Volume Plus Advanced version combines the power of volume analysis and historical price data with an additional strategy, resulting in even more precise and reliable signals
Matrix Arrow Indicator MT4
Juvenille Emperor Limited
5 (3)
マトリックスアローインジケーターMT4は、すべてのシンボル/商品(外国為替、商品、暗号通貨、インデックス、株式)で使用できる100%再描画されていないマルチタイムフレームインジケーターに続くユニークな10in1トレンドです。マトリックスアローインジケーターMT4は、初期段階で現在のトレンドを判断し、最大10の標準インジケーターから情報とデータを収集します。 平均方向移動指数(ADX) 商品チャネルインデックス(CCI) クラシック平研アシキャンドル 移動平均 移動平均収束発散(MACD) 相対活力指数(RVI) 相対力指数(RSI) 放物線SAR ストキャスティクス ウィリアムズのパーセント範囲 すべてのインジケーターが有効な買いまたは売りシグナルを与えると、対応する矢印がチャートに印刷され、次のろうそく/バーの開始時に強い上昇トレンド/下降トレンドを示します。ユーザーは、使用するインジケーターを選択し、各インジケーターのパラメーターを個別に調整できます。マトリックスアローインジケーターMT4は選択されたインディケーターからのみ情報を収集し、それらのデータのみに基づいてアローを印刷
サポートとレジスタンススクリーナーは、1つのインジケーター内に複数のツールを提供するMetaTraderの1つのレベルインジケーターにあります。 利用可能なツールは次のとおりです。 1.市場構造スクリーナー。 2.強気のプルバックゾーン。 3.弱気プルバックゾーン。 4.デイリーピボットポイント 5.毎週のピボットポイント 6.毎月のピボットポイント 7.ハーモニックパターンとボリュームに基づく強力なサポートとレジスタンス。 8.銀行レベルのゾーン。 期間限定オファー:HVサポートおよびレジスタンスインジケーターは、50ドルと生涯でのみご利用いただけます。 (元の価格125 $) Metatrader Backtesterの制限なしでインジケーターを試してみませんか? デモ版をダウンロードするには、ここをクリックしてください。 主な機能     ハーモニックおよびボリュームアルゴリズムに基づく強力なサポートおよびレジスタンスゾーン。     ハーモニックおよびボリュームアルゴリズムに基づく強気および弱気のプルバックゾーン。     市場構造スクリーナー     毎日、毎週、毎月の
Scalping Entry Points - is a manual trading system that can adjust to price movements and give signals to open trades without redrawing. The indicator determines the direction of the trend by the central level of support and resistance. The dot indicator provides signals for entries and exits.  Suitable for manual intraday trading, scalping and binary options. Works on all time frames and trading instruments. The indicator gives several types of alerts. How to use the product The blue line det
現在40%OFF! 初心者やエキスパートトレーダーのためのベストソリューション! このダッシュボードソフトウェアは、28の通貨ペアで動作しています。それは私達の主要な指標(高度な通貨の強さ28と高度な通貨インパルス)の2に基づいています。それは全体の外国為替市場の大きい概観を与えます。それは、すべての(9)時間枠で28の外国為替ペアのための高度な通貨の強さの値、通貨の動きの速度と信号を示しています。チャート上で1つのインディケータを使用して市場全体を観察し、トレンドやスキャルピングの機会をピンポイントで見つけることができたら、あなたのトレードがどのように改善されるか想像してみてください。 このインディケータには、強い通貨と弱い通貨の識別、潜在的な取引の識別と確認がより簡単になるような機能が搭載されています。このインディケータは、通貨の強さや弱さが増加しているか減少しているか、また、すべての時間枠でどのように機能しているかをグラフィカルに表示します。 新機能として、現在の市場環境の変化に適応するダイナミックなマーケットフィボナッチレベルが追加され、すでに当社のAdvanced
フィルタ:
レビューなし
レビューに返信