Neuron Echo
- インディケータ
- バージョン: 1.0
- アクティベーション: 5

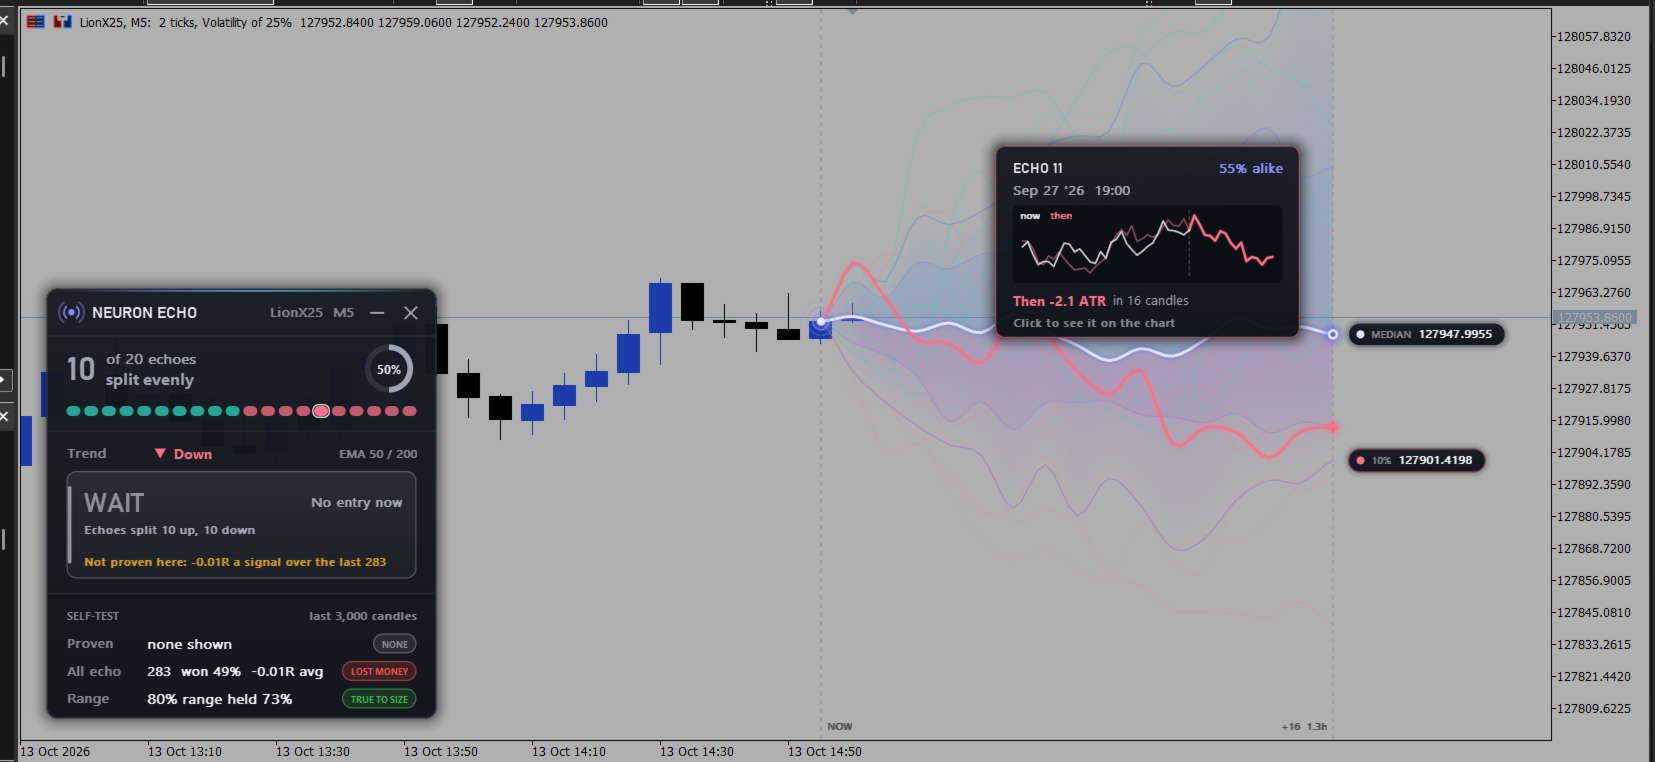
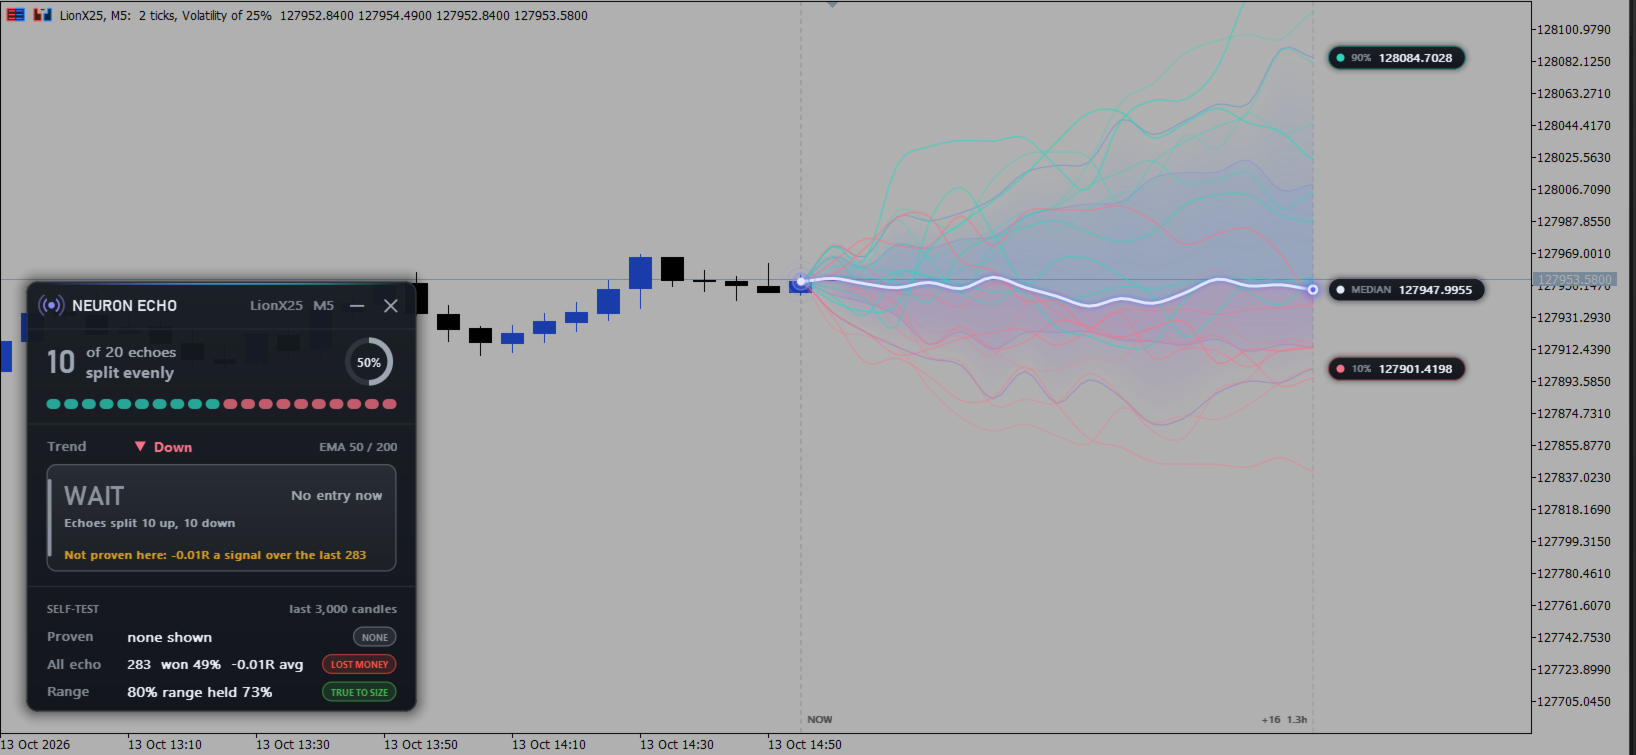
NeuronEcho is a pattern-memory indicator for MetaTrader 5 from Neuron Systems. It searches the chart's own history for the 20 moments that looked most like the market right now, and draws what price did next as ghost paths ahead of the last candle, with a range cloud, a median path and the 90% / median / 10% price levels. You see the whole spread of outcomes: where most of them went, how far they travelled, and how far the worst ones went against.
It is an indicator for chart analysis only: it draws on the chart, it does not place, modify or close trades, it does not send orders, and it does not manage positions or accounts.
Native MQL5, no DLLs, non-repainting closed-bar logic. Works on any symbol (forex, gold and metals, indices, crypto) and any timeframe.
=== HOW IT WORKS ===
On every closed candle, the last 32 candles are turned into a shape measured in ATR, so the same logic works on any symbol and at any price level. That shape is compared with every earlier moment of the chart, together with the time of day and the volatility regime at the time. The 20 closest moments that do not overlap each other become the echoes.
What each echo did over the next 16 candles is scaled to today's ATR and drawn ahead of the last candle. Where the echoes spread is the range cloud; their middle is the median path. A card shows how many echoes went up or down, the trend (EMA 50 / 200), and a BUY / SELL / WAIT box with entry, stop and target.
Every closed candle gets one answer, worked out only from what was known at its close, and that answer never changes. Signals stay exactly where they appeared, and nothing is calculated on the candle that is still forming. Answers are saved, so they are the same after a restart.
NeuronEcho then grades itself on the history of the chart it is on. A BUY or SELL is shown only when the echo signals before it, on that chart, made money with real statistical backing: at least 30 trades, a positive average after spread, and a t-value of 2 or more. Where that is not the case, the box shows WAIT and the actual track record instead.
=== WHAT IS INCLUDED ===
| Module | What it does |
|---|---|
| Ghost paths | Each echo's next 16 candles drawn ahead of the last candle on a true-alpha canvas. Teal paths went up, rose paths went down; the closest matches are drawn the strongest. |
| Range cloud | Where the echoes spread out, densest in the middle and fading toward the 10% and 90% paths, with price tags for the 90%, median and 10% levels at the end. |
| Median path | The middle of all echoes, drawn as a glowing line with its end level marked. |
| Then vs now | Hover a ghost path to see when that moment was, how similar it was, and a small chart of "then" laid over "now". Click it to jump to that moment in the history, framed on the chart. |
| Trend and signal card | The trend (EMA 50 / 200), how many echoes agree, and a BUY / SELL / WAIT box with entry, stop and target. The card can be dragged, minimised or closed. |
| Self-test | Grades the range cloud and every echo signal on the chart's own history, with the spread paid, and shows the result on the card. |
| Proven-only signals | A signal is shown only where the echo signals before it proved themselves on that chart; otherwise the box shows WAIT and the track record. |
| Past signals on the chart | Every shown signal stays on the chart with its arrow, a dotted path to its exit and its result in R. |
| Alerts | Pop-up and MT5 mobile push on a new BUY or SELL signal. |
=== HOW TO READ IT ===
- The cloud is the realistic range. Most of the echoes ended inside it. Use its edges to judge how far price usually travels from here and to place stops and targets.
- The paths show the disagreement. When the ghost paths point every way, the history has no clear opinion; when most of them agree, the card's count says so.
- Check the self-test first. The card shows how often the 80% range really held on this chart, and how the echo signals did after spread.
- WAIT is an answer too. When the signals have not proved themselves on the chart, NeuronEcho shows WAIT and the track record instead of a guess.
- The levels are study levels. The entry, stop and target frame a move in R; they are not instructions.
=== WHAT TO EXPECT ===
During development the echoes were tested on gold, GBPUSD, US30, Bitcoin and synthetic indices. The direction of the echoes on its own was close to a coin flip on all of them. The range cloud held up well: the 80% range contained the real outcome about three times out of four. NeuronEcho is at its best for seeing the realistic range of the next candles and for placing stops and targets. That is also why signals are proven-only by default, and why on many charts you will see few or no signals.
=== SUGGESTED SETTINGS (starting points) ===
These are starting points to match your style and the market you trade; they are configuration preferences, not performance recommendations. Adjust and test on your own charts.
| If you want... | Try |
|---|---|
| The balanced setup | Defaults: pattern 32, look ahead 16, 20 echoes, lookback 20,000 candles. |
| A shorter-term read | Pattern 16 and look ahead 8. |
| A longer-term read | Pattern 64 and look ahead 32, on a chart with plenty of history. |
| Faster first load | Lower the lookback toward 10,000 and the self-test and proof spans toward 2,000. |
| Every echo signal, for study | Turn "Only show signals proven on this chart" off. |
| A cleaner chart | Turn the echo marks off, keep the paths and the cloud. |
| Daily and weekly charts | The time-of-day match switches itself off on H4 and above. |
=== SPECIFICATIONS ===
| Type | Indicator (chart analysis only) |
| Platform | MetaTrader 5 |
| Markets | Forex, gold and metals, indices, crypto |
| Timeframes | All |
| Engine | Native MQL5, no DLLs, non-repainting closed-bar logic |
| Matching | 32-candle shape in ATR units, time of day and volatility regime |
| Drawing | Ghost paths, range cloud, median path and price tags on a true-alpha canvas |
| Self-test | Range coverage and every echo signal, graded with the spread paid |
| Signals | Proven-only by default, with entry, stop and target |
| Alerts | Pop-up and MT5 mobile push on a new signal |
=== INPUTS ===
| Group | Input | Default | Purpose |
|---|---|---|---|
| Echo | Pattern: candles compared | 32 | How many recent candles make up the shape that is matched |
| Echo | Look ahead: candles | 16 | How far ahead the ghost paths and the cloud run |
| Echo | Echoes: closest past moments drawn | 20 | Number of past moments used |
| Echo | Lookback: candles each moment is compared with | 20000 | How much history is searched for each candle |
| Echo | Match the time of day | true | Prefer past moments at a similar hour (charts under H4) |
| Echo | Match how volatile the market was | true | Prefer past moments with a similar volatility regime |
| Self-test | Show the self-test on the card | true | Show or hide the self-test rows |
| Self-test | Self-test: last candles graded | 3000 | How many recent candles the self-test covers |
| Self-test | A lean: at least this % of echoes agree | 65 | Share of echoes that must agree before a direction counts |
| Look | Ghost paths / Range cloud / Mark the echoes in the history | true | Show or hide each layer |
| Look | Card corner, distance from the side, distance from the top / bottom | Left upper, 14, 34 | Where the card starts; it can also be dragged |
| Look | Size, % | 100 | Card and label size |
| Look | Echoes that went up / down, Range cloud and median | Teal, rose, indigo | Colours |
| Signals | Only show signals proven on this chart | true | Show a BUY or SELL only where the echo signals proved themselves |
| Signals | Proof: candles of track record checked before each signal | 3000 | How far back the proof looks |
| Signals | Signals only with the trend (EMA 50 / 200) | true | Require the trend to agree with the echoes |
| Signals | Target, as a multiple of the stop | 1.5 | Distance of the target in R |
| Signals | Show how past signals ended | true | Arrows, exit paths and results of past signals |
| Alerts | Alert on a new BUY or SELL signal | false | Pop-up alert |
| Alerts | Also send it to the MT5 mobile app | false | Push notification |
=== COMPATIBILITY ===
- MetaTrader 5.
- Any symbol: forex, gold and metals, indices, crypto.
- Any timeframe. It needs a few thousand candles of history; more is better.
- Native MQL5, no DLLs and no external dependencies.
- Non-repainting closed-bar logic: every candle gets one answer at its close and it does not change after the fact.
- The first load works out the past candles in the background with a progress bar; after that, answers are saved and later loads are almost instant.
=== PAIRS WITH THE NEURON SUITE ===
NeuronEcho gives you the realistic range of the next candles, taken from the chart's own history. It fits alongside the rest of the Neuron suite (each sold separately): NeuronCloud, NeuronBreakout, NeuronScanner, NeuronTrend, NeuronStructure, NeuronLiquidity, NeuronSessions and NeuronFlow.
=== SUPPORT ===
Customisation requests and questions are welcome through the Comments section on this product page.
NOTE: NeuronEcho is an indicator for chart analysis only. It draws on the chart, it does not place, modify or close trades, it does not send orders, and it does not manage positions or accounts. The echoes, the range cloud and the self-test describe how this market behaved in the past; they are not a forecast or a profitable system. All trading decisions and execution remain entirely your responsibility.