Evgeniy Zhdan
Evgeniy Zhdan
  • 情報
13+ 年
経験
186
製品
271
デモバージョン
1
ジョブ
0
シグナル
0
購読者
➖➖➖➖➖➖➖➖➖➖➖➖➖➖➖➖➖➖➖➖➖➖

Products: https://www.mql5.com/en/users/trendhunter/seller

➖➖➖➖➖➖➖➖➖➖➖➖➖➖➖➖➖➖➖➖➖➖

📢 TELEGRAM CHANELL: https://t.me/algotrdr

➖➖➖➖➖➖➖➖➖➖➖➖➖➖➖➖➖➖➖➖➖➖

💬 Channel: https://www.mql5.com/ru/channels/algotrader

➖➖➖➖➖➖➖➖➖➖➖➖➖➖➖➖➖➖➖➖➖➖

https://fundrates.net — real-time crypto funding screener. Track negative funding, spot early trend shifts, and catch reversals before they happen. Be one step ahead.

➖➖➖➖➖➖➖➖➖➖➖➖➖➖➖➖➖➖➖➖➖➖
Evgeniy Zhdan
Evgeniy Zhdan
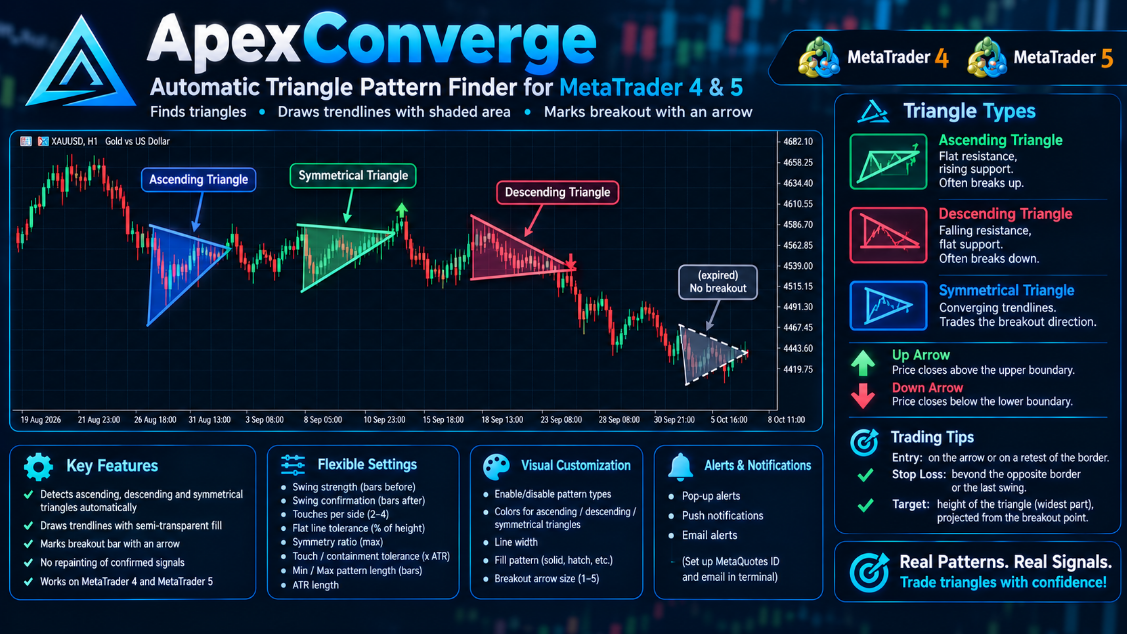
ApexConverge is an indicator that automatically finds triangle patterns on your chart: ascending, descending and symmetrical. It detects significant swing highs and lows, draws resistance and support lines through them, and checks that price has stayed inside the pattern the whole time. Each triangle found is highlighted in color and labeled, and its lines are available as buffers, so you can read them from your own Expert Advisors.

When price closes beyond a triangle’s boundary, the indicator plots a breakout arrow up or down and sends an alert: a pop-up, a push notification to your phone, or an email. Patterns that never broke out or ran out of time are marked separately. Everything is adjustable: swing sensitivity, tolerances, pattern length, which triangle types to show, colors and display style.

MT4-version: https://www.mql5.com/en/market/product/200443

MT5-version: https://www.mql5.com/en/market/product/200424

Subscribe to my channel on MQL5.com: https://www.mql5.com/en/channels/algotrader

And to my Telegram channel, where I post new releases and sometimes free Expert Advisors and indicators: https://t.me/algotrdr
Evgeniy Zhdan
Evgeniy Zhdan
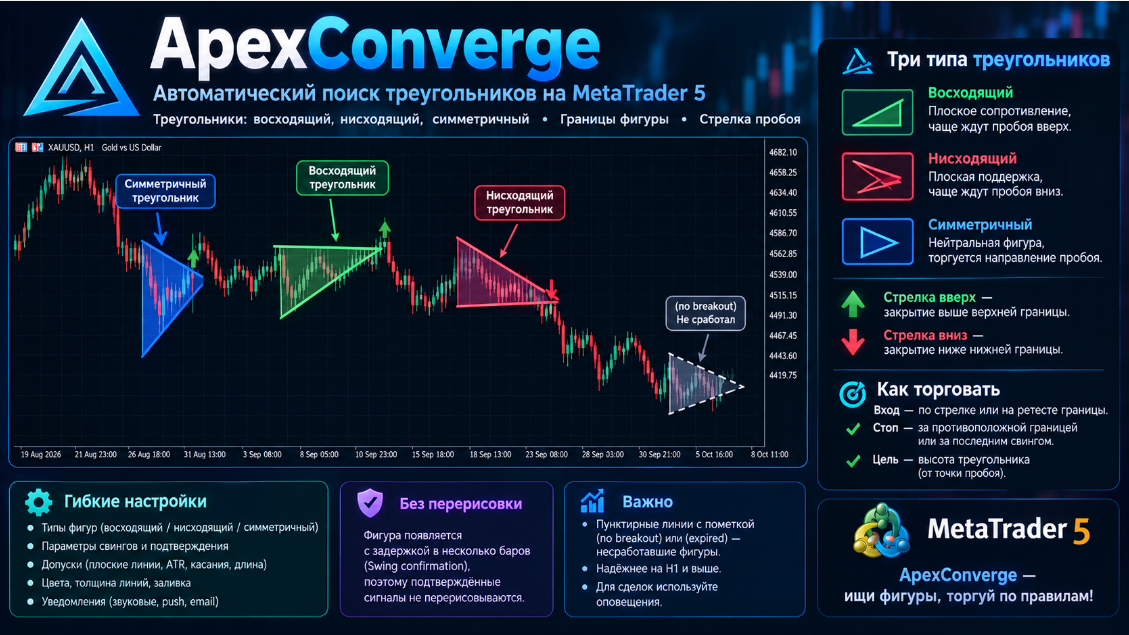
ApexConverge — индикатор, который сам находит на графике треугольники: восходящие, нисходящие и симметричные. Он ищет значимые вершины и впадины цены, проводит по ним линии сопротивления и поддержки и проверяет, что цена всё это время оставалась внутри фигуры. Найденный треугольник подсвечивается цветом и подписывается, а его линии можно считать из буферов для своих советников.

Когда цена закрывается за границей треугольника, индикатор ставит стрелку пробоя вверх или вниз и присылает уведомление: всплывающее окно, push на телефон или письмо. Паттерны, которые не получили пробоя или истекли по времени, помечаются отдельно. Все параметры настраиваются: чувствительность поиска вершин, допуски, длина паттерна, типы треугольников, цвета и стиль отображения.

MT4-version: https://www.mql5.com/en/market/product/200443

MT5-version: https://www.mql5.com/en/market/product/200424

Подписывайтесь на мой канал на MQL5.com: https://www.mql5.com/en/channels/algotrader

А также на Telegram-канал, где я выкладываю новинки и иногда бесплатные советники и индикаторы: https://t.me/algotrdr
Evgeniy Zhdan パブリッシュされたプロダクト

ApexConverge は、トライアングル(上昇・下降・シンメトリカル)を自動検出し、境界線を塗りつぶしゾーン付きで描画して、ブレイクしたバーに矢印を表示する MetaTrader 5 用インジケーターです。 MT5-version: https://www.mql5.com/en/market/product/200424 仕組み スイングの高値・安値を検出し、それらを通る 2 本のトレンドラインを引いて形状を判定します。上辺が水平で下辺が上昇なら上昇トライアングル、上辺が下降で下辺が水平なら下降トライアングル、傾きが近い 2 本が収束していればシンメトリカルです。ブレイクするまで価格はパターン内に収まっている必要があります。パターンは数本遅れて表示され( Swing confirmation (bars after) 参照)、確定したシグナルは再描画されません。 トレードでの使い方 上昇トライアングル (水平のレジスタンス):上方向へのブレイクに注目するのが一般的です。 下降トライアングル (水平のサポート):下方向へのブレイクに注目するのが一般的です。 シンメトリカル

Evgeniy Zhdan パブリッシュされたプロダクト

ApexConverge は、トライアングル(上昇・下降・シンメトリカル)を自動検出し、境界線を塗りつぶしゾーン付きで描画して、ブレイクしたバーに矢印を表示する MetaTrader 5 用インジケーターです。 MT4-version: https://www.mql5.com/en/market/product/200443 仕組み スイングの高値・安値を検出し、それらを通る 2 本のトレンドラインを引いて形状を判定します。上辺が水平で下辺が上昇なら上昇トライアングル、上辺が下降で下辺が水平なら下降トライアングル、傾きが近い 2 本が収束していればシンメトリカルです。ブレイクするまで価格はパターン内に収まっている必要があります。パターンは数本遅れて表示され( Swing confirmation (bars after) 参照)、確定したシグナルは再描画されません。 トレードでの使い方 上昇トライアングル (水平のレジスタンス):上方向へのブレイクに注目するのが一般的です。 下降トライアングル (水平のサポート):下方向へのブレイクに注目するのが一般的です。 シンメトリカル

Evgeniy Zhdan
Evgeniy Zhdan
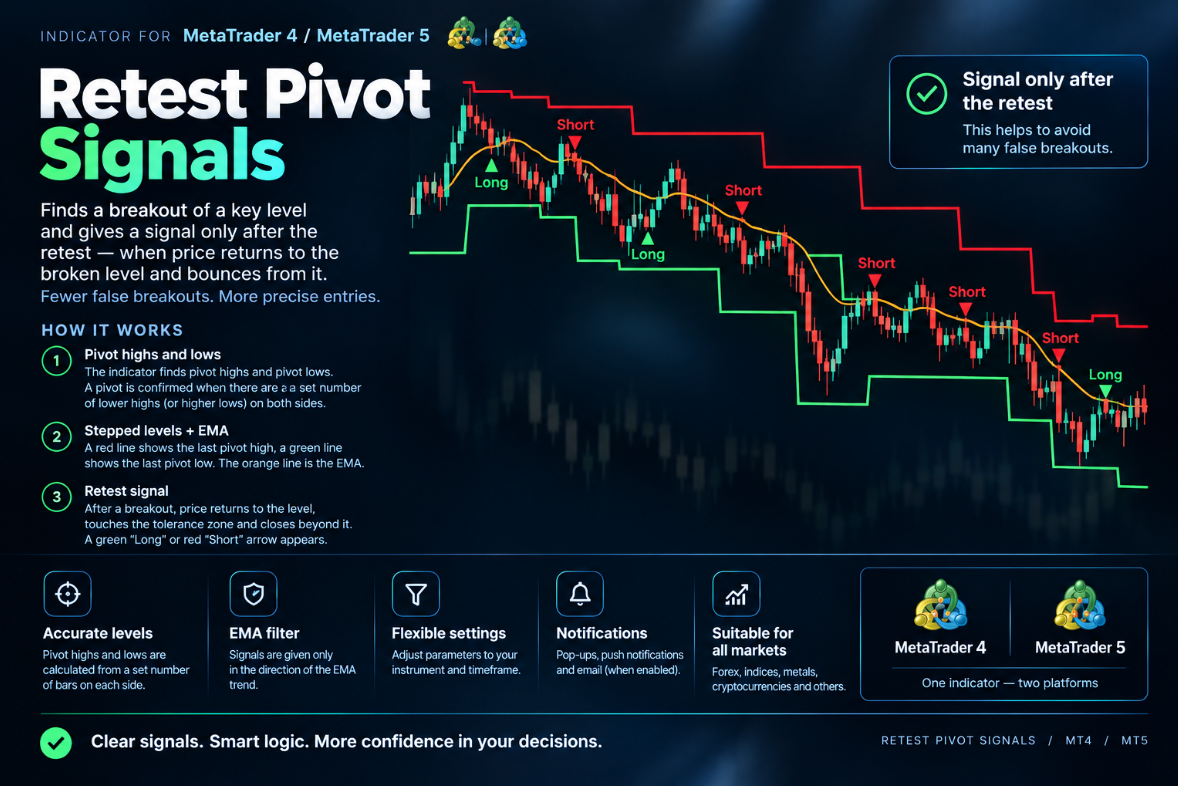
Retest Pivot Signals finds swing highs and lows (pivots) and trades the classic "break and retest" pattern around them. A pivot is confirmed once it has been the highest high or lowest low over the number of bars set in Pivot Length, and the most recent pivot high and pivot low are drawn as horizontal lines. When price closes beyond one of these levels, the indicator marks it as broken and starts watching for a return to it.

A signal appears when price comes back to test the broken level, within the Retest Tolerance (%) range, and closes back on the breakout side. A "Long" arrow is drawn below the bar after an upside breakout and a successful retest of the former resistance. A "Short" arrow is drawn above the bar after a downside breakout and a retest of the former support. Each breakout produces at most one signal, so the chart stays clean. The optional EMA trend filter (Use EMA Trend Filter, EMA Length) keeps only the signals that agree with the trend: longs above the EMA and shorts below it. The signals are generated on bar close, and the arrows automatically keep their distance from the candles when you zoom or resize the chart. The indicator can notify you by pop-up alert, push notification or email (Alerts, Push Notifications, Email Notifications).

MT5-version: https://www.mql5.com/en/market/product/200224

MT4-version: https://www.mql5.com/en/market/product/200236
Evgeniy Zhdan パブリッシュされたプロダクト

Retest Pivot Signals は MetaTrader 5 用のインジケーターで、重要なピボット水準のブレイクアウトを検出し、その水準がリテストされた後にだけシグナルを出します。つまり、価格がブレイクした線まで戻り、そこから反発したときにシグナルが出ます。これにより、だましのブレイクの一部を除外できます。シグナルはブレイクの瞬間ではなく、水準が確認された後に出ます。 MT5-version:  https://www.mql5.com/en/market/product/200224 仕組み インジケーターはピボット高値とピボット安値を探します。ある高値(または安値)の左右に、設定した本数のローソク足があり、それらの高値が低い(または安値が高い)場合にピボットとして確定します。 チャートに2本の階段状のラインを描画します。 赤 は直近のピボット高値、 緑 は直近のピボット安値です。オレンジのラインは EMA です。 Long:

Evgeniy Zhdan パブリッシュされたプロダクト

Retest Pivot Signals は MetaTrader 5 用のインジケーターで、重要なピボット水準のブレイクアウトを検出し、その水準がリテストされた後にだけシグナルを出します。つまり、価格がブレイクした線まで戻り、そこから反発したときにシグナルが出ます。これにより、だましのブレイクの一部を除外できます。シグナルはブレイクの瞬間ではなく、水準が確認された後に出ます。 MT4-version:  https://www.mql5.com/en/market/product/200236 仕組み インジケーターはピボット高値とピボット安値を探します。ある高値(または安値)の左右に、設定した本数のローソク足があり、それらの高値が低い(または安値が高い)場合にピボットとして確定します。 チャートに2本の階段状のラインを描画します。 赤 は直近のピボット高値、 緑 は直近のピボット安値です。オレンジのラインは EMA です。 Long:

Evgeniy Zhdan
Evgeniy Zhdan
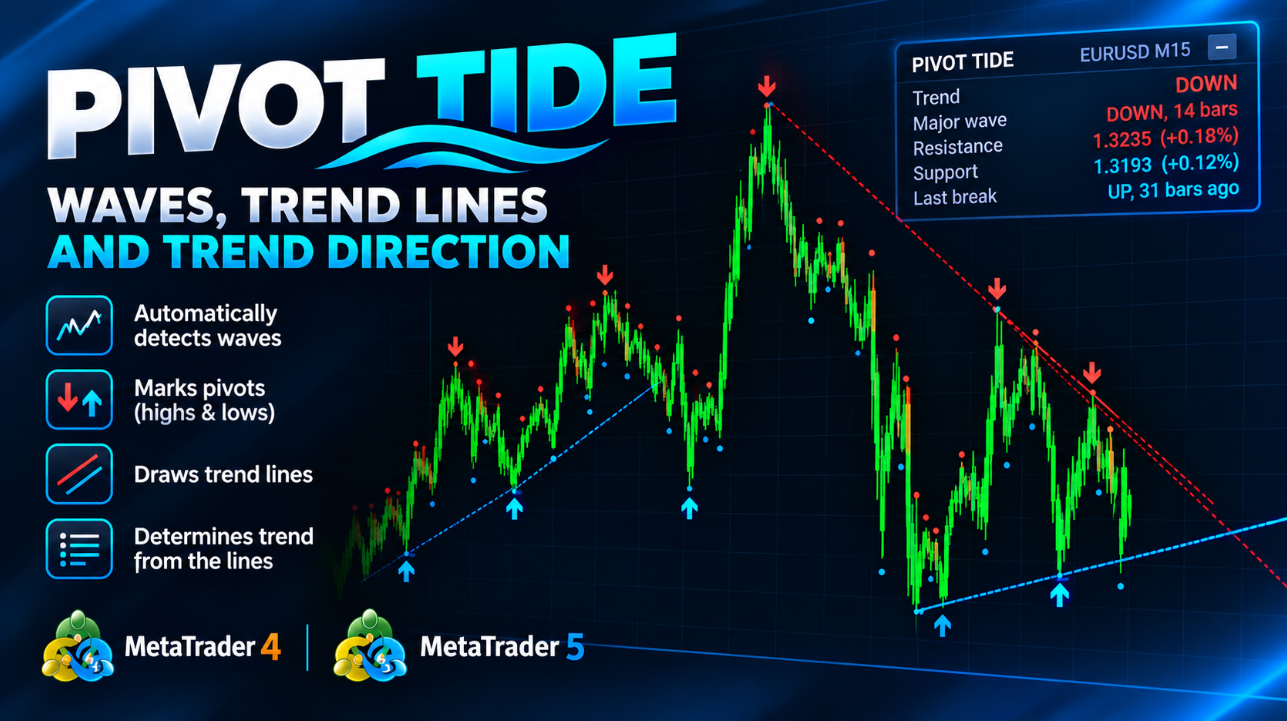
Pivot Tide splits the market into waves using a fast simple moving average against a slow weighted one. Each crossover starts a new wave, and the wave's extreme is marked as a pivot: large arrows for major waves, small dots for minor ones. Both can be read from an EA through iCustom.

Pivots are joined into automatic trend lines: resistance through two falling peaks, support through two rising troughs. A line counts as broken when a candle closes beyond it, and live lines can extend to the right.

Trend comes from the lines. If both support and resistance are intact, it is a range. If only support survives, the trend is up. If only resistance survives, it is down. If neither survives, the last breakout decides. An optional draggable panel shows the trend, wave length, key levels and the last breakout, and alerts or push notifications fire on every trend change.

MT5-version: https://www.mql5.com/en/market/product/199662

MT4-version: https://www.mql5.com/en/market/product/199656
Evgeniy Zhdan パブリッシュされたプロダクト

30.00 USD

Pivot Tide — ウェーブのピボット、自動トレンドライン、ラインに基づくトレンド方向の判定 Pivot Tide は MetaTrader 4 用のインディケータです。チャートを自動的にウェーブに分割し、各ウェーブの高値と安値にマーカーを付け、それらを結んでトレンドラインを引き、ラインの状態からトレンドの方向を判定します。すべてチャート上に直接表示され、コンパクトな情報パネルも備えています。 あらゆる銘柄、あらゆる時間足で動作します。 MT4-version:  https://www.mql5.com/en/market/product/199656 機能 ウェーブを検出します。 ウェーブは 2 本の移動平均線の関係で定義されます。短期の SMA と長期の LWMA です。短期線が長期線の上にある間は上昇ウェーブ、下にある間は下降ウェーブです。 ピボットをマークします。 ウェーブが終了すると(移動平均線が交差すると)、その極値にマーカーを置きます。上昇ウェーブの高値、または下降ウェーブの安値です。 トレンドラインを引きます。 連続する同種のピボット 2

Evgeniy Zhdan パブリッシュされたプロダクト

30.00 USD

Pivot Tide — ウェーブのピボット、自動トレンドライン、ラインに基づくトレンド方向の判定 Pivot Tide は MetaTrader 4 用のインディケータです。チャートを自動的にウェーブに分割し、各ウェーブの高値と安値にマーカーを付け、それらを結んでトレンドラインを引き、ラインの状態からトレンドの方向を判定します。すべてチャート上に直接表示され、コンパクトな情報パネルも備えています。 あらゆる銘柄、あらゆる時間足で動作します。 MT5-version:  https://www.mql5.com/en/market/product/199662 機能 ウェーブを検出します。 ウェーブは 2 本の移動平均線の関係で定義されます。短期の SMA と長期の LWMA です。短期線が長期線の上にある間は上昇ウェーブ、下にある間は下降ウェーブです。 ピボットをマークします。 ウェーブが終了すると(移動平均線が交差すると)、その極値にマーカーを置きます。上昇ウェーブの高値、または下降ウェーブの安値です。 トレンドラインを引きます。 連続する同種のピボット 2

Evgeniy Zhdan パブリッシュされたプロダクト

Confluence Meter:26本のインジケーターを1つの総合レーティングに Confluence Meter は、人気の高い26本のインジケーターのシグナルを計算し、「売り/中立/買い」というシンプルなレーティングにまとめます。何十ものウィンドウを開いて数値を手作業で見比べる必要はありません。パネルをひと目見るだけで、選択した時間足で相場がどちらに傾いているかが分かります。 MT5-version:  https://www.mql5.com/en/market/product/199466 Our products: https://www.mql5.com/en/users/trendhunter/seller チャートに表示される内容 **Oscillators ゲージ。**11本のオシレーターのレーティングです。RSI、Stochastic、CCI、ADX、Awesome Oscillator、Momentum、MACD、Stochastic RSI、Williams %R、Bulls/Bears Power、Ultimate Oscillator

Evgeniy Zhdan パブリッシュされたプロダクト

Confluence Meter:26本のインジケーターを1つの総合レーティングに Confluence Meter は、人気の高い26本のインジケーターのシグナルを計算し、「売り/中立/買い」というシンプルなレーティングにまとめます。何十ものウィンドウを開いて数値を手作業で見比べる必要はありません。パネルをひと目見るだけで、選択した時間足で相場がどちらに傾いているかが分かります。 MT4-version:  https://www.mql5.com/en/market/product/199466 Our products: https://www.mql5.com/en/users/trendhunter/seller チャートに表示される内容 **Oscillators ゲージ。**11本のオシレーターのレーティングです。RSI、Stochastic、CCI、ADX、Awesome Oscillator、Momentum、MACD、Stochastic RSI、Williams %R、Bulls/Bears Power、Ultimate Oscillator

Evgeniy Zhdan
Evgeniy Zhdan
FREE

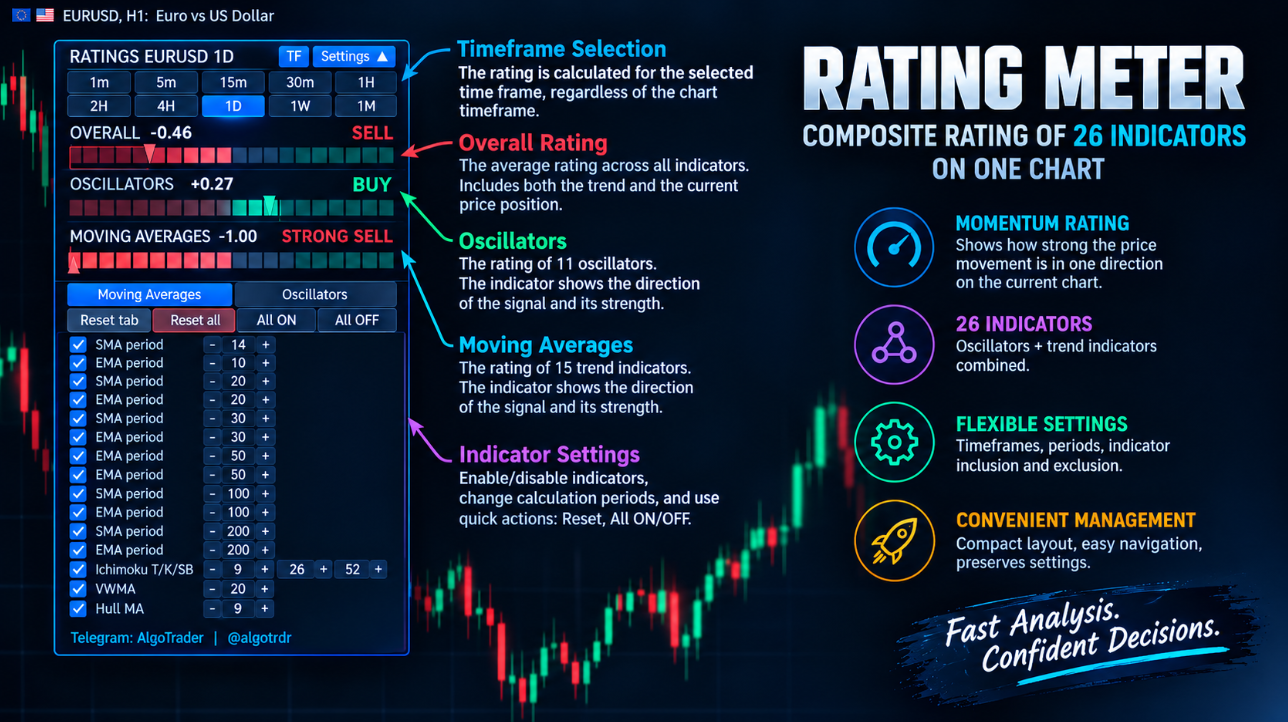
Rating Meter is a technical analysis panel for MetaTrader 5 that reads 26 popular indicators for you: 15 trend indicators (SMA and EMA on six periods, Ichimoku, VWMA and Hull MA) and 11 oscillators (RSI, Stochastic, MACD, CCI, ADX and others).

Each indicator casts a simple buy, neutral or sell vote, and the votes are averaged into a single rating from STRONG SELL to STRONG BUY. Two gauges show the oscillator and moving-average ratings separately, and an overall bar combines them. Each gauge has a needle and a vote counter, so you can see at a glance which way the market is leaning.

The panel is fully interactive. You can switch the rating between timeframes from 1 minute to 1 month, turn individual indicators on or off, and adjust their periods with plus and minus buttons, with the rating updating instantly.

The panel can be dragged anywhere on the chart, collapsed to show only the gauges, and it remembers your settings between restarts. It draws nothing on the price chart and opens no trades. It is a decision-support tool to use alongside your own strategy and risk management.

https://www.mql5.com/en/market/product/199402
Evgeniy Zhdan パブリッシュされたプロダクト

Rating Meter:26本のインジケーターを1つの総合レーティングに Rating Meter は、人気の高い26本のインジケーターのシグナルを自動で計算し、「売り/中立/買い」というシンプルなレーティングにまとめます。インジケーターのウィンドウをひとつずつ開いて数値を見比べる必要はありません。パネルをひと目見るだけで、選択した時間足で相場がどちらに傾いているかが分かります。 Our products: https://www.mql5.com/en/users/trendhunter/seller パネルの表示内容 **Oscillators ゲージ:**11本のオシレーターで構成されるグループのレーティングです。RSI、Stochastic、CCI、ADX、Awesome Oscillator、Momentum、MACD、Stochastic RSI、Williams %R、Bulls/Bears Power、Ultimate Oscillator が含まれます。 **Moving Averages

Evgeniy Zhdan パブリッシュされたプロダクト

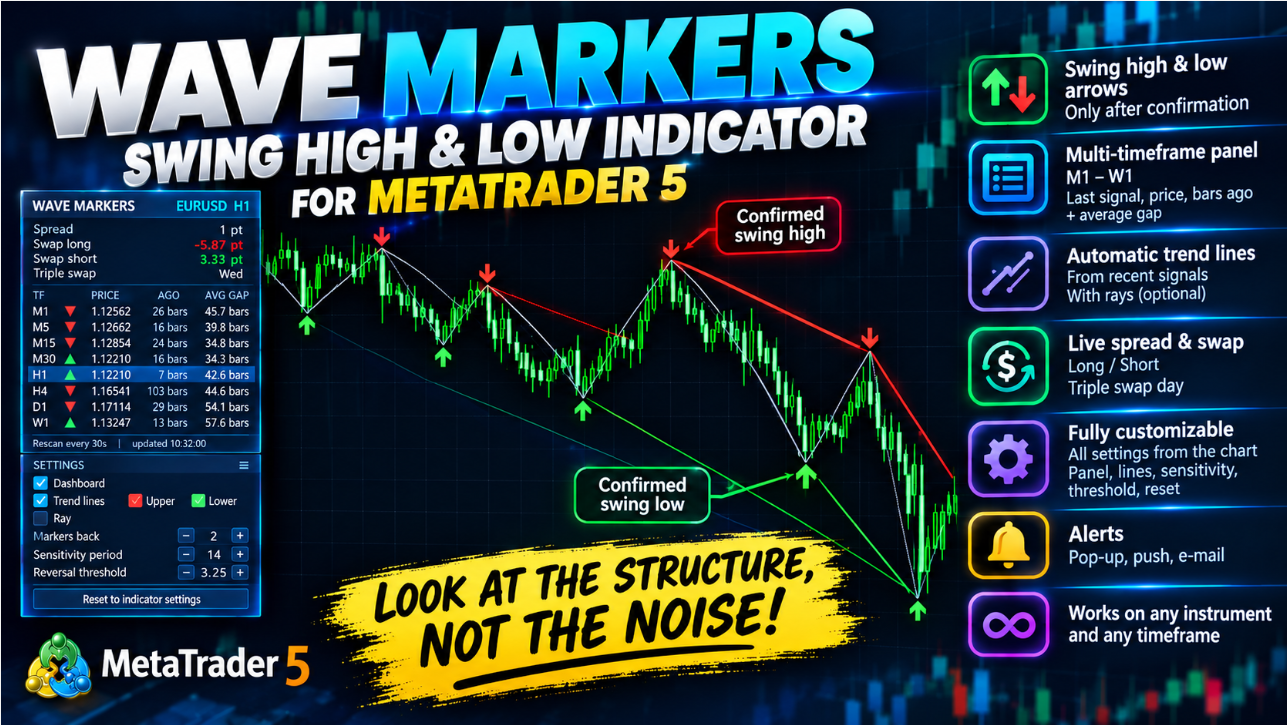
Wave Markers:マルチタイムフレーム対応パネル付き・適応型ウェーブマップ ノイズではなく、相場の本当の構造を。確認済みのスイング高値と安値、それらを結ぶトレンドライン、そして M1 から W1 までの全時間足の状況を、ひとつのパネルにまとめて表示します。 これは何ですか Wave Markers は MetaTrader 5 用のチャート構造インジケーターです。価格の転換点(スイング高値とスイング安値)を見つけて見やすい矢印で表示し、その周りに実用的なツールを用意します。トレンドライン、全時間足の一覧表、そしてリアルタイムのスプレッドとスワップの表示です。 「買い」「売り」の指示は出さず、成果も約束しません。やることはひとつだけで、それを丁寧に行います。相場が実際にどこで反転したかを示し、構造をより速く、より一貫して読めるようにします。 MT5-version:  https://www.mql5.com/en/market/product/199158 単なる ZigZag ではない理由 従来の ZigZag

Evgeniy Zhdan パブリッシュされたプロダクト

79.00 USD

Wave Markers:マルチタイムフレーム対応パネル付き・適応型ウェーブマップ ノイズではなく、相場の本当の構造を。確認済みのスイング高値と安値、それらを結ぶトレンドライン、そして M1 から W1 までの全時間足の状況を、ひとつのパネルにまとめて表示します。 これは何ですか Wave Markers は MetaTrader 5 用のチャート構造インジケーターです。価格の転換点(スイング高値とスイング安値)を見つけて見やすい矢印で表示し、その周りに実用的なツールを用意します。トレンドライン、全時間足の一覧表、そしてリアルタイムのスプレッドとスワップの表示です。 「買い」「売り」の指示は出さず、成果も約束しません。やることはひとつだけで、それを丁寧に行います。相場が実際にどこで反転したかを示し、構造をより速く、より一貫して読めるようにします。 単なる ZigZag ではない理由 従来の ZigZag

Evgeniy Zhdan
Evgeniy Zhdan
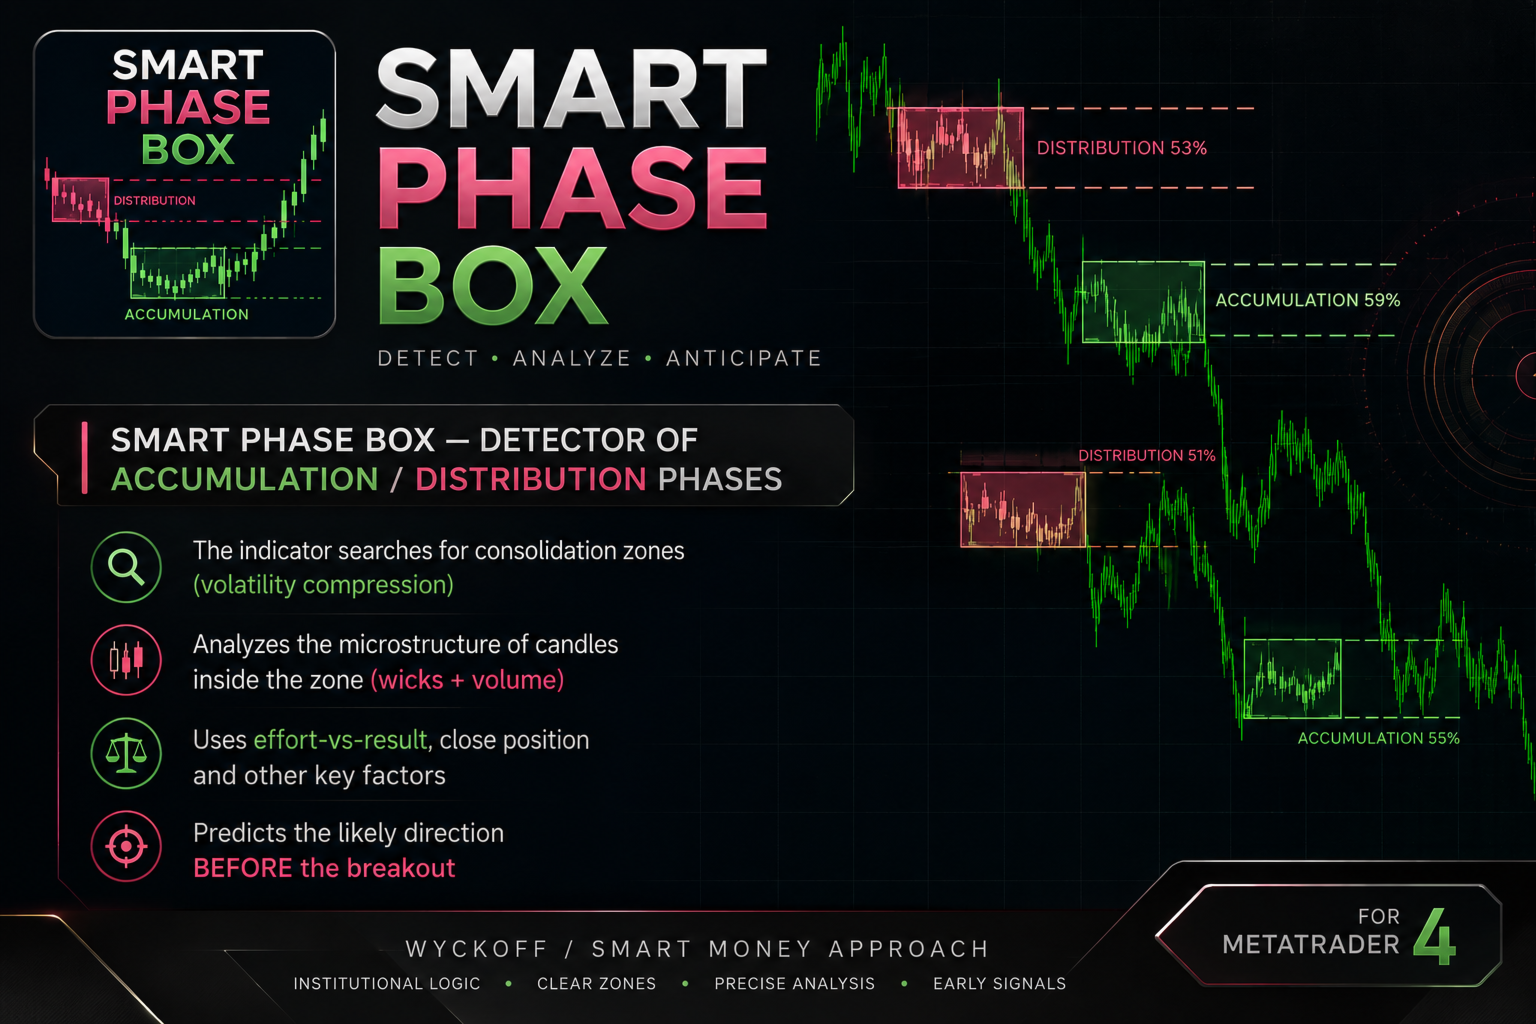
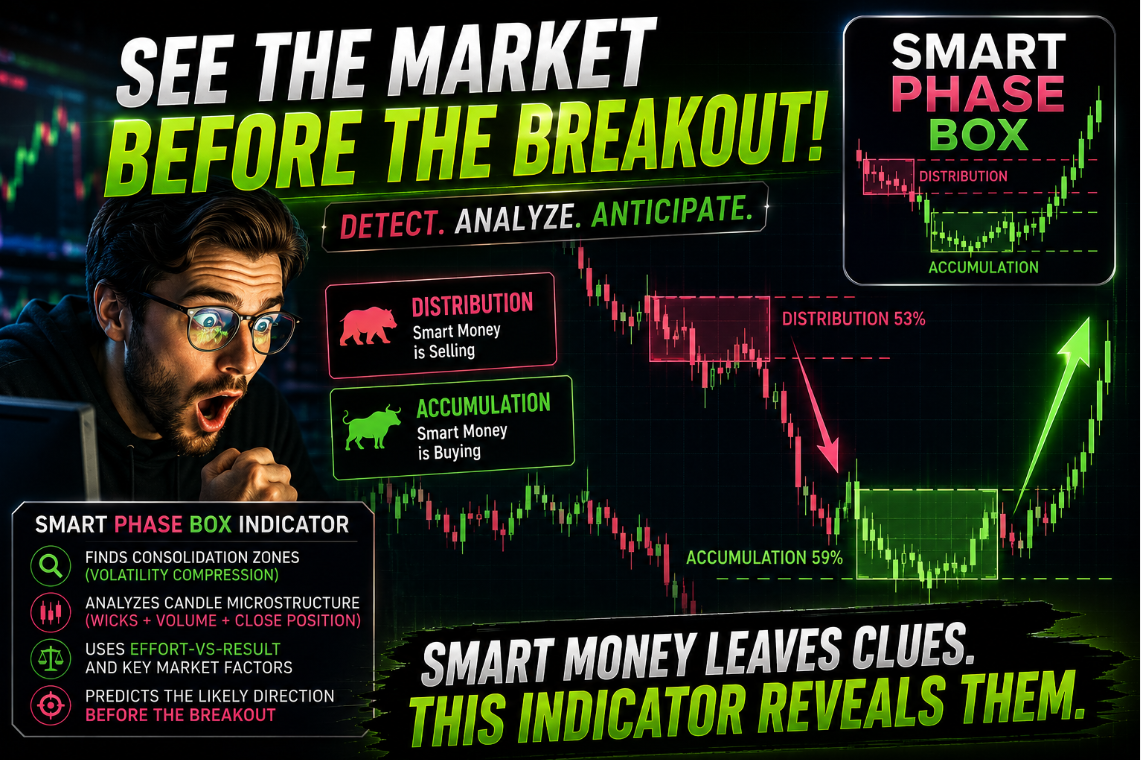
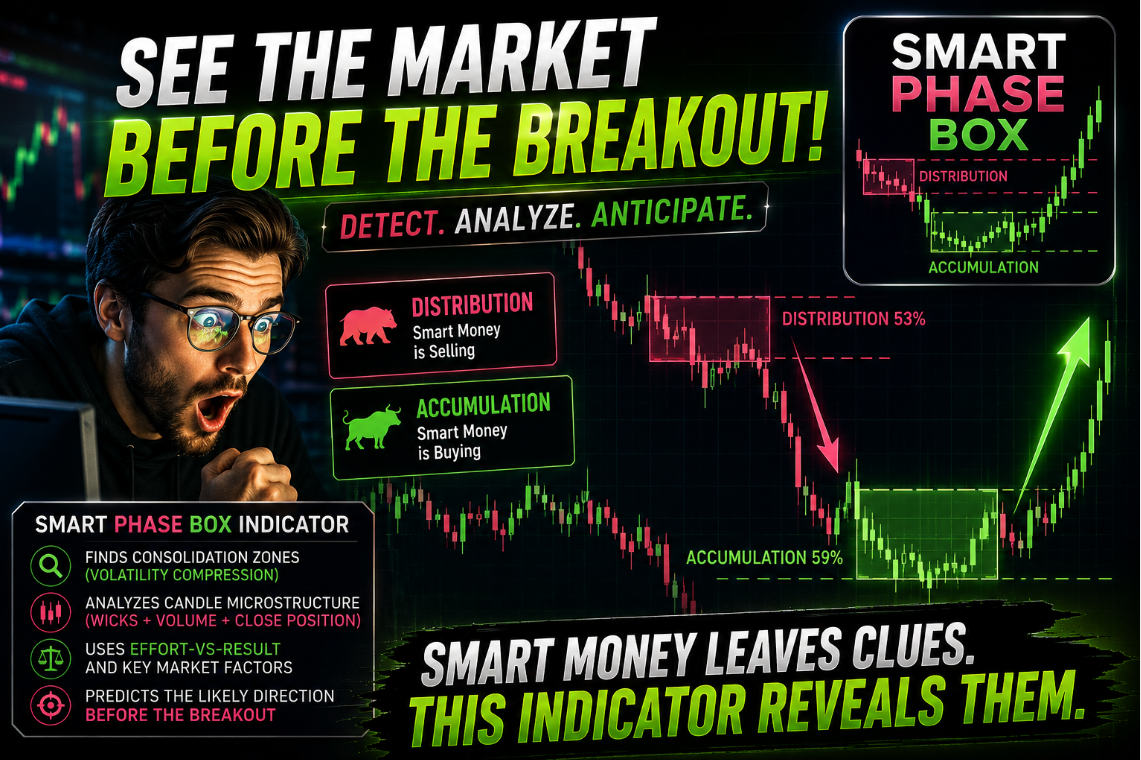
Smart Phase Box automatically locates consolidation zones (bases, flats) on the chart and analyzes the candle microstructure inside each zone — wicks, tick volume, body-to-range ratio, and where price closes relative to the zone — to estimate whether the zone looks more like accumulation (buyers absorbing supply) or distribution (sellers absorbing demand), based on classic Wyckoff / Smart Money concepts.

https://www.mql5.com/en/market/product/186530
Evgeniy Zhdan
Evgeniy Zhdan
Every chart is full of quiet stretches. Price stalls, coils into a tight range, and just sits there for a while before eventually breaking out in one direction. Most traders scroll right past these zones, waiting for "something to happen." But if you look closely — really closely, at the candle-by-candle texture rather than the overall shape — those quiet stretches are rarely as empty as they look. Something is usually happening. It's just happening below the surface.

That's the starting point for Smart Phase Box.

Indicator for

MT5: https://www.mql5.com/en/market/product/186516

MT4: https://www.mql5.com/en/market/product/186530
Evgeniy Zhdan
Evgeniy Zhdan
Smart Phase Box (SPB) — Indicator Description
Smart Phase Box automatically locates consolidation zones (bases, flats) on the chart and analyzes the candle microstructure inside each zone — wicks, tick volume, body-to-range ratio, and where price closes relative to the zone — to estimate whether the zone looks more like accumulation (buyers absorbing supply) or distribution (sellers absorbing demand), based on classic Wyckoff / Smart Money concepts.

MT5: https://www.mql5.com/en/market/product/186516

MT4: https://www.mql5.com/en/market/product/186530