Hidden Markov Model MT5
- インディケータ
- バージョン: 1.0
- アクティベーション: 5

HIDDEN MARKOV MODEL
Most losing trades come from using the right tool in the wrong conditions. A trend strategy in a choppy range gets stopped out again and again. A range strategy in a strong trend gets run over.
HMM Regime Engine tells you what kind of market you are in right now, so you can pick the right tool or stand aside.
THREE STATES. NO GUESSING.
CHOP (Blue)
Price is going nowhere. No clear direction. Range ideas fit here. Trend-following ideas usually struggle.
TRENDING (UP - Green or DOWN - Red)
Price is moving in one direction with real persistence. The indicator shows which way: trending up or trending down.
WEAKENING (UPTREND FADING - Light Green or DOWNTREND FADING - Orange)
The trend is still there, but it is running out of steam. You see which trend is weakening. This is the warning many traders want before a trend ends or turns into a range.
You see the answer in about five seconds, on every symbol and timeframe.
WHAT YOU GET ON YOUR CHART
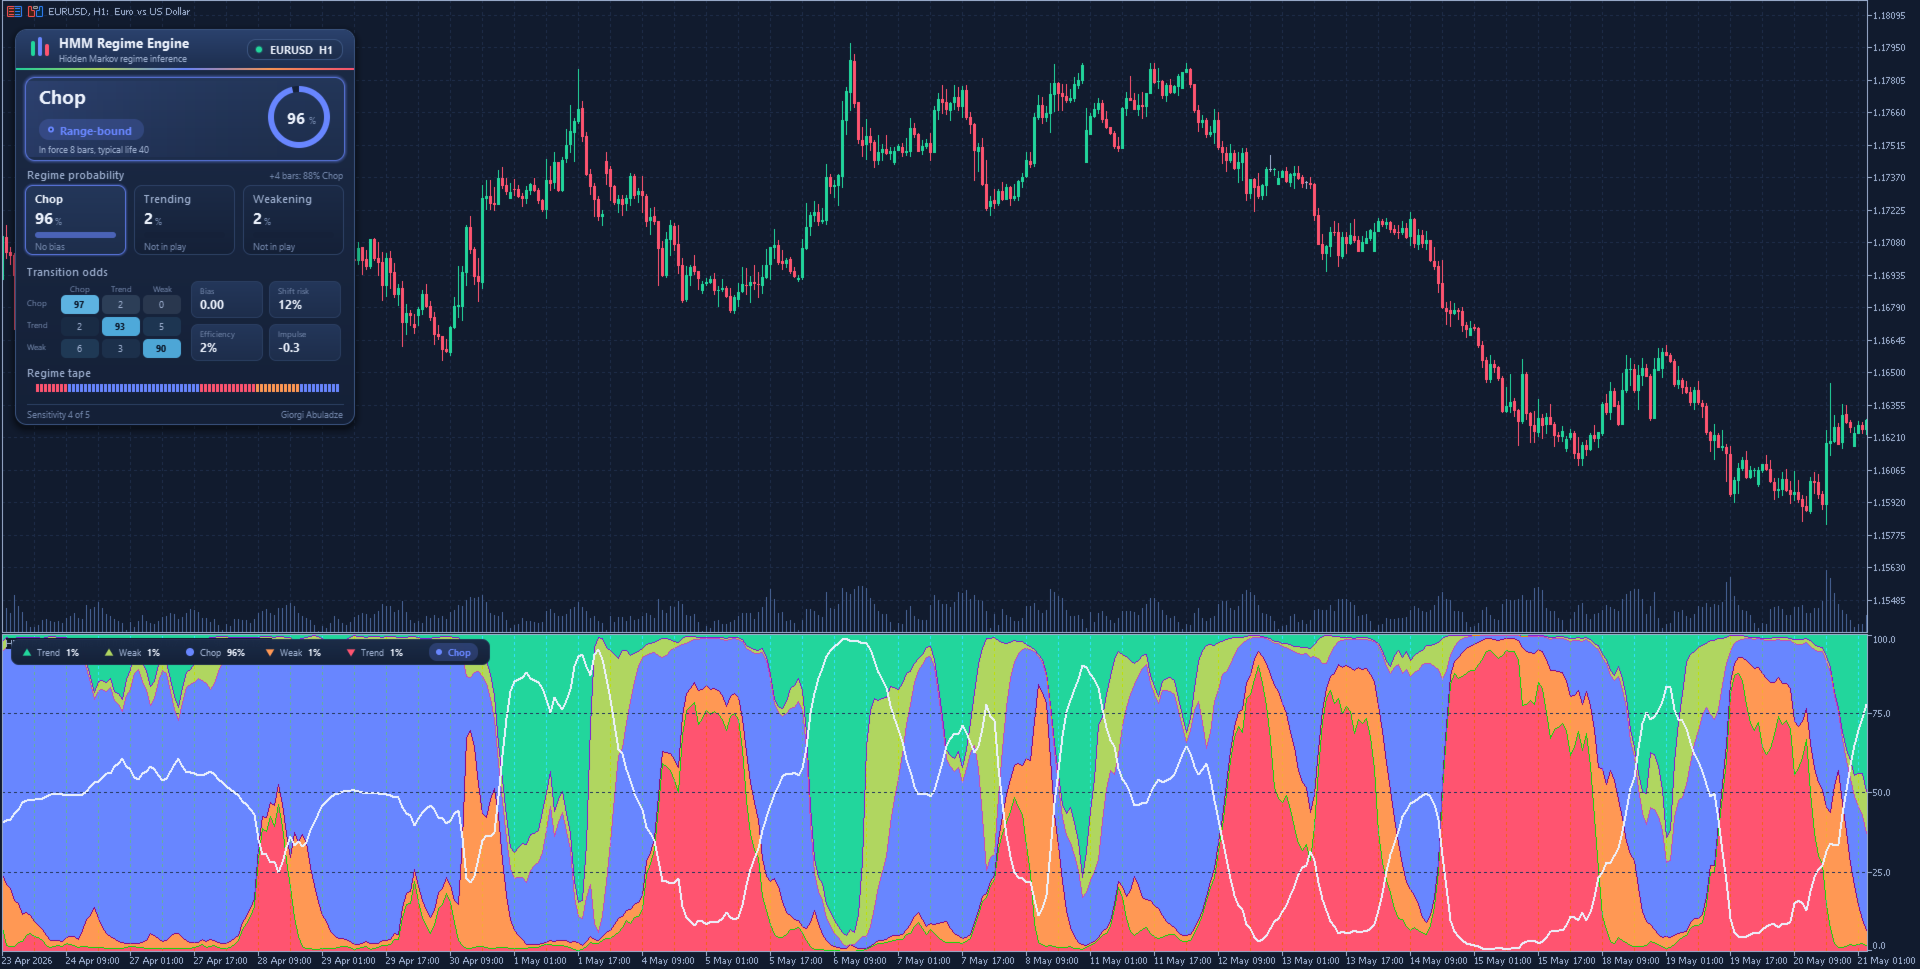
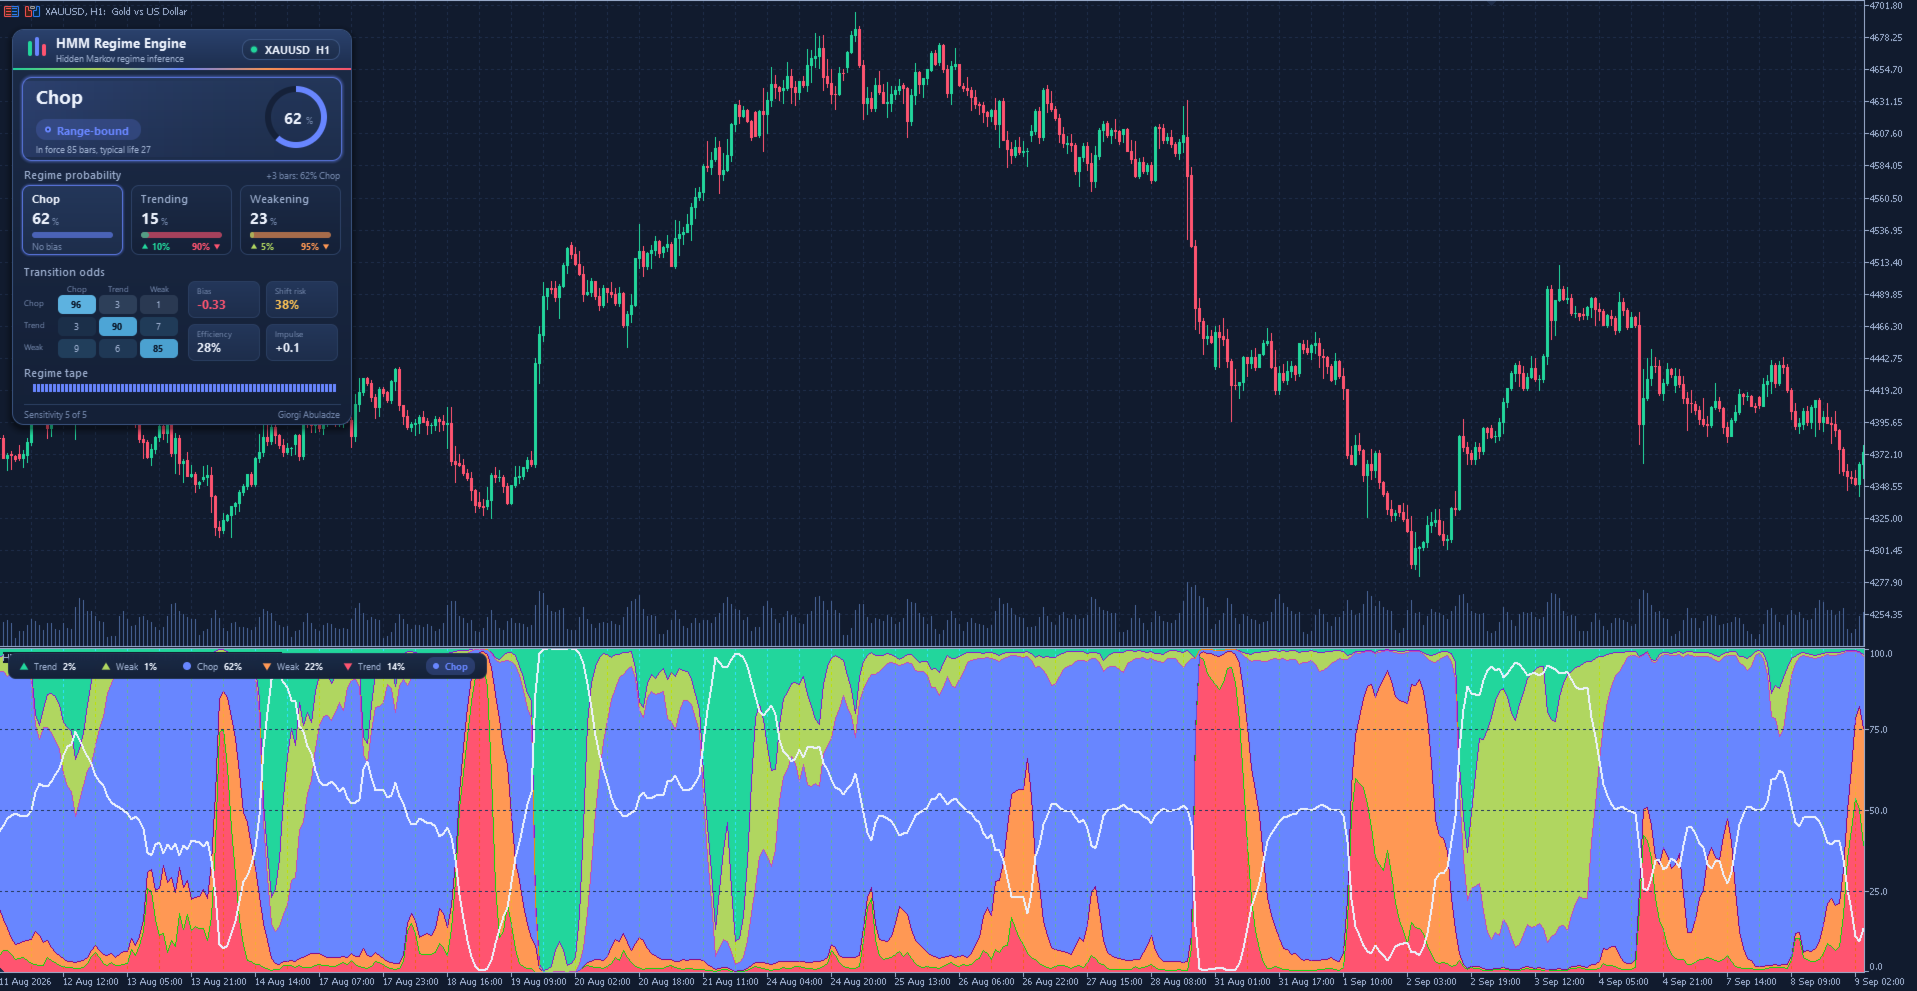
1. A live dashboard
- The current regime in large text, with its direction.
- A confidence ring: how sure the model is.
- The probability of each regime, with the up/down split.
- Bias: are buyers or sellers in control?
- Shift risk: the chance the current regime will not still be in place a few bars from now.
- A colour tape of the last bars, so you see how the market got here.
Move it to any corner, resize it, or click its header to collapse it.
2. A clean probability chart under the price
Down trend sits at the bottom, chop in the middle, up trend at the top, with the weakening states in between. When the colour band changes, the market has changed. A white line shows the directional bias.
3. Alerts
Pop-up, push, e-mail and sound alerts when the confirmed regime or its direction changes. You do not need to watch the screen. (Push and e-mail need to be set up in your terminal.)
FIVE SENSITIVITY PRESETS: PICK YOUR SPEED
It works like choosing a moving average length:
1 - Very low: calm and stable. Fewer changes, but later.
2 - Low
3 - Medium: balanced default.
4 - High
5 - Very high: reacts fast. More changes, sooner.
Swing and position traders usually prefer the lower presets. Scalpers and intraday traders usually prefer the higher ones. Switch at any time and compare.
WHY IT IS DIFFERENT FROM A NORMAL INDICATOR
Most indicators apply one fixed formula and print a line. This one uses a Hidden Markov Model, a method used in statistics and speech recognition to work out which hidden state a system is in from what you can observe.
In simple terms:
- It looks at three things each bar: how far price moved recently, how it was moving before that, and how straight the path was.
- It keeps a running probability for each of five states: trend up, trend down, weakening up, weakening down and chop.
- Each new bar updates those probabilities. A change is only confirmed when the evidence holds, so it does not flip on every wiggle.
- It re-learns from recent bars on its own, so it adapts to each symbol and timeframe.
- Up and down are treated as mirror images, so it is not biased towards buying or selling.
Closed bars are final. Their values are not revised by later data. What you see in the history is what you would have seen live.
HOW TRADERS CAN USE IT
- Run trend ideas only when the regime is Trending in your direction.
- Consider tightening or taking profit when it turns to Weakening.
- Use range ideas when it shows Chop.
- Skip trades when the confidence is low.
- Combine it with your own entries. It describes the market. It does not give entry signals.
SETTINGS
Sensitivity (1 to 5), training window (0 = automatic), bars to calculate, live update of the forming bar, dashboard corner / offsets / scale / start collapsed, subwindow legend on or off, matching chart colours on or off, and the four alert types.
GOOD TO KNOW
- Works on any symbol and any timeframe.
- Allow at least 1,000 bars of history. The first bars are blank while the model collects its first data, and the dashboard shows the progress.
- By default it applies a matching dark colour scheme to your chart and restores your colours when you remove it. You can turn this off.
- The regimes are statistical estimates. They can be wrong, and faster presets change state more often.
- It is an analysis tool. It does not open or close trades.
RISK WARNING
Trading leveraged products carries a high risk of loss. This indicator does not guarantee any result and is not financial advice. Test it on a demo account first.