One Click Grid Panel
- ユーティリティ
- バージョン: 3.0
- アクティベーション: 5

Manual Grid Trader is a trade panel for traders who choose their own entries and want the grid around them placed and managed for them. You press BUY or SELL; the panel opens the entry, places the further levels, and closes the whole basket together at one take profit.
Please note
This is a tool for manual trading. It does not decide when to enter and it does not predict price. Grid trading adds positions while price moves against the basket, so losses can grow quickly, especially with a lot multiplier above 1.0. Test your settings on a demo account first and use the money limits.
How the grid works
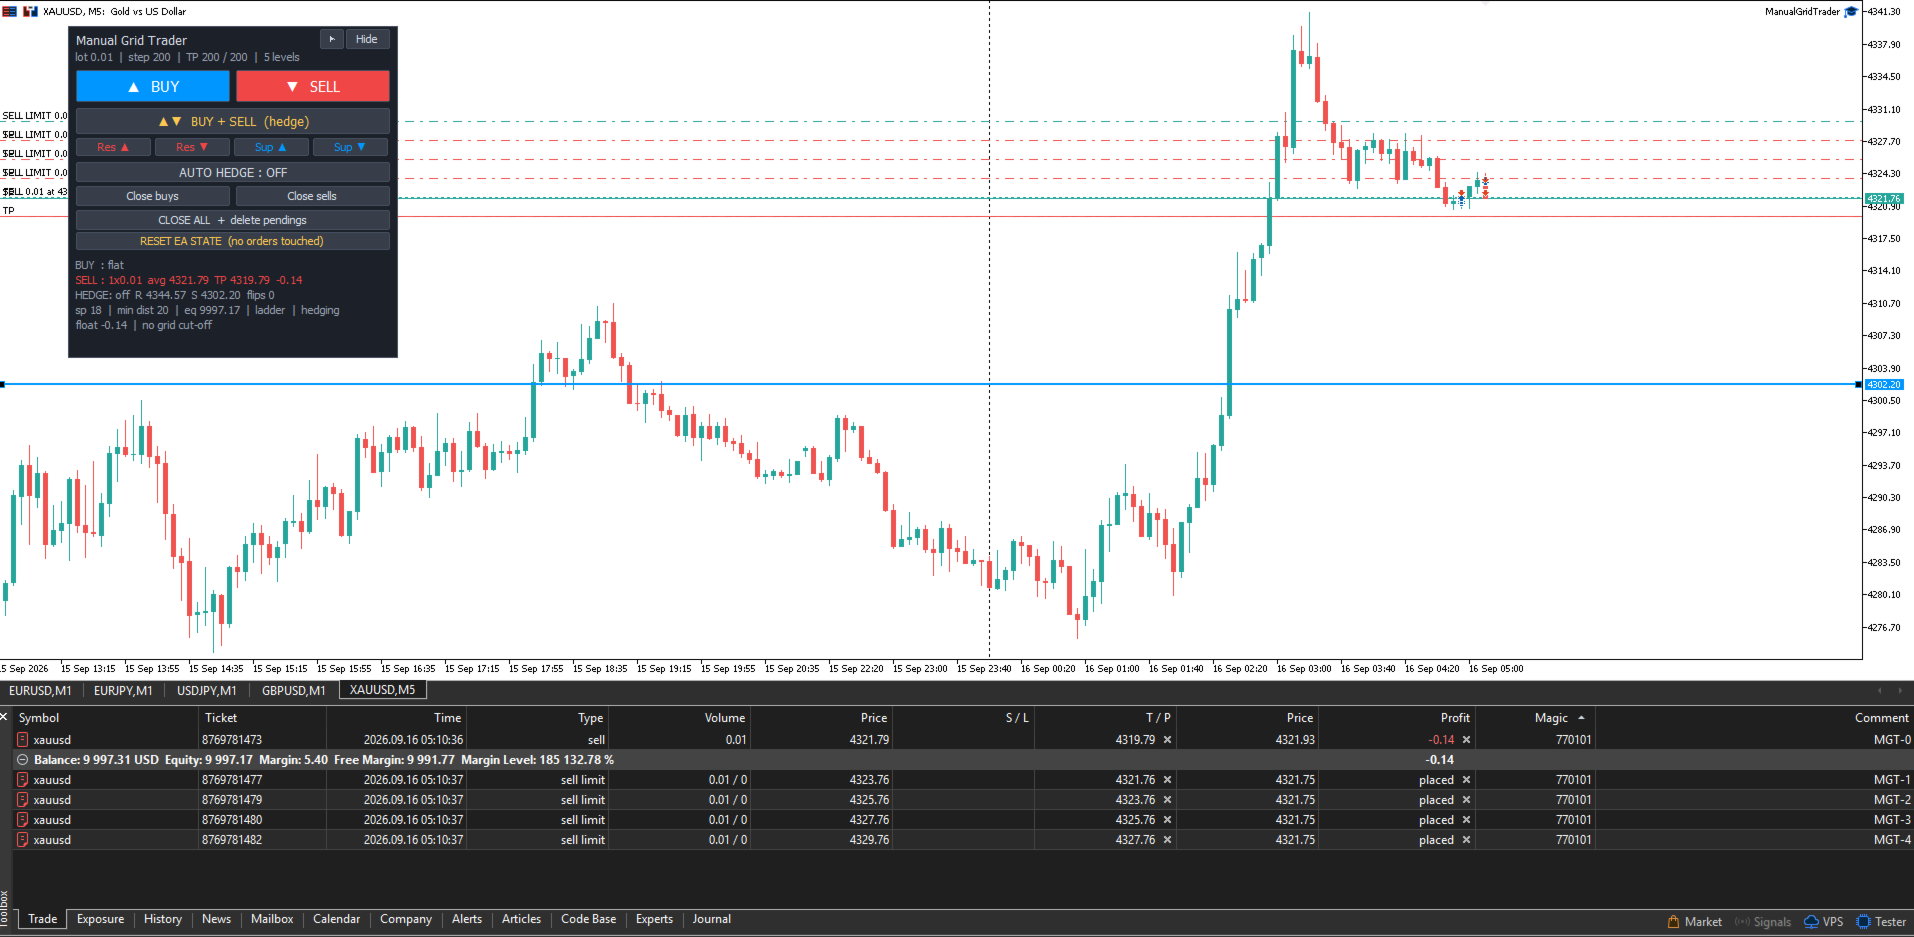
- BUY or SELL: one market order, plus limit orders at a fixed distance below it (buy) or above it (sell), up to the number of levels you set. In market order mode the further levels are opened at market instead, each time price moves one step against the basket.
- Or no grid at all: switch the further levels off and each press opens a single order with its own stop loss and take profit, managed on its own. The basket take profit never touches those orders.
- One take profit for the basket: with one entry open, the take profit is a fixed distance from that entry. Once a second level fills, every position in the basket gets the same take profit, a set distance from the basket's average price, so they close together.
- Pressing BUY or SELL again adds another entry to the running basket, and the take profit is recalculated from the new average.
- When a basket closes, its remaining pending orders are deleted.
- Buy and sell baskets are independent and can run at the same time on a hedging account.
Exits drawn on the chart
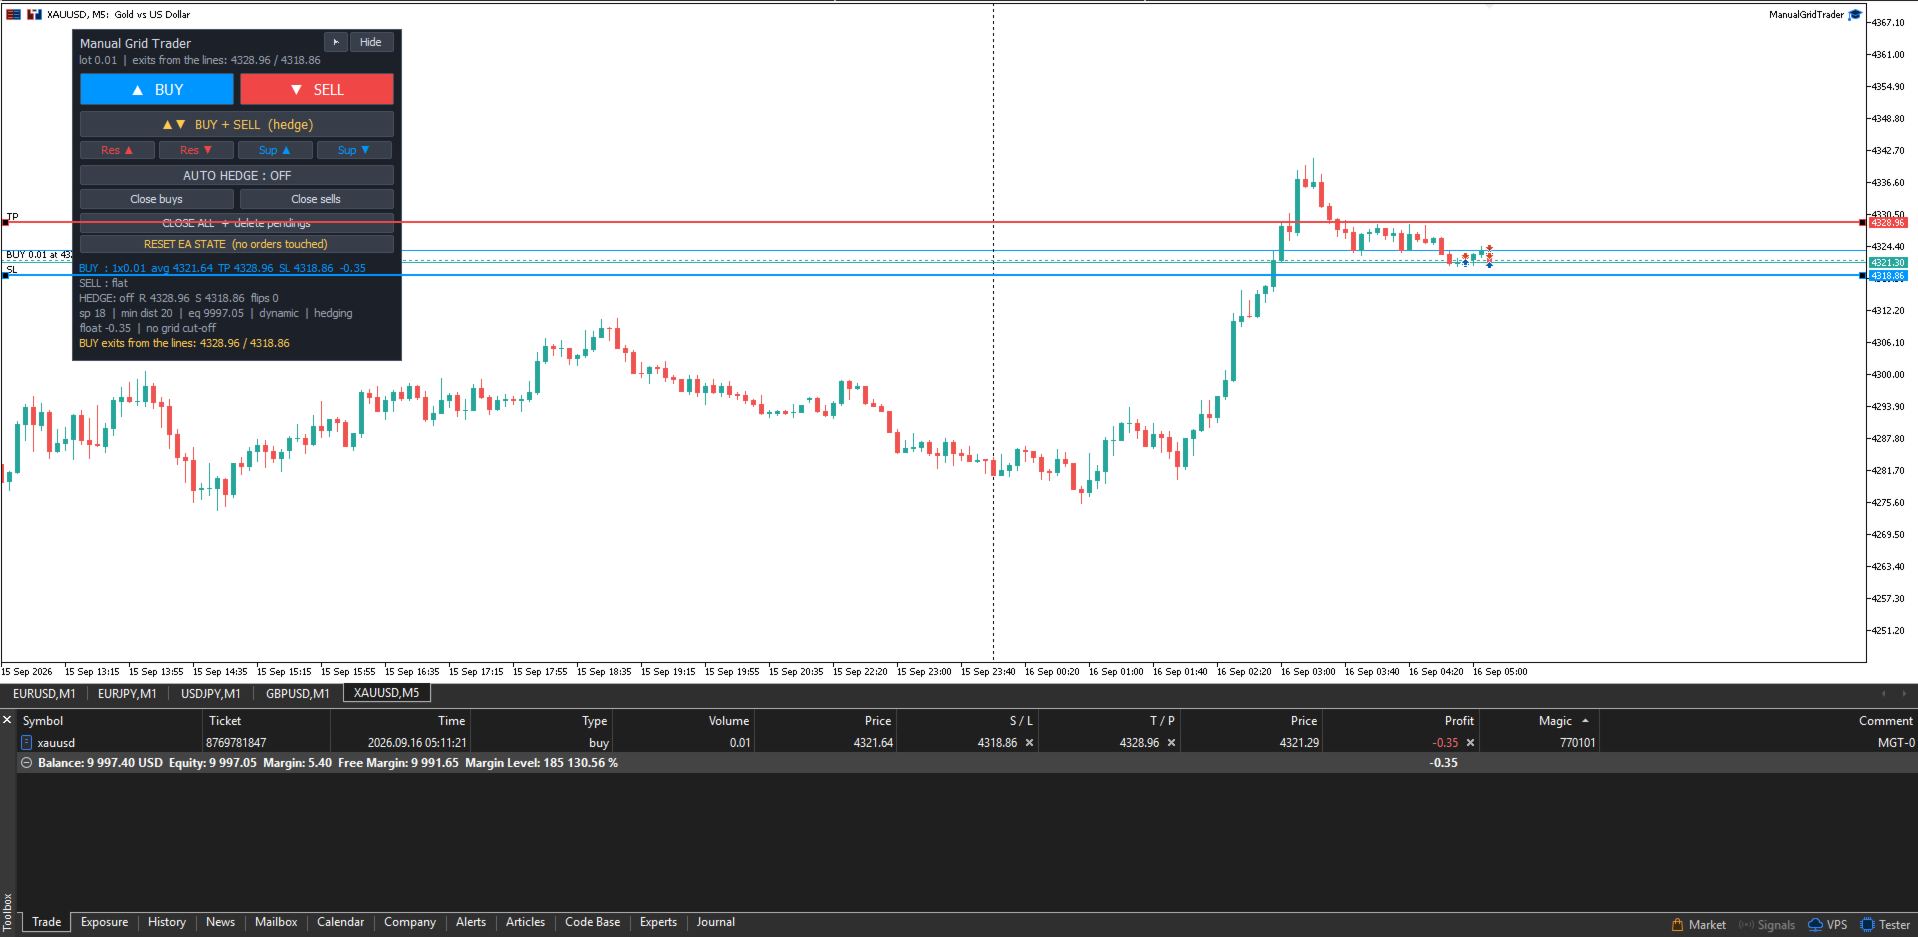
- Two lines sit on the chart from the moment the panel starts. Drag them onto your own levels, or move them step by step with the line buttons.
- Without a grid, and in market order mode, those lines are the exits: for a buy the line above price is the take profit and the line below it is the stop loss, and for a sell they swap. Move a line and the open orders follow it.
- When price reaches a line, that side is closed at market, so a level the broker refused cannot leave a trade running past it.
- If the lines are missing, or price is not between them, the take profit and stop loss in points are used instead and the panel says so. The lines can also be switched off with one setting.
Hedge mode
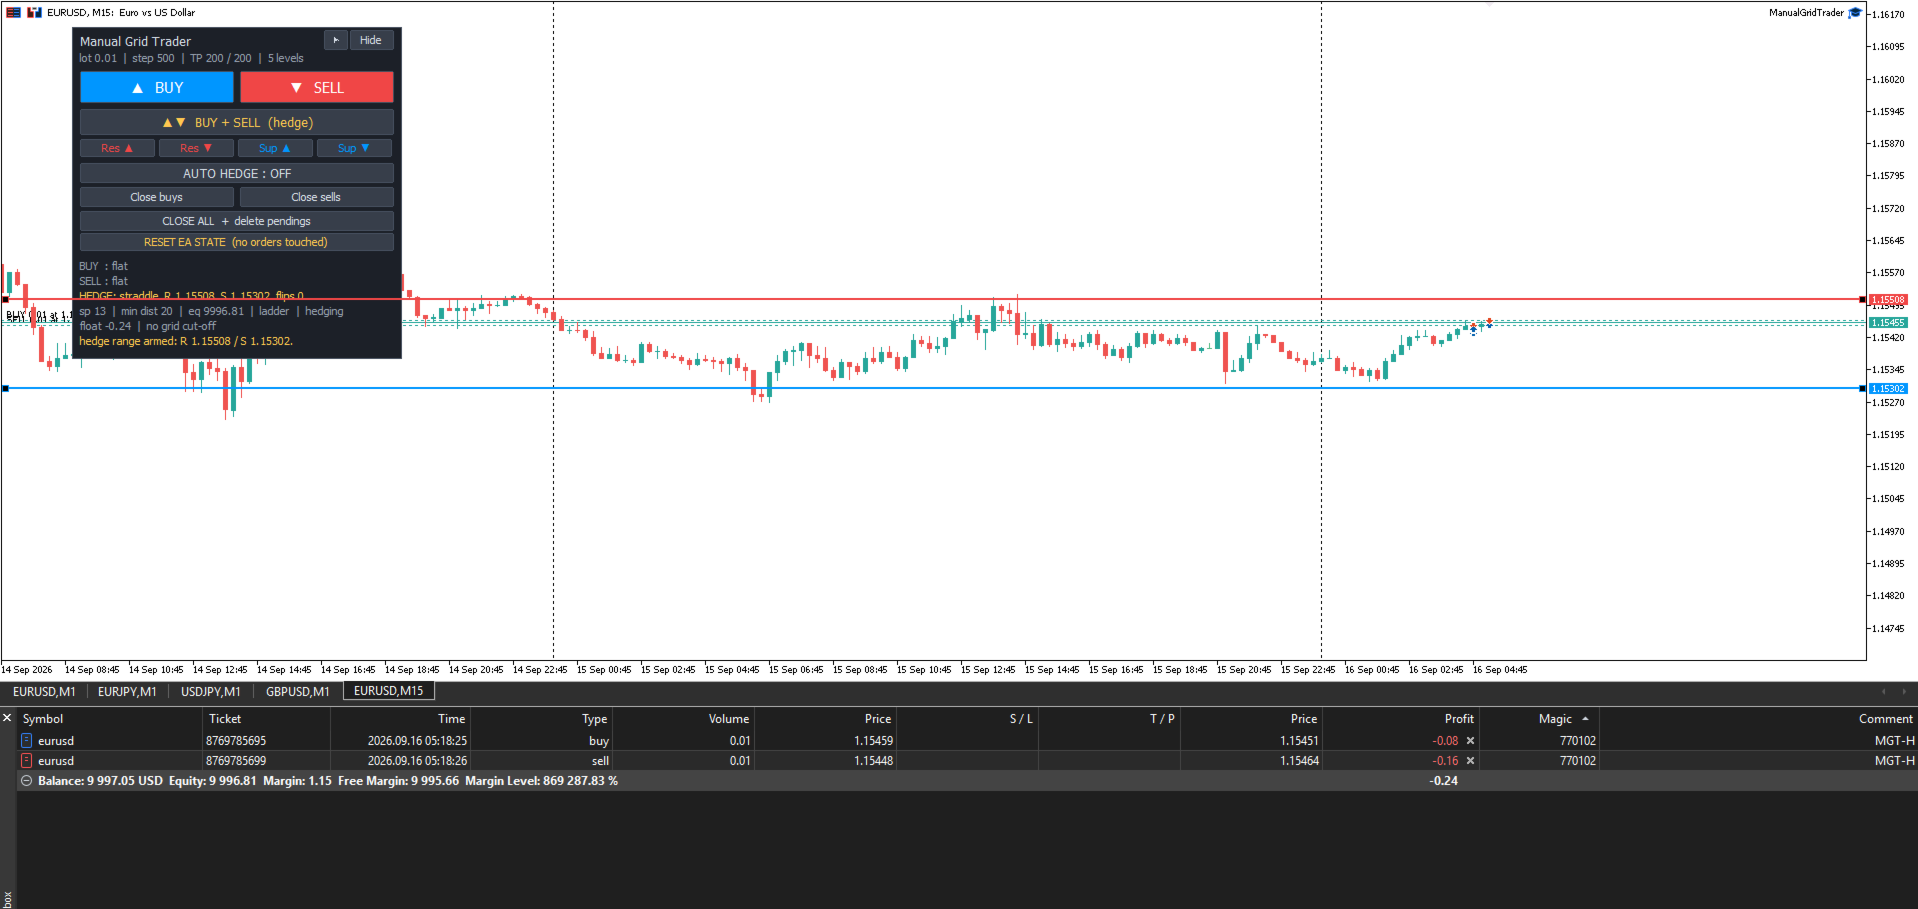
- BUY + SELL opens a buy and a sell together and draws a resistance line above price and a support line below it. Drag the lines to your own levels, or move them step by step with the line buttons.
- When price reaches the resistance, the sell is closed, another buy is added, and the buy basket gets a take profit from its average price. At the support it does the opposite.
- Auto hedge starts a new cycle after each one closes and places the lines at the same distances you last set. It stays on until you press the button again, reach the cycle limit or hit the daily stop.
- Hedge trades use their own magic number, so the grid and the hedge mode never manage each other's positions.
Risk controls
- Close all grid trades at a floating loss or a floating profit in account currency.
- Close only the buy side or only the sell side at a floating loss or profit.
- Daily stop: at a total floating loss of grid and hedge trades, everything is closed and new entries are blocked until the next trading day.
- Maximum spread for new entries.
- Before every order the panel checks free margin, the symbol's volume limit and the account's pending order limit. When an order cannot be placed, the reason is shown on the panel.
- Take profits and pending orders respect the broker's minimum distance. A distance that is too close is moved out to the minimum.
On the chart
- Panel with BUY, SELL, BUY + SELL, auto hedge, close buys, close sells, close all and reset buttons.
- Two small buttons in its top row move the panel between the left and right corners, and shrink it to the BUY and SELL buttons alone when you want the chart clear. Both choices are kept when you change the timeframe.
- A status line for each basket: positions, volume, average price, take profit and floating profit or loss.
- A dotted line at each basket's average price and a solid line at its take profit.
Parameters
- Grid: lot size, lot multiplier, distance between levels, number of levels, and whether further levels are limit orders, market orders, or switched off for single orders.
- Take profit and stop loss: distance with one entry, distance from the average price with two or more entries, a stop loss in points for every order, and whether the two chart lines are used as the exits.
- Money limits: grid floating loss and profit, loss and profit per side, daily stop.
- Broker limits: minimum distance, take profit adjustment, maximum spread.
- Orders: magic number, slippage when opening and closing, pending order cleanup, order comment.
- Hedge mode and auto hedge: leg lot, added lot, line distance, take profit, repeat switching, line step, pause between cycles, cycle limit.
- Panel: corner, position, average price and take profit lines. Log: detailed log on or off.
Notes
- Works on any symbol and timeframe. All distances are in points.
- Hedge mode, and running a buy and a sell basket at the same time, need a hedging account. On a netting account the panel blocks them and says why.
- To use it on two charts of the same symbol, give each chart a different magic number.
- In the Strategy Tester, choose visual mode and press the buttons. Without visual mode it opens a buy or a sell grid by itself whenever it has had no trades for an hour, so the test still shows how the baskets are managed.
- Algo trading must be enabled in the terminal.