ED Market Structure Dashboard
- インディケータ
- バージョン: 1.2

ED Multi Timeframe BOS CHOCH Dashboard
ED Multi Timeframe BOS CHOCH Dashboard is a market structure indicator designed to give traders a clear view of market direction across multiple timeframes from one chart.
Instead of constantly switching between charts, the dashboard helps you monitor Break of Structure (BOS), Change of Character (CHOCH), Swing Highs (SH), and Swing Lows (SL) across multiple timeframes.
The indicator is designed to help traders understand whether market structure is currently supporting a bullish or bearish bias and where important structural changes are taking place.
Key Features
- Multi-Timeframe Market Structure
- Detects BOS – Break of Structure
- Detects CHOCH – Change of Character
- Identifies Swing Highs (SH)
- Identifies Swing Lows (SL)
- Displays higher-timeframe structure on lower-timeframe charts
- Clear bullish and bearish structure indications
- Multi-timeframe dashboard for quick market analysis
- Helps identify potential changes in market direction
- Reduces the need to constantly switch between timeframes
- Clean chart display designed for everyday trading analysis
Multi-Timeframe Analysis
The dashboard allows traders to compare structure across several timeframes at the same time.
This can help answer important questions such as:
Is the lower timeframe moving with or against the higher-timeframe structure?
Has market structure recently changed from bullish to bearish?
Are multiple timeframes showing BOS in the same direction?
Has a CHOCH appeared that may indicate an early structural shift?
This makes the indicator useful for traders who use market structure, price action, trend analysis, liquidity concepts, or Smart Money Concepts (SMC) as part of their trading approach.
BOS and CHOCH
BOS (Break of Structure) highlights when price breaks an established structural level and may indicate continuation of the current market structure.
CHOCH (Change of Character) highlights a structural change that may indicate the market is beginning to shift direction.
The indicator also tracks Swing High and Swing Low levels, giving additional context around where structural breaks are occurring.
Dashboard
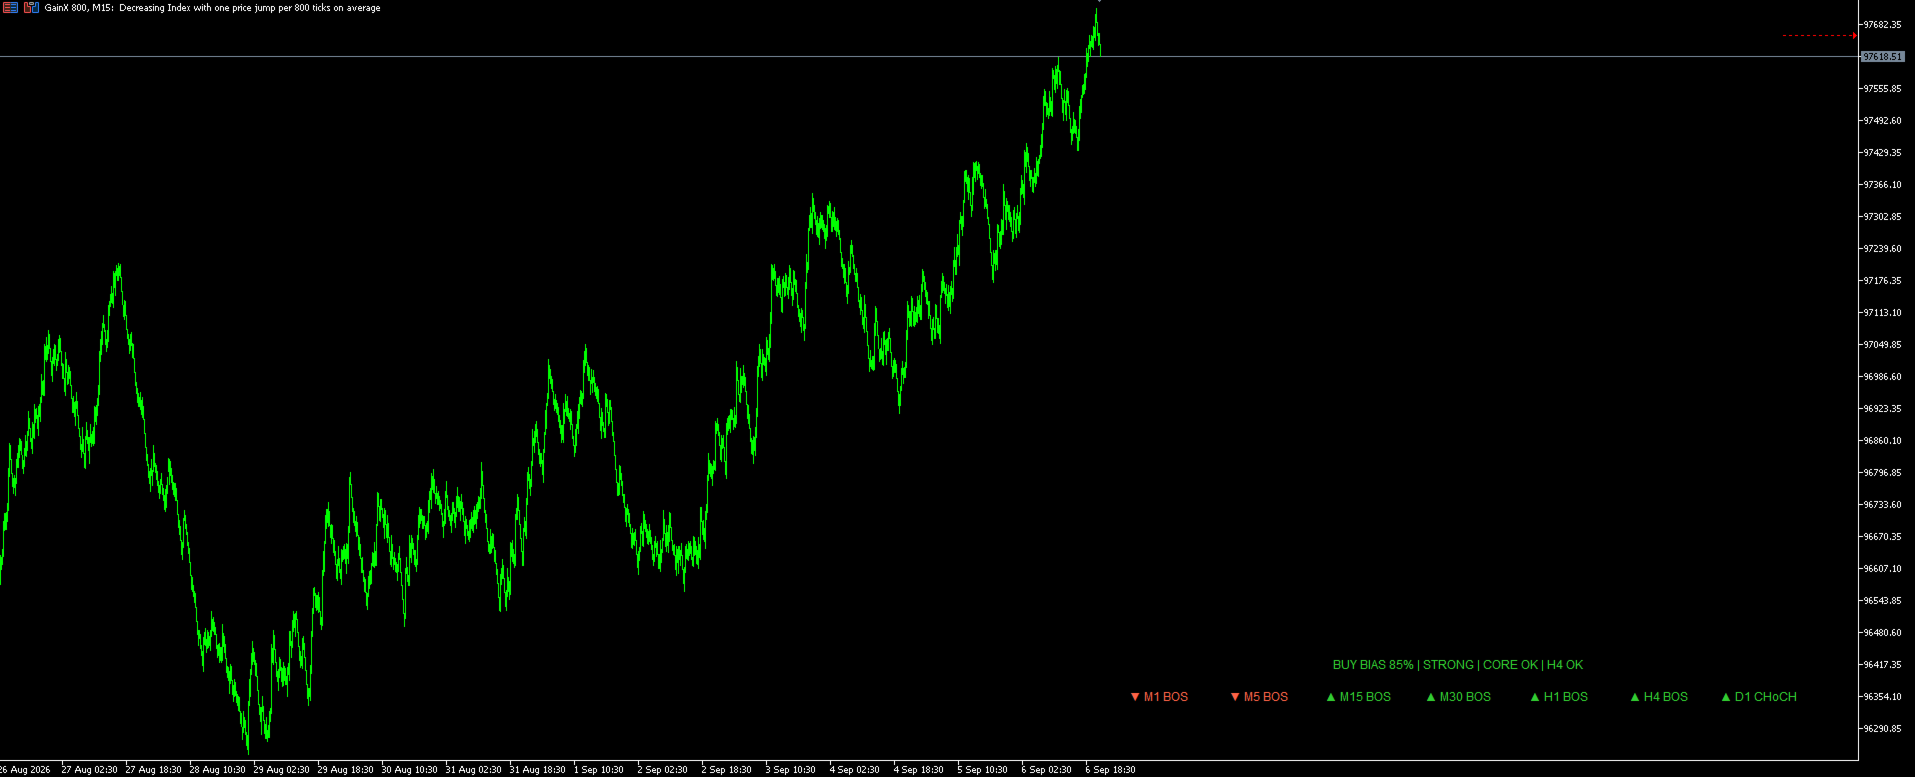
The integrated dashboard provides a quick overview of market structure across multiple timeframes.
This allows traders to see whether different timeframes are aligned or conflicting without having to manually analyse every chart individually.
It can be used as an additional confirmation tool alongside your own trading strategy, including support and resistance, order blocks, fair value gaps, liquidity, RSI, moving averages, or other technical analysis methods.
Designed for Clearer Market Structure
ED Multi Timeframe BOS CHOCH Dashboard does not automatically open or manage trades. It is an analytical tool designed to help traders interpret market structure and make their own trading decisions.
Trade with structure, not emotion.
EJR Trading Tools