Faradenza

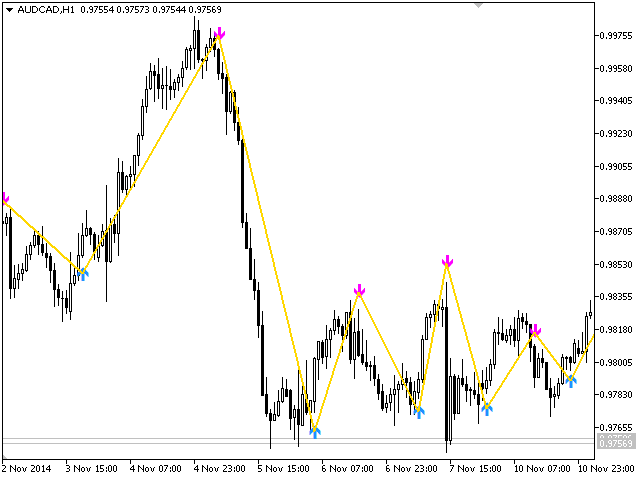
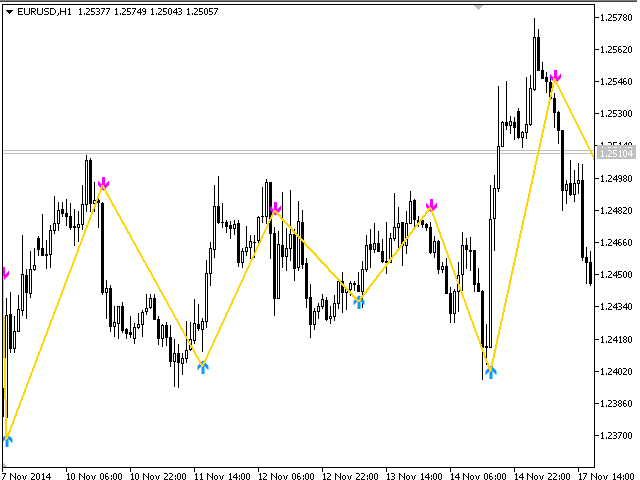
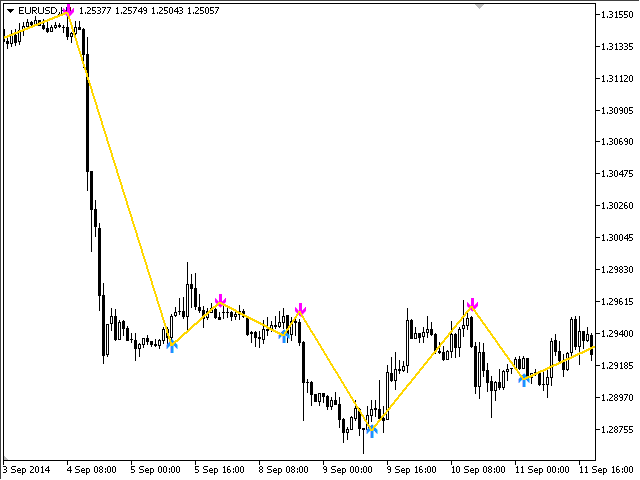
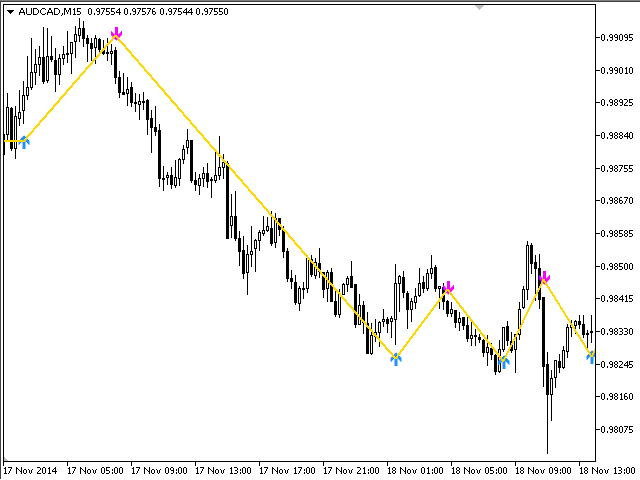
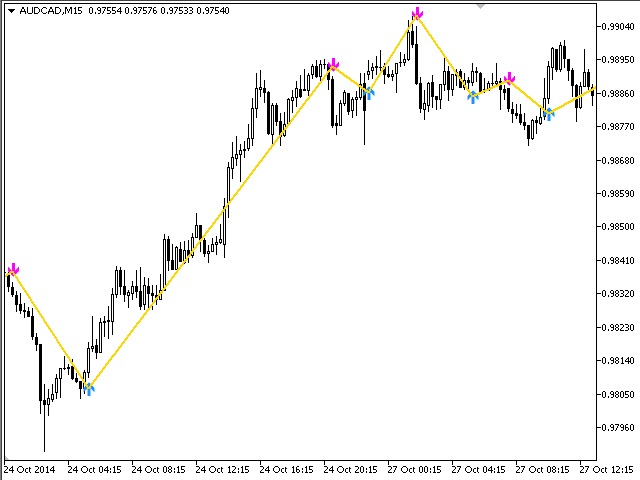
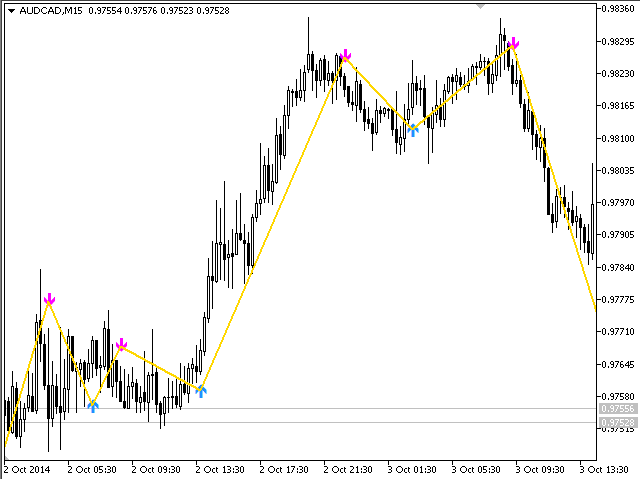
The main application of the Faradenza indicator is to generate buy and sell signals. The indicator tracks the market trend with unrivaled reliability, ignoring sharp market fluctuations and noise around the average price. Determining the market trend is an important task for traders. The Faradenza indicator implements an advanced algorithm for visualizing the market trend. It catches the trend and shows favorable moments of entering the market with arrows. The main purpose of the indicator is to assess the market. With this indicator, you can predict future values. The indicator is designed to determine either a trend or short-term buy or sell signals. The indicator will protect your open position on any timeframe and currency pair. The indicator can be used both for pipsing on small periods and for long-term trading. The indicator implements a kind of technical analysis based on the idea that the market is cyclical in nature.
おすすめのプロダクト
RBreaker Gold Indicatorsは、金先物の短期日内取引戦略であり、トレンドフォローと日内反転の2つの取引手法を組み合わせたものです。トレンド相場での利益を捉えるだけでなく、相場が反転した際には迅速に利確し、その流れに沿ってポジションを反転させることができます。 この戦略は、アメリカの雑誌『Futures Truth』において、15年連続で最も収益性の高い取引戦略トップ10に選ばれた実績を持ち、非常に長いライフサイクルを誇り、現在も国内外で広く使用・研究されています。 本インディケーターは、2026年の金先物の値動きに対応し、14日間のATR指標に基づいて、ブレイクアウト係数A、観察係数B、リバーサル係数Rをより合理的な値で定義しています。非常に優れたインディケーターであり、安定的な年間収益を実現しています。ぜひおすすめします〜
The Antique Trend Indicator is a revolutionary trend trading and filtering solution with all the important features of a trend tool built into one tool! The Antique Trend indicator is good for any trader, suitable for any trader both for Forex and binary options. There is no need to configure anything, everything has been perfected by time and experience, it works great during flats and trends. The Antique Trend indicator is a tool for technical analysis of financial markets, reflecting curren
Visual Wave Indicator
AL MOOSAWI ABDULLAH JAFFER BAQER
Visual Waves Indicator: Ride the Trend with Clarity Unlock a smarter way to trade with the Visual Waves Indicator, a sophisticated tool designed to provide clearer, more reliable trend signals on the MetaTrader 4 platform. Are you tired of the false signals and market noise generated by traditional moving averages? The Visual Waves Indicator is your solution. It moves beyond basic calculations to offer a truly adaptive analysis of market momentum, helping you identify trading opportunities with
Bollinger Trend Lines – MT4 & MT5 Bollinger Trend Lines is a professional volatility-based trend indicator designed to clearly identify trend direction and dynamic stop levels using Bollinger Bands. Fuses on one core principle: follow the trend, ignore noise, and let volatility define the stop. How it works The indicator builds trailing trend lines using Bollinger Bands: In an uptrend , the lower band trails price and can only rise In a downtrend , the upper band trails price and can only
SPECIAL LAUNCH OFFER: $30 (1-Month Rent) Limited time offer to build our community and gather feedback! AmbM GOLD Institutional Scalper A high-precision M5 algorithm for XAUUSD (Gold) , engineered to trade exclusively at Institutional Liquidity Levels ($5/$10 psychological marks). PERFORMANCE DATA (BUY ONLY) • Win Rate: 87.09%. • Safe Growth: +$4,113 profit on $10k (13.75% Max Drawdown). • Extreme Stress Test: Successfully generated +$22,997 in a 5-year stress test (2020-2026), proving
The ZigZag Buy Level is a specialized tool for traders who utilize market structure and classic ZigZag patterns to define key support and entry points. It automatically identifies "Main Highs"—significant highs confirmed by the subsequent price action—and then calculates a high-probability "Buy Level" based on a specified percentage pullback from that Main High to the last corrective low. This indicator helps you anticipate deep retracement entries, clearly marking them on the chart with labels
First time on MetaTrader, introducing IQ Star Lines - an original Vedic Astrology based indicator. "Millionaires don't use astrology, billionaires do" . - J.P. Morgan, Legendary American financier and banker. IQ Star Lines, an unique astrological indicator purely based on   Vedic astrology   calculations, published for the   first time on Metatrader.  This unique tool plots dynamic planetary grid lines based on real-time stars, constellations, and celestial movements, which allows you to plot t
Nrha
Ratna Purwantari
This indicator uses Fibonacci to determine your trading levels precisely and measurably. It helps you to earn big profits. This indicator can also be used for various currency charts. You can also combine it with other indicators that you like so that the profits you get are also even greater. I hope you give me input so that this indicator can be better. We recommend using for the period M1 to M15. feel free to discuss with me. Thanks. 
STRICTLY FOR BOOM INDEX ONLY!!!!! Here I bring the Maximum Trend Arrows OT1.0 MT5 indicator. This indicator is made up of a combination of different trend indicators for entries and exits, for entries an orange arrow will paint on the chart below the current market and a red flag for closing of trades and it produces buy arrows only. When the orange arrow appears, it will appear along with it's sound to notify you. The 1H timeframe is recommended, don't use it anywhere else than on the 1H timefr
Trend based indicator Identify trends with this indicator A simple-to-use trend indicator No complicated settings Attributes: Can be used in all symbols Can be used in all time frames Relatively high signals No complicated settings Specific to the trend Lifetime support Settings: Alarm Show Alert: By activating these settings, after receiving the signal, you will receive an alarm in Metatrader Alarm Show Notification: By activating these settings, after receiving the signal, you will receive a
Hello My Dear Friend, im introduce about Binary Option Premium V8 it work, all currency pair 1 minute time frame, 1-5 minute expire 100% non repaint, no delay signal Alright. This indicator works on MT5 and is very easy to use. When you receive a signal from it, you wait for that candle with the signal to close and you enter your trade at the beginning of the next new candle. A red arrow means sell and a green arrow means buy. for easy identification of trade signal. Are you okay with that?  W
The indicator detects divergence signals - the divergences between the price peaks and the MACD oscillator values. The signals are displayed as arrows in the additional window and are maintained by the messages in a pop-up window, e-mails and push-notifications. The conditions which formed the signal are displayed by lines on the chart and in the indicator window. The indicator parameters MacdFast - fast MACD line period MacdSlow - slow MACD line period MacdSignal - MACD signal line period Macd
Caicai L&S Yield Histogram Important Notice: This indicator is an integral tool of the automated EA Caicai Long and Short Pair Trading . This indicator visually displays the percentage deviation (Yield %) of a pair's current spread relative to its own historical mean. It is an excellent tool for quickly visualizing the gross financial potential of a market distortion in Long & Short operations. Main Features: Percentage Visualization: Understand the size of the distortion in palpable percentage
# RSI Pro Alert - Advanced RSI Indicator A powerful professional-grade RSI indicator with intelligent alerts, scheduled snapshots, and multi-dimensional notifications to help you capture market opportunities with precision! --- ## Key Features ### Smart Signal Detection - **Precision Cross Detection** : Automatically identifies critical moments when RSI crosses overbought/oversold levels - **State Tracking Mechanism** : Real-time monitoring of market state changes (Overbought/Overso
KasTon Trend System: The Complete 2-in-1 Trading Strategy Identify the Trend, Confirm the Signal, and Trade with Confidence! Do you suffer from confusion while trading? Do you find it difficult to determine the market's direction? Are you tired of losing money on false signals? The KasTon Trend System is here as an integrated solution to all these problems. This is not just an indicator; it is a complete trading strategy built on the synergy of two powerful, custom-built indicators. Our main g
This indicator can be considered as a trading system. It offers a different view to see the currency pair: full timeless indicator, can be used for manual trading or for automatized trading with some expert advisor. When the price reaches a threshold a new block is created according to the set mode. The indicator beside the Renko bars, shows also 3 moving averages. Features renko mode median renko custom median renko 3 moving averages wicks datetime indicator for each block custom notification
Boom Kerdoskopos Indicator – Sell With Confidence The Boom Kerdoskopos Indicator is a scalper’s dream for Boom markets on M1 timeframe . Built to protect you from spikes, it gives precise yellow down arrows for sell entries and red cross exit signals so you always know when to enter and leave the trade. With smart alerts (audible, push, email), you can trade stress-free and secure 8–10 safe candles every time. It’s perfect for scalpers who want fast, consistent profits. Why Traders Choose
Commercial Description – Marubozu Pro (MT5) Description Marubozu Pro is a professional indicator for MetaTrader 5 that automatically detects Marubozu candles (bullish and bearish) directly on your chart. It helps traders identify strong market momentum where buyers or sellers take full control, by displaying clear visual arrows for buy and sell signals. This tool is designed to be simple, effective, and fast , perfect for manual trading or as a filter in automated strategies. Key Features
Gecko EA MT5
Profalgo Limited
5 (1)
NEW PROMO: Only a few copies copies available at 349$ Next price: 449$ Make sure to check out our " Ultimate EA combo package " in our   promo blog ! Gecko runs a simple, yet very effective, proven strategy.  It looks for important recent support and resistance levels and will trade the breakouts.  This is a "real" trading system, which means it will use a SL to protect the account.  It also means it will not use any dangerous techniques like martingale, grid or averaging down. The EA shows its
MT5用のMarket Structure Break Outを紹介します – プロフェッショナルなMSBおよびUnbroken Zoneインジケーター。 MT4バージョンも利用可能です。こちらをご覧ください: https ://www .mql5 .com /en /market /product /109958 このインジケーターは継続的に更新されています。 私たちは、マーケット構造に基づいた非常に正確なエントリーおよびエグジットポイントを提供することに尽力しています。現在バージョン1.1に達しており、今ご参加いただければ以下の最新の変更が含まれます: 買いと売りのターゲット:   買いと売りのポジションに対して最適な利益確定レベルに関する明確な情報を取得できます。 最新のMSB方向:   最も最近のMarket Structure Breakoutの方向を表示して、より良い意思決定をサポートします。 改良されたビジュアルモード:   ライト、ダーク、またはカスタムテーマに合わせてチャートをカスタマイズできます。 ライブテストの切り替え:   新しいオンスクリーンボタンで、ライブ
Range Directional Force Indicator – Designed for You to Optimize! The Range Directional Force Indicator is a cutting-edge tool designed to empower traders by visualizing market dynamics and directional strength. Built to offer insights into market trends and reversals, this indicator is an invaluable asset for traders seeking precision in their strategies. However, it is important to note that this indicator is not optimized, leaving room for you to tailor it to your unique trading preferences.
Tma Poc Gold
Ignacio Agustin Mene Franco
POC + TMA SCALPER GOLD - Expert Advisor Professional DESCRIPTION: Automated trading system designed specifically for XAU/USD, combining Point of Control (POC) with Triangular Moving Average (TMA) to identify high-volume and trending zones. It uses advanced risk management with dynamic trailing stops and an intelligent grid system. TECHNICA
MACD SMA Pro Trend Signal MT5 は、トレンド分析、モメンタム確認、および構造的フィルタリングを融合させ、高確率なエントリーポイントを特定するために設計されたプロ仕様のトレーディング指標です。 洗練された MACD + マルチ SMA 戦略に基づき、このツールは従来の指標の枠を超え、 トレンドの方向性、モメンタムの変化、価格構造、および確認ロジック を一つのクリーンで強力なシステムに統合しています。 ノイズが多く遅行しがちな標準的な指標とは異なり、本システムは弱いセットアップを排除し、 高品質なブレイクアウトとリバーサルの機会 のみに焦点を当てます。トレンドの方向を視覚的に強調し、モメンタムの変化を検出し、多層的な条件を用いてエントリーを確定させます。 下位足での素早いスキャルピングでも、スイングポジションの保持でも、この指標はあなたのトレードスタイルに適応し、 明確で実行可能なシグナル を提供します。 憶測は不要 チャートを汚さない クリーンでスマートな売買シグナル 4. 主な機能 多層 SMA ロジックを用いた高度な トレンド検出 正確
Theoretical Foundation   The Keltner Channels are channels ploted using volatility deviations above and bellow a moving average. The indicator is an excellent tool to help the trader build trend and mean-reversion strategies.   Parameters   The Orion Dynamic Keltner allows the user to select the Volatility Calculation Type, being ATR or Average Range (not considering price gaps). Also, the user can select the Calculation Period, Number of Deviations, Moving Average Mode and the Moving Average Ca
Introducing to your attention the unique trading system/indicator "Scaled Vidya Trends", designed for dynamic scalp trading on trend volatility pairs hour + timeframes. Main features of Scaled Vidya Trends: -Multi-level market analysis: it works on H1, H2, H3 timeframes; -Uses the most popular currency pairs: EURUSD, GBPUSD, USDCAD. Brokers usually set one of the lowest spreads for these pairs; -Applies a scalping method based on local targets for signals; -Signals appears at the new open of
Full Description Overview Drawdown Controller Calculator Indicator is an advanced professional risk-management tool for MetaTrader 5 , specially designed for traders who use multiple running trades, pending orders, grid systems, and martingale strategies . This indicator allows you to see the future drawdown in advance — not only for currently running trades, but also for all pending orders combined , assuming they get triggered step by step. Instead of guessing or hoping, you will know ex
FREE
Manyal trading system, CovEchoTrend Robot, focuses on reliability and flexibility. By employing statistical analysis methods to study the relationships between the base indicator and market patterns, the system enables a deeper understanding of market processes. Intelligent pattern analysis: The application of statistical data processing helps identify key trend reversal points more accurately, signaling significant market shifts. Informed decision-making is based on the intersection of indicato
Alpha One MT5 - 高度なトレンド検出システム Alpha Oneは、明確な買い・売りシグナルを提供し、自動エントリー、ストップロス、3段階のテイクプロフィットレベルをチャート上に直接描画するプロフェッショナルなトレンドフォロー指標です。 本指標は、リアルタイムのトレンド強度と方向性を反映するため緑と赤に変化する15本の動的ラインで構成される独自の「エネルギーフィールド」可視化機能を備えています。緑のエネルギーは強気の優位性を、赤のエネルギーは弱気の圧力を示し、市場の勢いを瞬時に視覚的に把握できます。 シグナルシステム シグナルは、複数の独立した分析次元における勢いの変化を分析する多層確認プロセスを通じて生成されます。各シグナルは、チャートに表示される前に複数のコンポーネントによる合意が必要です。 再描画なし保証 全てのシグナルは確定済みクローズバーのみに基づいて算出されます。一度表示されたシグナルは移動・変更・消失することはありません。過去データに表示される内容は、リアルタイムで実際に発生したものと完全に一致します。バックテスト結果はライブパフォーマンスと一致しま
Ultimate Boom and Crash Indicator The Ultimate Boom and Crash Indicator is a cutting-edge tool developed by  Coetsee Digital , designed to identify potential spike opportunities in the market. Crafted for traders focusing on Deriv and Weltrade synthetic markets, this indicator is optimized to operate exclusively on the 3-minute (M3), 5-minute (M5), 15-minute (M15), 30-minute (M30), and 1-hour (H1) timeframes and supports only the following pairs: PainX 1200, PainX 999, PainX 800, PainX 600, Pai
ATrend
Zaha Feiz
4.83 (18)
ATrend: その仕組みと使い方 仕組み MT5プラットフォーム向けの「ATREND」インジケーターは、テクニカル分析手法の組み合わせを利用して、トレーダーに堅牢な買いと売りのシグナルを提供するように設計されています。このインジケーターは主に、ボラティリティ測定のために平均真の範囲(ATR)を活用し、潜在的な市場動向を特定するためのトレンド検出アルゴリズムを併用しています。 購入後にメッセージを残すと、特別なボーナスギフトが贈呈されます。 主な特徴: - ダイナミックなトレンド検出: インジケーターは市場トレンドを評価し、シグナルを適宜調整することで、トレーダーが優位な市場環境に合わせて戦略を立てるのを支援します。     - ボラティリティ測定: ATRを使用することで、インジケーターは最適なストップロス(SL)とテイクプロフィット(TP)レベルを決定するために不可欠な市場ボラティリティを測定します。 - シグナルの視覚化: インジケーターは、チャート上に買いと売りのシグナルを視覚的に表示することで、トレーダーの意思決定を強化します。 操作手順 入力とセッティング - TimeF
このプロダクトを購入した人は以下も購入しています
このインジケーターを購入された方には、以下の特典を 無料 で提供しています: 各トレードを自動で管理し、ストップロスとテイクプロフィットを設定し、戦略ルールに基づいてポジションを決済する補助ツール 「Bomber Utility」 様々な銘柄に合わせたインジケーターの設定ファイル(セットファイル) 「最小リスク」、「バランスリスク」、「待機戦略」 の3つのモードで使用できる Bomber Utility 用の設定ファイル このトレーディング戦略をすぐに導入・設定・開始できる ステップバイステップのビデオマニュアル ご注意: 上記の特典を受け取るには、MQL5のプライベートメッセージシステムを通じて販売者にご連絡ください。 オリジナルのカスタムインジケーター 「Divergence Bomber(ダイバージェンス・ボンバー)」 をご紹介します。これは、MACDのダイバージェンス(乖離)戦略に基づいた 「オールインワン」型のトレーディングシステム です。 このテクニカルインジケーターの主な目的は、価格とMACDインジケーターの間に発生するダイバージェンスを検出 し、将来の価格の動きを示す
優れたテクニカルインジケーター「Grabber」をご紹介します。これは、すぐに使える「オールインワン」トレーディング戦略として機能します。 ひとつのコードに、市場のテクニカル分析ツール、取引シグナル(矢印)、アラート機能、プッシュ通知が強力に統合されています。 このインジケーターを購入された方には、以下の特典を無料で提供します: Grabberユーティリティ:オープンポジションを自動で管理するツール ステップバイステップのビデオマニュアル:インジケーターのインストール、設定、取引方法を解説 カスタムセットファイル:インジケーターをすばやく自動設定し、最大限の成果を出すための設定ファイル 他の戦略はもう忘れてください!Grabberだけが、あなたを新たなトレードの高みへと導いてくれるのです。 Grabber戦略の主な特徴: 推奨タイムフレーム:M5〜H4 対応通貨ペア・資産:どれでも使用可能ですが、私が実際に検証した以下を推奨します(GBPUSD、GBPCAD、GBPCHF、AUDCAD、AUDUSD、AUDSGD、AUDCHF、NZDUSD、NZDCAD、EURCAD、EURUSD、E
SignalTech MT5 is a trading system for EURUSD, USDCHF, USDJPY, AUDUSD, NZDUSD, EURJPY, AUDJPY, NZDJPY, CADJPY H2 and H3 Timeframe.  It can generate signals with Buy/Sell Arrows and Pop-Up/Sound Alerts. Each signal has clear Entry and Stop Loss levels, which should be automatically flagged on the chart, as well as potential Targets 1, 2, and 3. The Entry and TP levels are fixed after the trade is taken. The exit level is dynamic. If there are signs of a potential short-term trend reversal, the
トレンド スクリーナー インジケーターでトレンド取引の力を解き放ちます。ファジー ロジックと複数通貨システムを活用した究極のトレンド取引ソリューションです。 ファジー ロジックを活用した革新的なトレンド インジケーターである Trend Screener を使用して、トレンド取引を向上させます。 これは、13 を超えるプレミアム ツールと機能、および 3 つの取引戦略を組み合わせた強力なトレンド追跡インジケーターであり、Metatrader をトレンド アナライザーにする多用途の選択肢となります。 期間限定オファー : トレンド スクリーナー インジケーターは、わずか 100 ドルで生涯ご利用いただけます。 (元の価格 50$ ) (オファー延長) Trend Screener の 100% 非再描画精度の揺るぎない精度を体験して、取引の決定が過去の価格変動の影響を受けないようにしてください。 マルチタイムフレームおよびマルチ通貨機能の多用途性を解放し、比類のない自信を持って外国為替、商品、暗号通貨、インデックスの世界を取引できるようにします。 Trend Screener の包括的な
ご紹介     Quantum Breakout PRO は 、ブレイクアウト ゾーンの取引方法を変革する画期的な MQL5 インジケーターです。 13年以上の取引経験を持つ経験豊富なトレーダーのチームによって開発されました。     クォンタム ブレイクアウト プロ   は、革新的でダイナミックなブレイクアウト ゾーン戦略により、あなたのトレーディングの旅を新たな高みに押し上げるように設計されています。 クォンタム ブレイクアウト インジケーターは、5 つの利益ターゲット ゾーンを備えたブレイクアウト ゾーン上のシグナル矢印と、ブレイクアウト ボックスに基づいたストップロスの提案を提供します。 初心者トレーダーにもプロのトレーダーにも適しています。 量子EAチャネル:       ここをクリック 重要!購入後、インストールマニュアルを受け取るためにプライベートメッセージを送ってください。 推奨事項: 時間枠: M15 通貨ペア: GBPJPY、EURJPY、USDJPY、NZDUSD、XAUUSD アカウントの種類: ECN、Raw、またはスプレッドが非常に低い R
これはMT5のインジケーターで、再描画なしで取引に参入するための正確なシグナルを提供します。 外国為替、暗号通貨、金属、株式、インデックスなど、あらゆる金融資産に適用できます。かなり正確な見積もりを提供し、取引を開始して終了するのに最適な時期を教えてくれます。1つのシグナルを処理しただけでインジケーターの元が取れた例の 動画 (6:22)をご覧ください。Entry PointsPro インジケーターの助けを借りたほとんどのトレーダーの最初の1週間の結果が改善しています。 Telegramグループ に登録してください。Entry Points Proインジケーターのメリットは次の通りです。 再描画のないエントリーシグナル 再描画されるインジケーターでは一度表示されたシグナルが削除されて大きな金銭的損失につながることがありますが、これと異なり、表示されて確認されたシグナルは消えることがありません。 エラーなしの取引開始 インジケーターアルゴリズムによって取引を開始する(資産を売買する)理想的な瞬間を見つけることができます。それを使用するすべてのトレーダーの成功率が向上します。 あら
Quantum TrendPulse を ご紹介します。これは、   SuperTrend   、   RSI   、および Stochastic のパワーを 1 つの包括的なインジケーターに組み合わせて、取引の可能性を最大限に引き出す究極の取引ツールです。精度と効率を求めるトレーダー向けに設計されたこのインジケーターは、市場のトレンド、勢いの変化、最適なエントリー ポイントとエグジット ポイントを自信を持って特定するのに役立ちます。 主な特徴: SuperTrend 統合: 現在の市場動向に簡単に追従し、収益性の波に乗ることができます。 RSI精度: 買われすぎと売られすぎのレベルを検出し、市場の反転のタイミングに最適で、SuperTrendのフィルターとして使用されます。 確率的精度: 確率的振動を活用して、変動の激しい市場で隠れたチャンスを見つけます。SuperTrend のフィルターとして使用されます。 マルチタイムフレーム分析:   M5 から H1 または H4 まで、さまざまなタイムフレームで市場を常に把握します。 カスタマイズ可能なアラート: カスタム取引条件が満たされ
Azimuth Pro
Ottaviano De Cicco
5 (7)
Azimuth Pro V2:MT5向けシンセティック・フラクタル構造分析と確認済みエントリー 概要 Azimuth Pro は Merkava Labs によるマルチレベルスイング構造インジケーターです。4つのネストされたスイングレイヤー、スイングアンカーVWAP、ABCパターン検出、3タイムフレーム構造フィルタリング、そして確定バーでの確認済みエントリー — 1つのチャートで、ミクロスイングからマクロサイクルまでを網羅するワークフロー。 これはブラインドシグナル製品ではありません。ロケーション、コンテキスト、タイミングを重視するトレーダーのための構造ファーストワークフローです。 V2発売記念オファー — Azimuth Pro V2をUSD 399で(次の100本)。最終価格:USD 499。 1. V2での変更点 シンセティック・マルチタイムフレームエンジン 上位タイムフレーム分析をMeridian Proと同じ独自のシンセティックアーキテクチャで一から再構築。よりクリーンなHTFコンテキスト、安定したライブ動作、従来のMTF同期問題なし。シンセティックエンジンは 固定比率タ
マーケットメーカーのためのツール。 Meravith は次の機能を提供します: すべての時間足を分析し、現在有効なトレンドを表示します。 強気と弱気の出来高が等しくなる流動性ゾーン(出来高均衡)を強調表示します。 異なる時間足のすべての流動性レベルをチャート上に直接表示します。 テキスト形式の市場分析を生成し、参考情報として表示します。 現在のトレンドに基づいて目標値、サポートレベル、ストップロスを計算します。 取引のリスクリワード比を算出します。 口座残高に基づいてポジションサイズを計算し、潜在的な利益を推定します。 また、市場に大きな変化があった場合には警告を表示します。 インジケーターの主要ライン: 強気/弱気の出来高エグゾーストライン ― 目標値として機能します。 市場のトレンドを示すライン。市場が強気か弱気かによって色が変わり、トレンドのサポートとして機能します。主にその色が市場センチメントを示します。 出来高均衡ライン(Eq)。Eq(Volume Equilibrium)ラインはシステムの中核です。これは買い手と売り手の出来高のバランスポイントを表します。市場の流動性を示し
BTMM State Engine Pro is a MetaTrader 5 indicator for traders who use the Beat The Market Maker approach: Asian session context, kill zone timing, level progression, peak formation detection, and a multi-pair scanner from a single chart. It combines cycle state logic with a built-in scanner dashboard so you do not need the same tool on many charts at once. What it does Draws the Asian session range; session times can follow broker server offset or be set in inputs. Tracks level progression (L
OmniSync Projection
Antonio-alin Teculescu
5 (1)
Chronos Fractal Engine is an innovative price projection indicator for MetaTrader 5, designed to transform your technical analysis by intelligently identifying and projecting historical price patterns. Built upon an advanced correlation algorithm and the fractal principles of the market, this powerful tool visualizes potential future price movements, giving you a unique edge in your trading decisions. What is Chronos Fractal Engine? At its core, the Chronos Fractal Engine employs a sophisticat
RelicusRoad Pro: 定量的市場オペレーティングシステム 【期間限定】無制限アクセス 70% OFF - 2,000人超のトレーダーと共に なぜ多くのトレーダーは「完璧な」インジケーターを使っても失敗するのでしょうか? それは、文脈を無視して 単一の概念 だけでトレードしているからです。文脈のないシグナルは単なるギャンブルです。勝ち続けるには、 根拠の重なり(コンフルエンス) が必要です。 RelicusRoad Proは単なる矢印インジケーターではありません。完全な 定量的市場エコシステム です。独自のボラティリティモデリングを用いて、価格が推移する「適正価値の道(Fair Value Road)」をマッピングし、ノイズと真の構造的ブレイクを判別します。 推測はやめましょう。機関投資家レベルの「ロード・ロジック」でトレードを。 コアエンジン:「Road」アルゴリズム システムの中心となる Road Algo は、市場環境にリアルタイムで適応するダイナミックなボラティリティチャネルです。 安全ライン(平衡点) と、価格が数学的に反転しやすい 拡張レベル を投影します。 Si
Bill Williams Advanced is designed for automatic chart analysis using Bill Williams' "Profitunity" system. The indicator analyzes four timeframes at once. Manual (Be sure to read before purchasing) Advantages 1. Analyzes the chart using Bill Williams' "Profitunity" system. Signals are displayed in a table in the corner of the screen and on the price chart. 2. Finds all known AO and AC signals, as well as zone signals. Equipped with a trend filter based on the Alligator. 3. Finds "Divergence Bar
ARICoin is a powerful trading companion designed to generate high-probability entry signals with dynamic TP/SL/DP levels based on volatility. Built-in performance tracking shows win/loss stats, PP1/PP2 hits, and success rates all updated live. Key Features: Buy/Sell signals with adaptive volatility bands Real-time TP/SL/DP levels based on ATR Built-in MA Filter with optional ATR/StdDev volatility Performance stats panel (Success, Profit/Loss, PP1/PP2) Alerts via popup, sound, push, or email Cust
メタポイントプロ   これは、取引における推測を排除し、市場が既に決定を下したポイントを示すトレンドフォローツールです。この指標は、トレンド、動向、構造が変化する重要なポイントを特定し、主要プレーヤーがポジションを取るべき価格の戻り領域を強調表示します。 単に値動きを見るだけでなく、その背後にある論理を理解できます。すべてのシグナルはローソク足が確定した後に記録され、再描画されることなくチャート上に保存されるため、自信を持って状況を分析し、意思決定を行うことができます。トレード目標(利益確定)も表示されます。 この指標の有効性について完全に確信を持っていただくために、自動統計機能をご利用いただけます。 方向転換のたびに、インジケーターはストップロスレベルとそのインテリジェントな段階的移動(Move SL)も表示します。これは非常に重要です。     削減する   リスク   ポジション別。 損切り/利益確定/リスクリワード 右側に内蔵されたパネルには、現在の世界的なトレンドの方向における市場参入ポイントが表示され、過去のデータからもこれらのシグナルが確認できます。 任意の時間枠/ツール
現在33%オフ 初心者にもエキスパートトレーダーにも最適なソリューション このインジケーターは独自の機能と新しい公式を多数内蔵しており、ユニークで高品質かつ手頃な取引ツールです。このアップデートでは、2つの時間枠ゾーンを表示できるようになります。より長いTFだけでなく、チャートTFとより長いTF(ネストゾーンを表示)の両方を表示できます。すべてのSupply Demandトレーダーの皆さんのお気に召すはずです。:) 重要情報の公開 Advanced Supply Demandの可能性を最大化するには、 https://www.mql5.com/ja/blogs/post/720245 にアクセスしてください。   エントリーまたはターゲットの正確なトリガーポイントを正確に特定できれば取引がどのように改善されるか想像してみてください。新しい基盤となるアルゴリズムに基づいて構築されているため、買い手と売り手の間の潜在的な不均衡をさらに簡単に特定できます。これは、最も強い需要と供給のゾーンと、過去のパフォーマンス(古いゾーンを表示)がグラフィカルに表現されるためです。これらの機能は、最適な
Gannスクエアインジケーターは、W.D. Gannによって執筆された「市場予測のための数学的な式」の記事に基づく強力な市場分析ツールです。このツールは、解析に数学的な概念を応用し、Gann理論に基づいています。それは、144、90、52のスクエアや9のスクエアなど、Gannの関連テクニックの要素を取り入れています。さらに、の方法を組み込んでおり、9のスクエアとその関連性についてのチャネルやスターパターンに焦点を当てています。 ユーザーマニュアルと使用方法: このインジケーターを使用する前に、ユーザーマニュアルを読んで疑問点を解決するためにお問い合わせいただくことをお勧めします。ユーザーマニュアルの完全版は、当社のウェブサイトで入手できます。 MT5の完全版は購入できますし、MT4の無料版も試すことができます。両方のバージョンへのリンクを提供していますので、ご利用ください。 主な機能と機能: Gannスクエアインジケーターは、市場分析のための完全なツールセットを提供し、幾何学的な概念とGann理論に基づいて的確な判断を行う手助けをします。以下に主な機能を示します。 9のスクエアの分析:
Cvd Divergence
Thalles Nascimento De Carvalho
CVD Divergence ― オーダーフローとダイバージェンスのプロフェッショナル分析 CVD Divergence は、価格と Cumulative Delta Volume(CVD)との間に発生する信頼性の高いダイバージェンスを検出するために開発されたテクニカル指標です。実際の注文フローが価格の動きを確認していない局面を正確に捉え、反転、勢いの減衰、そして機関投資家による操作の可能性を示します。 このインジケーターは、アグレッシブボリュームの読み取りと価格構造の分析を組み合わせ、明確で客観的かつ先行性のあるシグナルを提供します。 インジケーターの機能 CVD Divergence は、累積デルタボリュームを用いて注文フローの方向と価格の方向を比較します。両者が大きく乖離した際、チャート上にマーカーを表示し、ダイバージェンスの方向を視覚的に示します。 検出できる内容: 強気ダイバージェンス(価格が下落しているが CVD が上昇している場合) 弱気ダイバージェンス(価格が上昇しているが CVD が下降している場合) 買い手・売り手の勢いの枯渇 機関投資家の不均衡によるフェイクムーブ
Gartley Hunter Multi - An indicator for searching for harmonic patterns simultaneously on dozens of trading instruments and on all possible timeframes. Manual (Be sure to read before purchasing) | Version for MT4 Advantages 1. Patterns: Gartley, Butterfly, Shark, Crab. Bat, Alternate Bat, Deep Crab, Cypher 2. Simultaneous search for patterns on dozens of trading instruments and on all possible timeframes 3. Search for patterns of all possible sizes. From the smallest to the largest 4. All fou
「 Dynamic Scalper System MT5 」インジケーターは、トレンド波の中でスキャルピング取引を行う手法のために設計されています。 主要通貨ペアと金でテスト済みで、他の取引商品との互換性があります。 トレンドに沿った短期的なポジションオープンのシグナルを提供し、追加の価格変動サポートも提供します。 インジケーターの原理 大きな矢印はトレンドの方向を決定します。 トレンド波の中では、小さな矢印の形でスキャルピングシグナルを生成するアルゴリズムが機能します。 赤い矢印は強気方向、青い矢印は弱気方向です。 トレンドの方向には敏感な価格変動ラインが描かれ、小さな矢印のシグナルと連動します。 シグナルは次のように機能します。適切なタイミングでラインが現れるとエントリーシグナルが形成され、ラインが開いている間はポジションが保持され、完了すると取引が終了します。 推奨される動作時間枠はM1~H4です。 矢印は現在のローソク足に形成され、次のローソク足が開いている場合は、前のローソク足の矢印は再描画されません。 入力パラメータ Trend Wave Period - トレ
Presenting one-of-a-kind Gann Indicator for XAUUSD IQ Gold Gann Levels is a non-repainting, precision tool designed exclusively for XAUUSD/Gold intraday trading. It uses W.D. Gann’s square root method to plot real-time support and resistance levels, helping traders spot high-probability entries with confidence and clarity. William Delbert Gann (W.D. Gann) was an exceptional market analyst whose trading technique was based on a complex blend of mathematics, geometry, astrology, and ancient calcul
Berma Bands
Muhammad Elbermawi
5 (8)
Berma Bands (BBs) インジケーターは、市場のトレンドを特定して活用したいトレーダーにとって貴重なツールです。価格と BBs の関係を分析することで、トレーダーは市場がトレンド段階にあるか、レンジ段階にあるかを判断できます。 詳細については、[ Berma Home Blog ] をご覧ください。 バーマ バンドは、上部バーマ バンド、中部バーマ バンド、下部バーマ バンドの 3 つの異なる線で構成されています。これらの線は価格の周りにプロットされ、全体的な傾向に対する価格の動きを視覚的に表します。これらのバンド間の距離から、ボラティリティや潜在的な傾向の反転についての洞察を得ることができます。 バーマ バンドの線がそれぞれ離れると、市場が横ばいまたはレンジ相場の期間に入っていることを示すことがよくあります。これは、明確な方向性の偏りがないことを示しています。トレーダーは、これらの期間中にトレンドを特定するのが難しいと感じる可能性があり、より明確なトレンドが出現するまで待つ場合があります。 バーマ バンドの線が 1 本の線に収束すると、強いトレンド環境の兆候となること
まず第一に、この取引ツールはノンリペイント、ノンリドロー、ノンラグの指標であり、プロの取引に理想的ですことを強調する価値があります。 オンラインコース、ユーザーマニュアル、デモ。 スマートプライスアクションコンセプトインジケーターは、新米から経験豊富なトレーダーまで、非常 に強力なツールです。Inner Circle Trader AnalysisやSmart Money Concepts Trading Strategiesなど、20以上の有用な指標を1つに組み合わせています。このインジケーターはスマートマネーコンセプトに焦点を当て、大手機関の取引方法を提供し、彼らの動きを予測するのに役立ちます。 特に、流動性分析に優れており、機関がどのように取引しているかを理解しやすくしています。市場のトレンドを予測し、価格の動きを慎重に分析するのに優れています。機関の戦略とトレードを合わせることで、市場の動向についてより正確な予測ができます。このインジケーターは多目的であり、市場構造を分析し、重要な注文ブロックを特定し、さまざまなパターンを認識するのに優れています。 このインジケーター
このインジケーターは、反転ポイントと価格戻りゾーンを正確に表示します。     主要プレーヤー 。新たなトレンドが形成される場所を把握し、最大限の精度で意思決定を行い、すべての取引をコントロールします。 TREND LINES PRO インジケーターと組み合わせることで、その潜在能力を最大限に発揮します。 VERSION MT4 インジケーターが示す内容: 新しいトレンドの始まりに活性化する反転構造と反転レベル。 リスクと報酬の比率を最小限に抑えた利益 確定 と 損失停止の レベルの表示     RR 1:2   。 インテリジェントな削減ロジックによるストップロス。 指定されたインジケーターから 2 つのトレンド タイプの反転パターンを表示します。 指標: トレンドを追う   TREND LINES PRO   (世界的なトレンドの変化) TREND PRO   (クイックトレンド変更) シンプルで効果的   スキャナー   リアルタイムトレンド(新機能)。 マルチタイムフレームのインストゥルメント フィルタリング。 画面   利益     LOGIC AI信号の後。 当日プラス方
このインディケータは、価格アクション分析とドンチャンチャネルのみを使用して、ジグザグ方式で価格の反転を検出します。再描画やバックペインティングを一切行わずに、短期取引向けに特別に設計されています。それは彼らの操作のタイミングを増やすことを目指している賢明なトレーダーにとって素晴らしいツールです。 [ インストールガイド | 更新ガイド | トラブルシューティング | よくある質問 | すべての製品 ] 驚くほど簡単に取引できます すべての時間枠で価値を提供します 自己分析統計を実装します 電子メール/音声/視覚アラートを実装します 可変長のブレイクアウトと混雑ゾーンに基づいて、インディケータは価格アクションのみを使用して取引を選択し、市場が非常に高速に行っていることに反応します。 過去のシグナルの潜在的な利益が表示されます この指標は、独自の品質とパフォーマンスを分析します 負けブレイクアウトは強調表示され、説明されます インジケータは、非バックペインティングおよび非再ペイントです この指標は、日中のトレーダーが単一の価格反転を見逃さないようにするのに役立ちます。ただし、すべての
Route Lines Prices MT5  - は、潜在的な取引シグナルを見つけるために設計されたインジケーターです。シンプルなインターフェースには、複数の価格変動アルゴリズムに加え、シグナル終点の検出と完了した軌跡の計算機能が搭載されています。アルゴリズムには、使用する時間枠に基づいたボラティリティと価格平滑化の計算が含まれています。 このインジケーターには、値を変更するための主要なパラメーター「 Calculating price values 」があります。デフォルト値の1は、バランスの取れた自動計算形式を提供し、インジケーターを手動で設定することなく使用できます。 2から500までの値を手動で変更することで、独自の取引システムに合わせてインジケーターをカスタマイズできます。 このインジケーターには、2本の移動平均線(高速移動平均線と低速移動平均線)の交点で表される市場方向インジケーターが組み込まれており、独自のトレンドを判断する際には無効にすることができます。 このインジケーターは、M1からH4の時間枠での使用を推奨します。あらゆる取引銘柄で使用できます。 シグナル
AriX
Temirlan Kdyrkhan
1 (4)
AriX Indicator for MT5 A powerful trend-following and signal-evaluation tool AriX is a custom MT5 indicator that combines Moving Averages and ATR-based risk/reward logic to generate clear buy/sell signals. It visualizes dynamic SL/TP levels, evaluates past trade outcomes, and displays win/loss statistics in a clean on-chart panel. Key features include: Buy/Sell signals based on MA crossovers ATR-based SL/TP1/TP2/TP3 levels with visual lines and labels Signal outcome tracking with real-time stat
Introducing Indicator for PainX and GainX Indices Traders on Weltrade Get ready to experience the power of trading with our indicator, specifically designed for Weltrade   broker's PainX and GainX Indices.  Advanced Strategies for Unbeatable Insights Our indicator employs sophisticated strategies to analyze market trends, pinpointing optimal entry and exit points.  Optimized for Maximum Performance To ensure optimal results, our indicator is carefully calibrated for 5-minute timeframe charts on
トレンドラインプロ   市場の真の方向転換点を理解するのに役立ちます。この指標は、真のトレンド反転と主要プレーヤーが再び参入するポイントを示します。 分かりますか     BOSライン   複雑な設定や不要なノイズなしに、より長い時間足でのトレンドの変化と重要なレベルを把握できます。シグナルは再描画されず、バーが閉じた後もチャート上に残ります。 MT4バージョン   -   RFI LEVELS PRO インジケーター と組み合わせることで、その最大限の能力を発揮します インジケーターが示す内容: 本当の変化   トレンド(BOSライン) 一度シグナルが現れたら、それは有効です!これは、リペイント機能を持つインジケーターとの重要な違いです。リペイント機能を持つインジケーターは、シグナルを発した後、それを変更し、資金の損失につながる可能性があります。これにより、より高い確率と精度で市場に参入できます。また、矢印が現れた後、目標値(利益確定)に達するか、反転シグナルが現れるまで、ローソク足の色を変更する機能もあります。 繰り返しエントリ   主要プレーヤーの補充 エントリーポイントを探す
多くの矢印インジケーターは、シグナルだけを表示して、その後の判断をすべてトレーダーに任せてしまいます。KT Alpha Hunter Arrows は、完整なトレードプランをチャート上に提示します。 各シグナル矢印が表示されるたびに、エントリーライン、ストップロス、4つのテイクプロフィット水準、そして現在の銘柄と時間足が今トレードに値するかどうかを示すリアルタイムのエッジ判定が、すでに描画された状態で表示されます。付属の Trade Manager EA は、あなたが手動でエントリーした後の実行管理を担当し、相場が荒れて判断がぶれやすい場面でも規律あるトレードを保ちやすくします。リペイントなし。確定足シグナルのみ。Forex、ゴールド、指数、その他あなたが取引するあらゆる銘柄に対応します。 主な機能 リペイントしない買い矢印と売り矢印を、足の確定後にのみ表示。 各シグナルに、エントリーライン、構造的ストップロス、4つのテイクプロフィット水準を表示。 Edge Dashboard が、現在のチャートで買いセットアップと売りセットアップを別々に評価。 判定システム:No Edge、Mar
作者のその他のプロダクト
Working with the Smart Analiz indicator is very simple - you just react to the arrows that the indicator reflects, that is, the arrow is a command for action. The indicator signals are accurate enough and you can trade using this information! The indicator builds a very high-quality channel in which it generates entry signals! Which is the ideal strategy for a trader as the trader is always hesitant when choosing a strategy to work with. That is, this indicator will allow you to solve the dilemm
The Beautiful indicator shows potential market reversal points. The intelligent algorithm of the indicator detects the trend well, filters out market noise and generates input signals and exit levels. Uses just one parameter for settings. Simple, visual and efficient trend detection. The indicator does not redraw and does not lag. You can set up message alerts as sound or email. Works on all currency pairs and on all timeframes. Ready-made trading system.
The Arrows Forecasters indicator is simple, visual and effective trend detection. The intelligent algorithm of the indicator determines the trend with a good probability. Uses just one parameter for settings. The indicator shows the points of potential market reversal. Ready-made trading system. The indicator does not redraw and does not lag. Works on all currency pairs and on all timeframes. You should remember that using a combination of forecasting tools, it is advisable to choose 2-3 indic
Balanced Costing - shows signals - can be used with an optimal risk factor. The indicator can be used both for pipsing on small periods and for long-term trading. The Balanced Costing trend indicator uses reliable algorithms in its calculations. Shows favorable moments for entering the market with arrows, that is, using the indicator is quite simple. Works on all currency pairs and on all timeframes. Of course, the approach to trading should be complex and in order to make a decision, you shou
The Signal Point Channel indicator predicts the most likely short-term price movement based on complex mathematical calculations. One of the biggest challenges traders face is finding a trading system that's right for them. This indicator is designed to detect trends in price movement and allows you to quickly determine not only the direction of the trend, but also to understand the levels of interaction between buyers and sellers. It has no settings and therefore can be perceived as it signals.
The Transition Trend indicator shows the points of potential market reversal. The indicator's smart algorithm detects the trend, filters out market noise and generates entry signals and exit levels. Simple, visual and efficient trend detection. Uses just one parameter for settings. The indicator does not redraw and does not lag. You can set up message alerts as sound or email. Works on all currency pairs and all timeframes. Ready-made trading system.
World Trend
Tatiana Savkevych
5 (1)
World Trend is a hybrid trend indicator, as it is based on the signals of elementary indicators and a special algorithm for analysis. The indicator shows favorable moments for entering the market. The intelligent algorithm of the indicator determines the trend, filters out market noise and generates entry signals. You can use the indicator as the main one to determine the trend. The indicator can work both for entry points and as a filter. Uses two options for settings. The indicator uses colo
The Generic Trend indicator is a trend type indicator. It smooths out price fluctuations when generating a signal by averaging the data and the signal only at certain moments! In those moments when you need to make a decision to enter a position and give the trader a direction. The indicator gives the trader the opportunity to visually determine which trend will be present at a particular time interval. This indicator was created to quickly determine the situation in the market, reflect the st
The Trend Privacy indicator is easy to set up and works on all pairs and all time frames. Identifies the mainstream and helps analyze the market at a selected time frame It is extremely important for any trader to correctly determine the direction and strength of the trend movement. Unfortunately, there is no single correct solution to this problem. Many traders trade on different time frames. For this reason, the received signals are perceived subjectively. Trend indicators provide an opportu
Chaos Trend is an arrow indicator for identifying potential entry points. I like it, first of all, because it has a simple mechanism of work, adaptation to all time periods and trading tactics. More reliably, the Forex Chaos Trend indicator is a real trading strategy with which you can achieve the desired results. As soon as the Chaos Trend indicator is installed, the main indicators for the price of the traded pair will immediately begin to be recalculated, based on the postulates of technica
Channel Smooth - Forex channel indicator is a very useful and relevant tool for any trader, thanks to which you can efficiently and competently perform plotting on the chart, including automatically, without wasting time on independent calculations and eliminating the risk of incorrect point selection. Channels are needed to trade channel strategies that involve working within a certain price range. The key difference between the Channel Smooth indicator and other channel indicators (for examp
Trend Improved - Arrow trend indicator, without lagging and redrawing, is used by traders in trending strategies in trading on financial markets (Forex, CFDs, binary options). Key parameter MinAngle - The parameter is set in pips. For each instrument, select individually, start from scratch. If the parameter is too large then there will be no signals. The tool, at the very least, deserves attention for its signal accuracy and intuitiveness. Increasing the Period parameters decreases the numbe
Forex Roulette - Trend Following Strategy! The most reliable indicator is used for the trend - the moving average. Only for the global trend, then the strategy itself is implemented. On screenshots, testing from $ 10,000, but the bot works without problems with $ 100. The first graph is optimization, the second is forecast. You can repeat yourself on another period, observing the principle indicated below. How the bot works. Optimization for the m15 period, after which works for 3 months. Very
Projection Trend - a Forex arrow indicator without redrawing does not change its signals when the market situation changes, does not adjust to the chart. The signals given by him are unambiguous. Traders build a trading system that provides good signals 80-90% of the time. The indicator showing the points of entry and exit from the market with arrows is able to bring results not only in the Forex market, but also when working with binary options. You can buy it and install it in MetaTrader you
Calc Trend is a Forex trend indicator based on the familiar RSI, but there is one "but"! We display RSI indicator signals on a price function chart using a mathematical approach. As you know, the overbought and oversold zones that the standard RSI fixes are often broken by the price and the price goes the other way. This makes the standard indicator inapplicable for real work in its pure form. Also, for sure, each user has noticed that at any part of the history, it is possible to change the R
Calc Trend Ex is a forex trending bot based on the Calc Trend indicator. A bot created on the basis of this Calc Trend indicator and working on the principle - if there is an indicator signal, then the bot has closed an opposite deal and opened a new deal in the specified direction, it can be downloaded and used for work. The bot is as simple as possible! The bot fully reflects the work of the indicator. Moreover, the bot can be optimized (by optimizing the parameters of the indicator itself)
First Derivative RSI is a forex indicator based on all familiar RSI, based on the first derivative of the price function. The indicator combines the functionality of an oscillator and a trend indicator. At the bottom of the chart, a part of the indicator similar to the RSI will be displayed, but only calculated as the first derivative of the price. On the chart itself, trend signals will be displayed by arrows, they are filtered by the algorithm and always alternate buy / sell. It also shows th
Trend First Derivative RSI is a Forex indicator based on all familiar RSI, based on the first derivative of the price function. On the chart itself, trend signals will be displayed by arrows, they are filtered by the algorithm and always alternate buy / sell. It also shows the number of profitable pips that the indicator can give at the specified interval (LimitCalcHistory). The indicator has a parameter (Spread), which deducts a part of the profit per spread for each signal. To control the pe
Trend First Derivative RSI is a Forex trending bot based on the First Derivative RSI indicator. In the screenshots you can see tests that show the bot can work for 1,3,6 years, the timeframe is one hour. These are demo tests that show that it is realistic to go through significant sections of history with a different indicator and simple rules. Below in the text you will see a description of the rules of work. For real work, optimization is proposed for 3-12 months and work up to 1-2 months. O
Second Derivative RSI is a forex indicator based on all familiar RSI, based on the second derivative of the price function. Just a note on the use of the indicator. The indicator requires selection of settings not only for each currency pair but also for each timeframe. If there is no setting, then as a last resort, the indicator may not show signals! In order to pick up the settings, just use a bot that will help you do it. The indicator combines the functionality of an oscillator and a tren
Trend Second Derivative RSI is a forex indicator based on the usual RSI, based on the second derivative of the price function. On the chart itself, trend signals will be displayed by arrows, they are filtered by the algorithm and always alternate buy / sell. It also shows the number of profitable pips that the indicator can give at the specified interval (LimitCalcHistory). The indicator has a parameter (Spread), which deducts a part of the profit per spread for each signal. Immediately notice
Trend Second Derivative RSI Ex is a forex trending bot based on the Trend Second Derivative RSI indicator. Principle of operation. A bot created on the basis of this Trend Second Derivative RSI indicator and working on the principle - if there is an indicator signal, then the bot has closed the opposite deal and opened a new deal in the specified direction. It is also possible to work only for buy or sell, in which case the bot will simply close the deal without opening it in the opposite dire
Intel Trend is a forex trend indicator based on all the usual SAR, using differential calculus to generate a signal not directly from the price but from the derivative of the function. Also, when using the SAR indicator, the first point often changes, which is why the default parameter ShiftBar = 1. To skip the first baoa and read information directly from the second bar. If you set ShiftBar = 0, there will be perfect signals, but they are false. real signals for each timeframe and for each cur
Intel Trend Ex is a forex trending bot based on the Intel Trend indicator. Principle of operation. A bot created on the basis of this Intel Trend indicator and working on the principle - if there is an indicator signal, then the bot has closed an opposite deal and opened a new deal in the specified direction. It is also possible to work only for buy or sell, in which case the bot will simply close the deal without opening it in the opposite direction. The bot is also equipped with an adaptive
The Nuremberg tool presents a channel-like algorithm. The best arrow algorithms use channels without redrawing. Its settings indicate the parameters of the length and width of the channel. The indicator was created in such a way that you can fix the reaction to the channel breakout and display it in the form of an arrow. Arrow indicator Nuremberg on Forex indicates points of entry into transactions without redrawing. It generates fairly frequent and accurate signals. When an upward arrow appea
Unchained is intended for scalping trading. It is used to trade on five and fifteen-minute timeframes. But it works on H1 and higher too. According to the traders themselves, the best arrow indicator is the one that does not redraw, i.e. does not imply changes in indicators. When an upward arrow appears on the chart, the trader opens a buy order. If a downward arrow appears during trading, the buy order is closed. After analyzing the situation in this case, you can open a sell position. It is
Clustering Trend is always in operation - after the first position, provided that the position is not closed with stops. You can test the bot on any part of the history, the bot is configured to pass the entire history, but if you need to increase productivity in a specific area, you can optimize the bot for more productive work, but in a shorter part of the history. The bot works without trailing stops, breakevens or anything like that. The principle of operation is that there is a signal, th
Toroid - The indicator reflects information in a visual form, it can be used both for pipsing on small periods and for long-term trading. It generates fairly frequent and accurate signals. The indicator can be used as the main one for determining the trend. The indicator can work both for entry points and as a filter. Uses two parameters for settings. The smart indicator algorithm detects the trend, filters out market noise and generates input signals. It is based on the signals of elementary in
Platoon is an indicator designed to be able to detect a bottom or top similar to the Fractals indicator, but of course a different algorithm is used. In other words, you should not enter into a buy deal if the fractal is below. And you should not enter into a sell deal if the fractal is higher. The indicator only denotes fractals on the chart without performing any additional calculations, therefore, theoretically, any trader can find these patterns by himself. But what is a fractal, how exact
Provided
Tatiana Savkevych
Provided is a trend trading Expert Advisor based on the simplest indicator strategy of following the market towards global price movements. The robot can effectively trade on almost any trading asset or currency pair, but subject to proper optimization. It is recommended to use the robot on the hourly chart of the Euro / Dollar currency pair. List of all settings: Magic - Magic number. StartVolume - Sets the lot size for entering the market. OnRisk - Activates Money Management. PercentRisk - A
フィルタ:
レビューなし
レビューに返信