Volume Profile stairs

Session Volume Profile — Stepped POC & Value Area

Short description (MQL5 summary field)

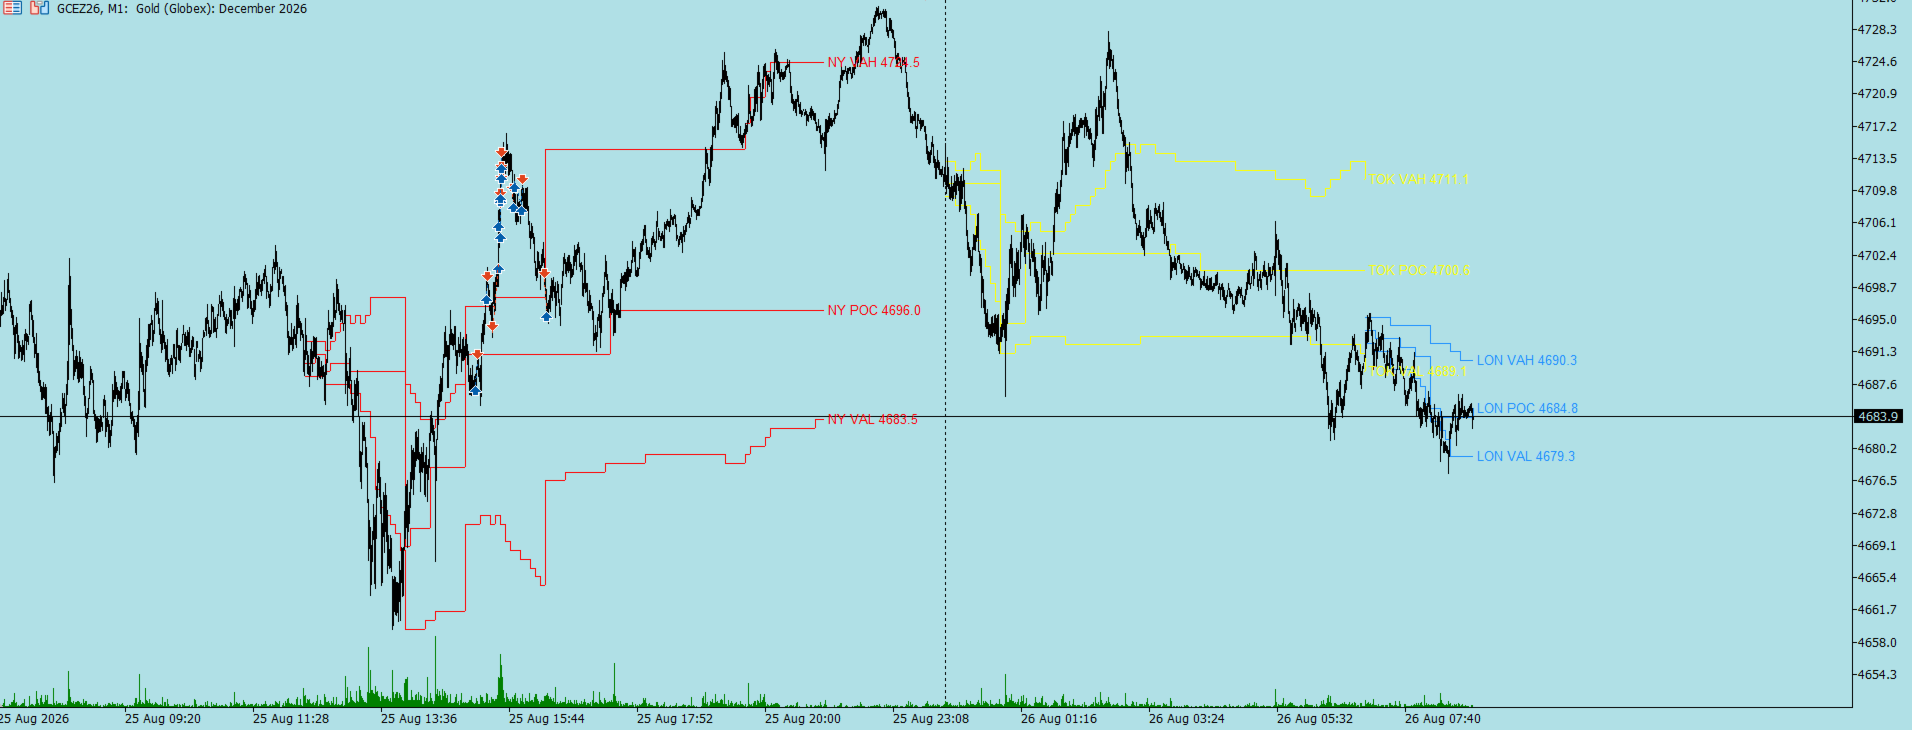
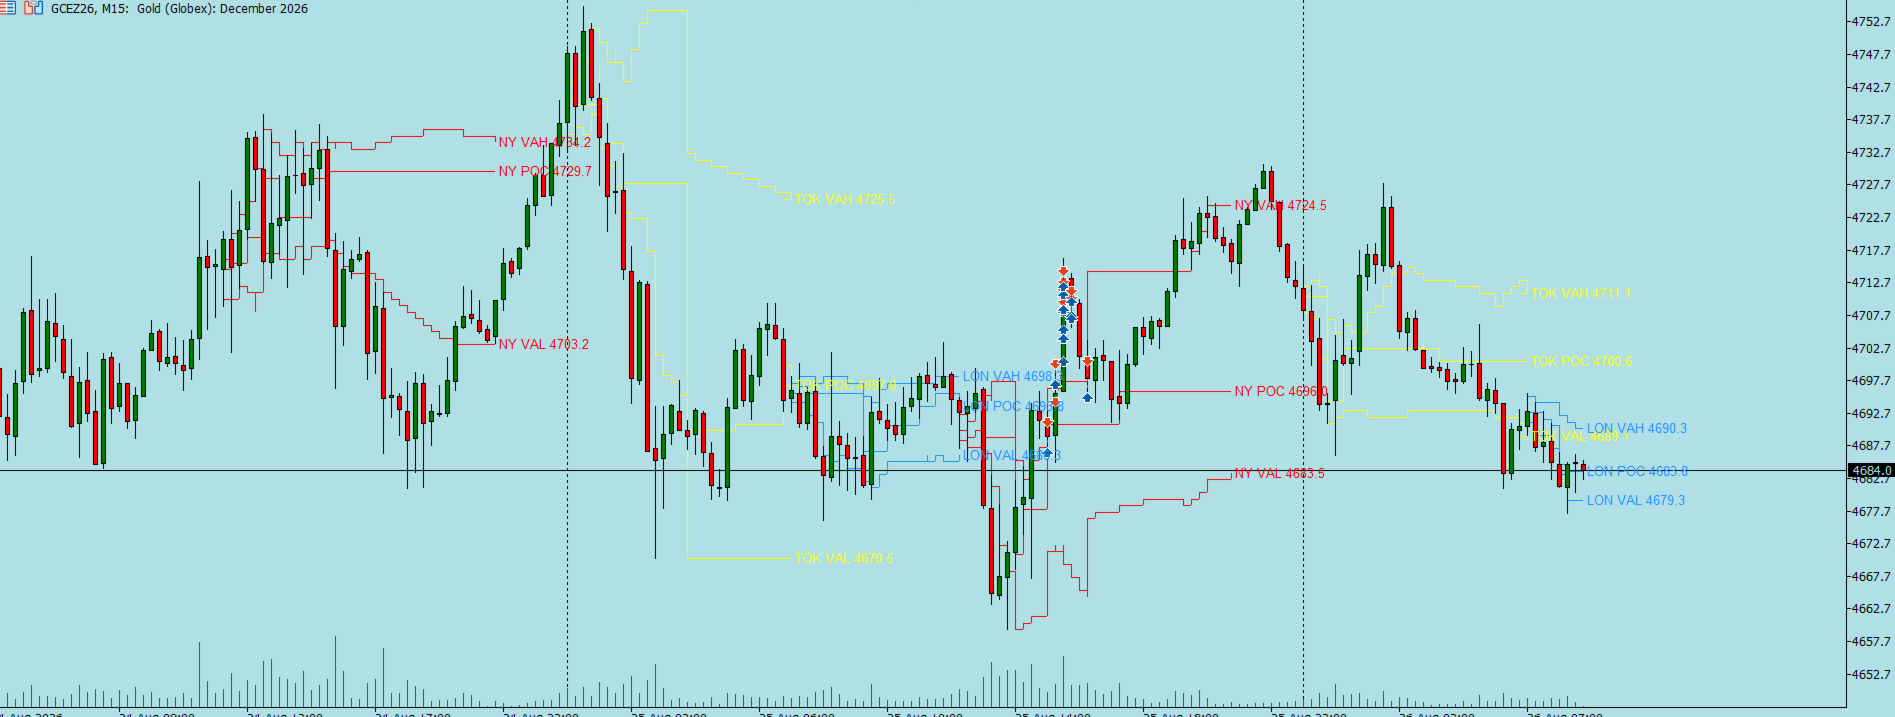
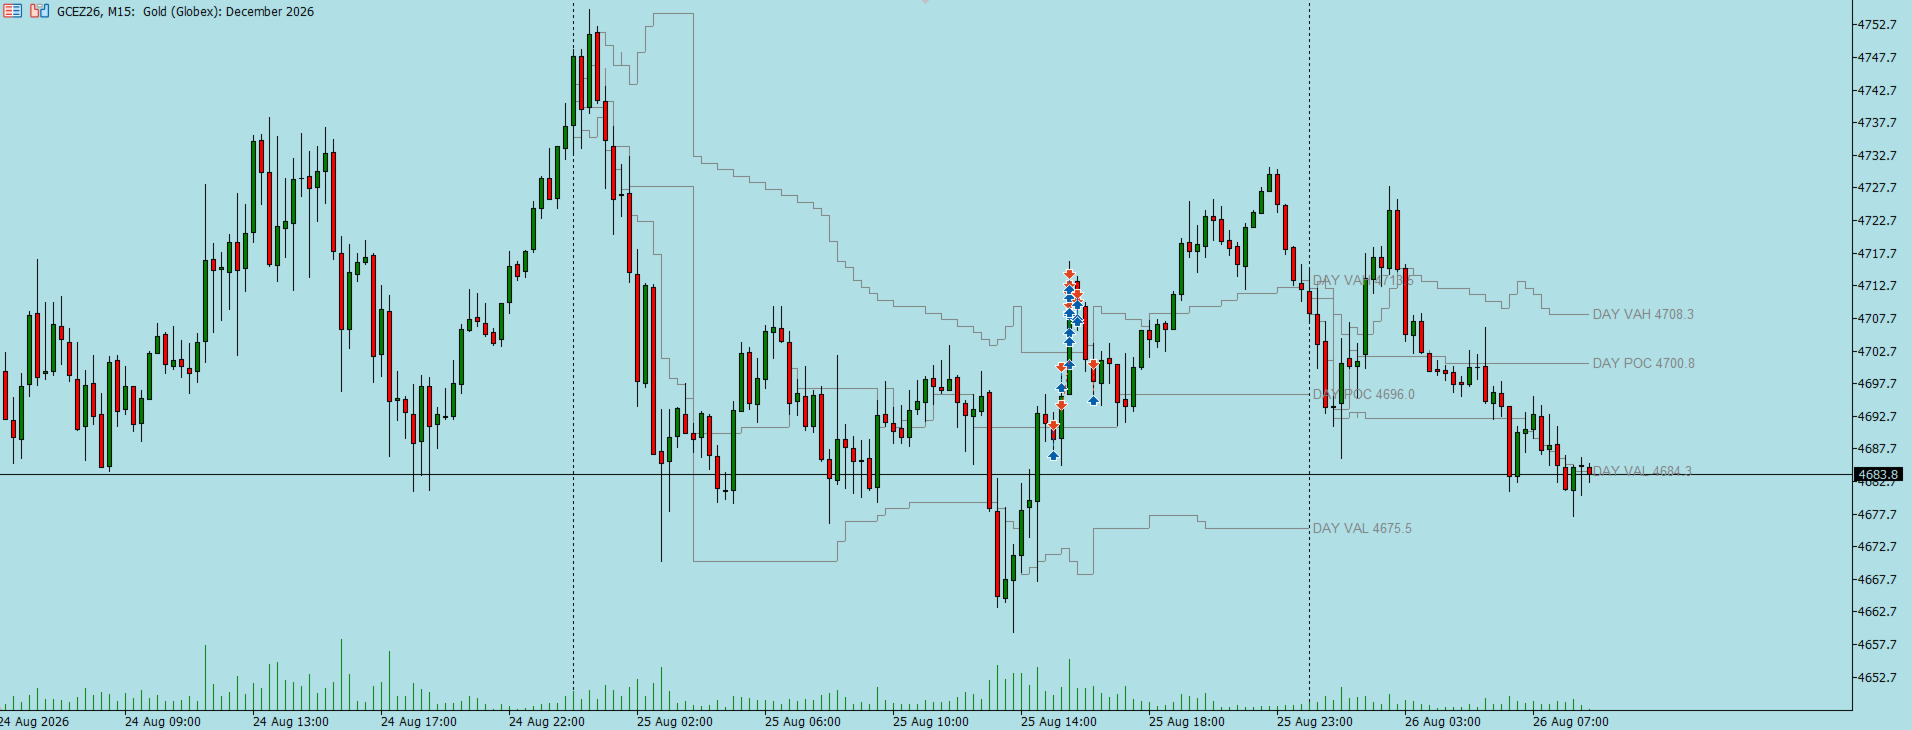
Multi-session Volume Profile displaying POC and Value Area (VAH/VAL) as developing step lines. Tokyo, London, New York, Daily and a custom session can be displayed simultaneously, each with its own hours, its own levels and its own colour. Works with both real volume (futures, stocks) and tick volume (Forex, CFDs).

Full description

The problem

A standard Volume Profile draws a flat POC line across the whole session: the final value, computed once the session is over. That is hindsight. During the session, what you actually need to know is where value sat at the moment price traded there, and whether the POC migrated or stayed anchored.

This indicator rebuilds the profile minute by minute and plots POC, VAH and VAL exactly as they developed through the session. Every change in level produces a step: a horizontal shelf while the level holds, a vertical riser when it shifts. The result is a direct read on how value migrated.

Key features

Developing POC and Value Area Levels are recomputed at a fixed interval on the volume accumulated since the session open. A POC that stays flat for hours marks a defended balance area; a run of steps in one direction marks value migration. The recalculation step is adjustable (1 to N minutes) to trade off granularity against readability.

Five sessions, displayable at once Daily, Tokyo, London, New York and a free-form custom session. Each is toggled independently with a simple true/false, computes its own bins over its own time window, and gets its own colour. The Tokyo POC is never contaminated by New York volume. This lets you watch Asian value act as reference into the European open, or the London Value Area frame the US open.

Fully configurable hours Start and end hour and minute for every session, entered in local time. A broker offset parameter (hours plus minutes) handles the conversion to server time — you adjust a single field when clocks change instead of reconfiguring every session. Sessions crossing midnight are handled automatically.

Real volume or tick volume A switch selects the source. On futures and stocks, real volume (contracts actually traded) produces a faithful profile. On Forex and most CFDs, where real volume is not distributed, tick volume provides a usable proxy for activity. The indicator works either way; the right choice depends on what your feed carries.

Multi-session history Show the current session alone, or N previous sessions, each with its own profile and its own levels. Weekends can be skipped in the count, which avoids drawing empty sessions on a Monday.

Optional histogram The volume profile can be drawn as a histogram, with distinct colouring for the POC bin, bins inside the Value Area and bins outside it. It can also be switched off to keep only the lines — recommended when several sessions are active at the same time.

Light on resources By default, recalculation is triggered only when an M1 bar closes, not on every tick. A real-time mode remains available for those who want to watch the POC move continuously.

Parameters

Session

Parameter Description
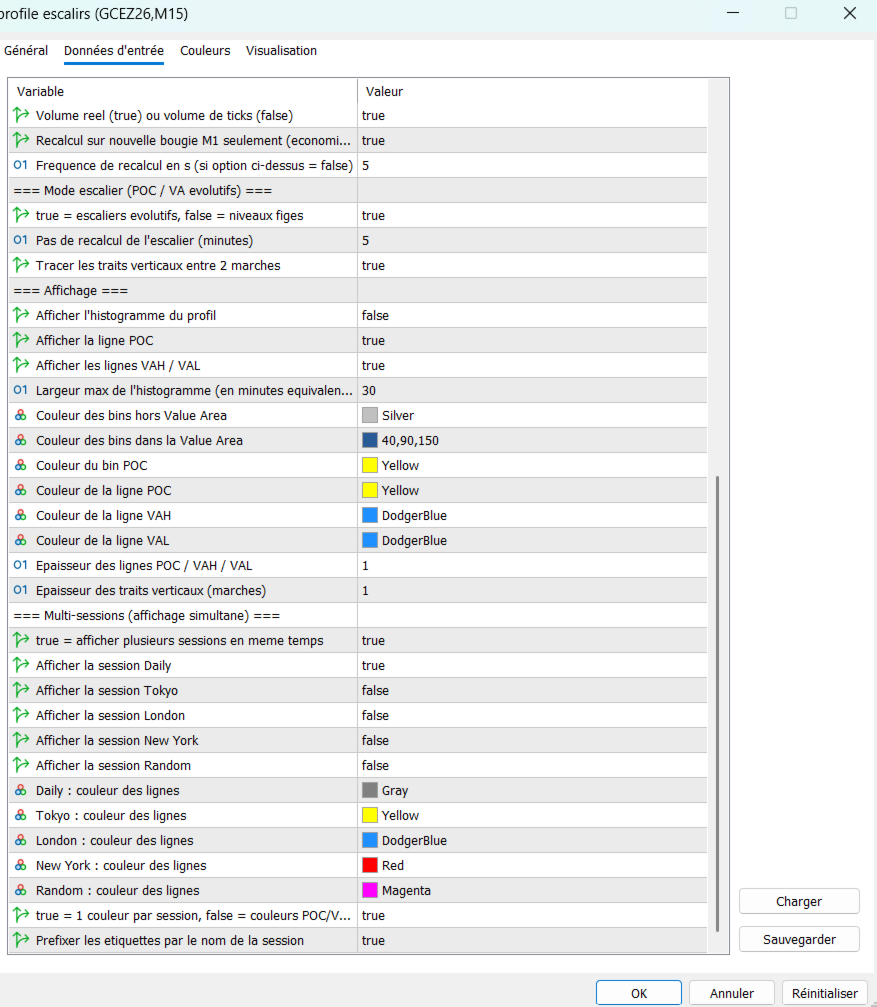
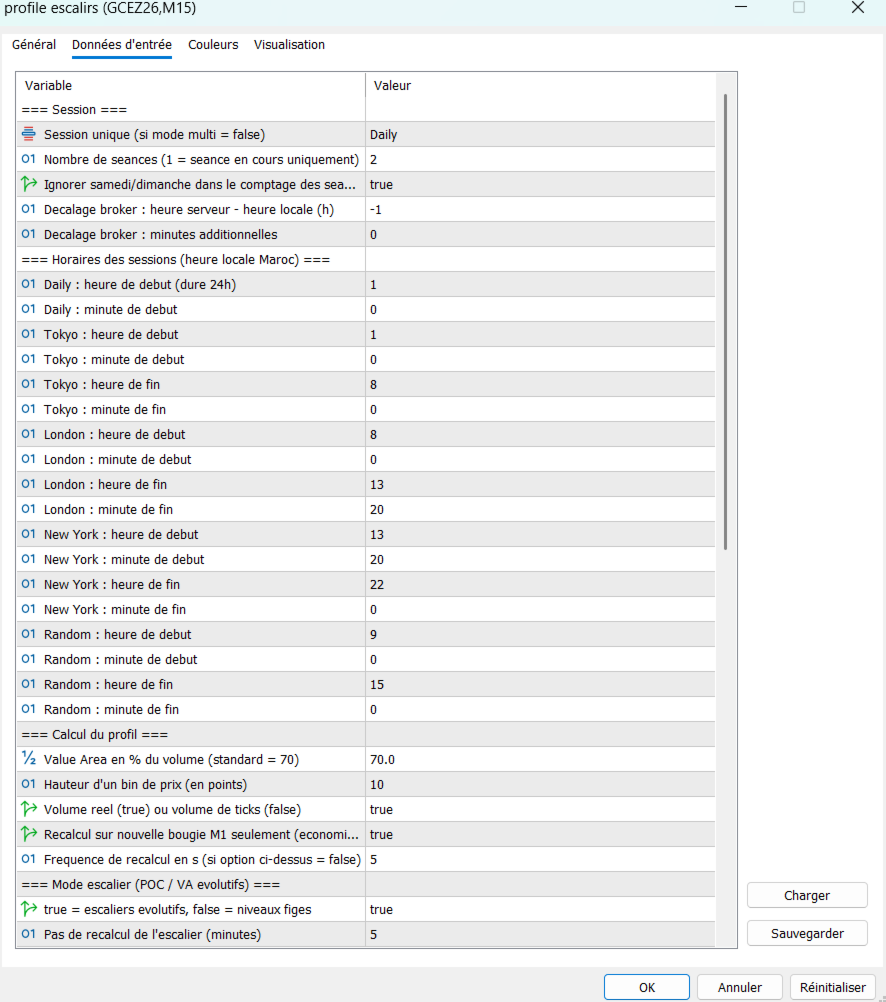
InpSessionType Single session (used when multi-session mode is off)
InpNbSessions Number of sessions displayed (1 = current session only)
InpSkipWeekend Skip Saturday/Sunday when counting sessions
InpBrokerOffsetHours Broker offset: server time − local time
InpBrokerOffsetMin Additional offset minutes

Session hours (local time)

Start and end hour and minute for Daily, Tokyo, London, New York and Custom.

Calculation

Parameter Description
InpValueAreaPct Percentage of volume defining the Value Area (standard: 70)
InpBinTicks Height of a price bin, in points
InpUseVolumeReal Real volume (true) or tick volume (false)
InpRecalcOnNewBarOnly Recalculate on M1 close only
InpRecalcSeconds Recalculation frequency when the option above is off

Stepped mode

Parameter Description
InpSteppedMode Developing steps (true) or fixed levels (false)
InpStepIntervalMin Recalculation step, in minutes
InpShowStepRisers Draw vertical risers between steps

Display

Histogram, POC and VA lines, profile width, bin and line colours, line widths.

Multi-session

Parameter Description
InpMultiSession Enable simultaneous display
InpShow...Sess One toggle per session
InpColorPerSession One colour per session, or global POC/VA colours
InpShowSessionName Prefix labels with the session name

Getting started

Choose the volume source. First check whether your symbol distributes real volume. If the histogram looks inconsistent or empty with InpUseVolumeReal = true , switch to tick volume.

Set the broker offset. Compare the server time shown by the terminal with your local time and enter the difference. An incorrect offset produces profiles computed over the wrong time window — this is the first thing to check if levels look wrong.

Tune the bin size. InpBinTicks sets the resolution of the profile. Too fine and the POC becomes unstable, jumping between levels; too coarse and the Value Area loses precision. The right value depends on the instrument and its volatility.

Balance the step interval. A short step shows every micro-shift but creates a large number of objects. A 5 to 15 minute step usually gives the most readable result.

Technical notes

  • Data is read from M1 regardless of the chart timeframe, which keeps profile resolution constant.
  • Each bar's volume is distributed evenly across the bins its range covers.
  • The Value Area is built by symmetric expansion around the POC: at each step the heavier adjacent bin is added until the target percentage is reached.
  • Available M1 history depends on the broker. If past sessions do not appear, force the download by scrolling an M1 chart to the left.
  • Nothing is drawn while CopyRates returns no data for the requested range: sessions without quotes (holidays, weekends) are simply skipped.

Disclaimer

This indicator is an analysis and decision-support tool. It does not generate entry or exit signals and does not constitute investment advice. Past performance is not indicative of future results.
Produits recommandés
Breakeven Line v2 Indicator   is a MetaTrader indicator that calculates breakeven level based on all open positions and displays it on your chart as a horizontal line. Additionally, it will calculate the total number trades, the total number of lots, and the distance to the breakeven line in points and profit/loss. The indicator is available for MetaTrader 5 . Why use Breakeven Line Indicator? When you have multiple trades opened on a single symbol, it can be difficult to tell where your averag
RSImaxmin
Carlos Andrés Moya Erazo
4.5 (10)
The indicator shows when there are overprice and divergences on the RSI. In addition, it has configurable alerts, dynamic overprice levels and a special “RSI cleaner” function. The indicator that automatically calculates the premium rates! RSImaxmin is an indicator based on the Relative Strength Index (RSI) oscillator that effectively identifies changes in price trends as it reflects the relative strength of bullish movements compared to bearish movements. It is widely used by traders to measur
Hybrid Assisted Trading Engine Manual Trading. Machine Discipline. The Hybrid Assisted Trading Engine is an institutional-grade manual trade management system designed to protect traders from emotional mistakes — without taking control away from them. You decide when to enter . The engine decides how the trade is managed . What It Does This system continuously monitors your manual trades and enforces professional-level trade management rules in real time: Smart Breakeven logic R-based trai
Market Equilibrium Index Pro – Advanced Price Balance & Mean Reversion Indicator for MT5   Get the MetaTrader 4 Version Here:   https://www.mql5.com/en/market/product/165151 Market Equilibrium Index Pro is a quantitative market balance indicator engineered to detect statistically extended price conditions and dynamic equilibrium shifts. Unlike traditional oscillators, this tool applies weighted price distribution logic to calculate real-time equilibrium zones, allowing traders to identify hi
SyncCrosshair Pro
Jaume Sancho Serra
OVERVIEW SyncCrosshair Pro synchronizes your crosshair across all open chart windows. When you move your mouse on one chart, all other charts instantly display the crosshair at the exact same time position. Perfect for traders who analyze multiple timeframes or correlated instruments simultaneously. KEY FEATURES Multi-Chart Crosshair Sync • Vertical line synchronized by time • Horizontal line synchronized by price • Works across different symbols (EURUSD, XAUUSD, indices, crypto...) • Works ac
# Wave Trend Oscillator (WTO) User Guide ## Overview Wave Trend Oscillator is a powerful technical analysis tool used to analyze price momentum and trend direction. It visualizes market conditions using two main lines (WT1 and WT2) and a histogram. ## Components 1. **WT1 (Green Line)**: Main trend indicator 2. **WT2 (Red Line)**: Signal line 3. **Histogram (Blue)**: Shows the difference between WT1 and WT2 4. **Arrows**: Mark crossover points    - Green Arrow: WT1 crosses above WT2 (Buy signa
VolumeProfile CtrlDrag — Interactive Volume Profile Version 3.20  |  MQL5  |  MT5  |  Indicator for Main Chart Window VolumeProfile CtrlDrag   — a professional tool for building a volume profile on any selected bar range. Simply hold Ctrl and drag the left mouse button  across the desired chart area — the profile is built instantly. How to Use •   Hold Ctrl  + press and hold the left mouse button at the start of the desired range •   Drag the cursor to the end of the range •   Release the mouse
AngleMeter Pro
Gabriel Balbino De Oliveira
Turn market slope into your greatest trading advantage! Tired of lagging and subjective indicators? AngleMeter Pro is here to revolutionize your chart analysis in MetaTrader 5. Powered by advanced trigonometry and statistical linear regression, it measures the exact trend angle in real time using a striking visual protractor with a continuous color gradient. Featuring dual-timeframe support for macro context analysis, dynamic bisection channels, an embedded normalized mini-chart, and an interact
The Definitive Performance Testing Solution for MetaTrader Environments What This Tool Does This specialized benchmark utility measures the performance of your MetaTrader environment, providing insights that impact your trading execution. Unlike generic system benchmarks, this tool evaluates performance specifically within the MetaTrader runtime environment. For Professional Traders & Developers: Performance Metrics : Measurements of calculation throughput and memory efficiency Trading-Specific
Signal Verdict
Keattisuk Viriyasu
Most traders never actually find out whether the signal they follow makes money. Signal Verdict answers that on your own chart. It replays your entry rule across history, opens and closes a simulated position for every signal, and reports what really came out: win rate, expectancy in R, profit factor, drawdown, and how often each take profit was reached. It is not limited to its own signals. Signal Verdict can read the buffers of any indicator installed on your terminal, so the arrows you are
Multi Timeframe Analyzer
Hapu Arachchilage Tharindu Lakmal
Hello, traders! Welcome to the introduction of Multi Timeframe Analyzer v1.0 !  ( MT5 ) This is the Meta Trader 5 version of the "Market Meeter". Click here to Get MT4 version <<---  What is this indicator? Simply put, this indicator analyzes the market across eight different timeframes , from lower to higher, and predicts the next price direction along with an estimated continuation time. It does this by using volume, volatility, and price patterns in its calculations. Let's dive into the inf
Mega Dashboard
Paul Anscombe
5 (4)
The Ultimate Dashboard New Year Sale - save $20   (normal price $79) Indicators are useful for traders, but when you put them into a dashboard that can scan 28 symbols at once they become even better, and when you can also combine different indicators and timeframes to give you synchronized alerts, then they become awesome. This easy to use dashboard provides you with 32 leading indicators, use them individually or together, to create powerful combination alerts. So when you want to know that RS
La bougie précédente multi-devises ou le scanner de barres précédentes vous aident à numériser des graphiques multi-symboles avec n'importe quelle période personnalisée que vous sélectionnez dans les paramètres de l'indicateur. Basé sur le produit : https://www.mql5.com/en/market/product/78657 Il peut être utilisé pour numériser plusieurs symboles pour le haut-bas du jour précédent, le haut-bas de la semaine précédente, le haut-bas du mois précédent ou toute période personnalisée, par exemple
!! FLASH SALE !!   Over 80% off !!     For ONE week only. Now only $47 - normally $297! >>>      Ends on 30 June 2023 - Don't miss it! Buy And Sell Signal Arrows On The Chart When The Price Is About To Reverse. Also Sends Alerts –On MT5 To Your Phone To Your Email. Does not repaint. Works on any pair, any timeframe.   (Just ajust the settings for your pair and timeframe.) 10 Activations allowed so you are free from limitations MT4 version here .   Spreads from 0.1pip RAW/ECN Accounts,   c
Discover the MSG Method: Master the Major Session Gap for Consistent Forex Profits Unlock the power of the MSG Method – our proprietary Major Session Gap strategy designed to capture high-probability trades during key market session transitions. Developed by the T1 FX Team, this innovative approach leverages algorithmic precision to identify and exploit price gaps between major trading sessions (London, New York, and Tokyo). Why Choose the MSG Method? High-Probability Setups : Focuses on session
The professional browser of News and Trading Sessions is now available in MetaTrader 5. Now all the most important market information is collected on one dial! News located on the Time scale. Planning your working time has never been so easy and convenient ... The news scale can be switched a day, two, a week, a month forward or backward (see the details in the short video). All news updates in real time. Thanks to the built-in filters, you can configure the display of news by importance, cou
The CLOSE concept: Like the thumb and index almost touching - it marks the moment when price is   this close   to reversal. Precision entry, not late. Inputs: Focus HTF/LTF, Donchian periods, ZZ Depth, Confirm Lookahead, EST Lookback, Dashboard position. Works on all symbols, all timeframes. What it does: ZZ Absolute   - Detects real Highs/Lows with depth 12 (absolute pivots, not repainting zigzag) Focus Engine H4/D1   - Confirms each ZZ with Donchian TLB logic. Score +3/+4 = BUY CONF, -3/-4 =
Channel Scanner MT5
Reza Aghajanpour
5 (1)
**   All Symbols   x   All Timeframes   scan just by pressing scanner button ** *** Contact me  to send you instruction and add you in "Channel Scanner group" for sharing or seeing experiences with other users. + FREE   Trading Utility MT5 Introduction: The Channel pattern is described as the area located between two trend lines. This area is used for a measure of a trading range. In this case, the upper trend line connects price highs while the lower trend line connects price lows. Also when it
MA Speedometer MT5
Davit Beridze
5 (3)
Non standard attitude to the standard moving average indicator. The essence of the indicator is to determine the strength and speed of the price direction by determining the tilt angle of the moving average. A point is taken on the fifteenth MA candle and a point on the last closed MA candle, a straight line is drawn between them, it is movable and on a hemisphere shows an angle of inclination from 90 degrees to -90. above 30 degrees is the buying area, below -30 degrees is the selling area. abo
Aklamavo Market Sessions Monitor-EA (Expert Advisor) is a   Global Stock Exchange Market Hours Dashboard   for MetaTrader 5. It provides a comprehensive visual display of the opening status and trading hours of 7 major stock exchanges around the world. The EA creates a real-time dashboard that shows whether each stock exchange is currently: OPEN   (Green background) CLOSED   (Red background) PRE-MARKET   (Light Green background) POST-MARKET   (Light Pink background) Unique Features: Progress Ind
OrderFlow Matrix PRO for MT5 Institutional Volume Profiler, Bid/Ask Footprint Ladder & Predictive Auction Engine OrderFlow Matrix PRO   brings true institutional-grade Order Flow analysis and Volume Profiling directly to MetaTrader 5. By decomposing each candlestick’s tick volume into precise   Bid (Sell)   and   Ask (Buy)   participation, the indicator reconstructs the internal auction mechanics at every price level. Unlike traditional volume indicators that only show total volume per bar,   Or
HedgingMonitor: Visual Control for Hedging Operations HedgingMonitor: Professional Order Visualization for MT5 HedgingMonitor is a professional indicator for MetaTrader 5 that displays detailed information about all your open and pending orders in an organized and customizable visual panel. Ideal for traders who use hedging strategies or manage multiple orders simultaneously. Key Features: Intuitive Visual Interface: View all your orders in a single panel, with color coding to quickly identify b
SmartTrade Precision MTF Candle Dashboard displays multi-timeframe candle data on a single chart subwindow. It allows users to monitor up to 9 timeframes simultaneously without obstructing the main price chart. The indicator renders visual candlestick representations for each selected timeframe, enabling a clear overview of higher timeframe structures and current candle progression. Key Features Multi-Timeframe Monitoring: Displays current candle direction and structure across 9 timeframes (M1 t
!! FLASH SALE !!   Over 80% off !!     For ONE week only. Now only $47 - normally $297! >>>      Ends on 30 June 2023 - Don't miss it! Buy and Sell Arrows On The Chart According To Price Action Sends Alerts On MT5 To Your Phone To You Email Does NOT repaint. Works on any pair, any timeframe.     10 Activations allowed so you are free from limitations. MT4 Version here . For spreads from a tiny 0.1 pips RAW/ECN Accounts,  click here . Check out my Waka Esque EA signal here: >>   High Risk Se
THE NUMBER CHANGES. THE MEANING DOESN’T. Change timeframes. Keep your reference. SAME PERIOD. DIFFERENT MEANING. Change the timeframe, and the MA you trusted is no longer measuring the same market horizon. The problem The same MA period measures a different amount of market time when the chart timeframe changes. The solution Equivalent MA changes the number — so your reference keeps the same meaning. H4 EMA 50 = H1 EMA 200 = M15 EMA 800 USER MANUAL Complete setup instructions, feature details,
Wilizard SMC Suite is a complete Smart Money Concepts / ICT toolkit in a single, fast, non-repainting indicator. Instead of loading six separate tools onto one chart, you get every institutional-style concept — market structure, order blocks, fair value gaps, liquidity, premium/discount, killzones, a multi-timeframe dashboard and confluence signals — working together, all confirmed on closed bars. Everything you see is calculated on CLOSED candles only. Nothing shifts, redraws, or disappears a
Bullhouse Marketprofile
Luiz Vinicius Pereira Rocha -
Bullhouse MarketProfile Description The MarketProfile indicator collects and distributes traded volume at different price levels, creating a horizontal histogram that highlights areas of institutional interest. How it helps in trading It helps traders identify strong support and resistance zones, balance areas, and points of control (POC), offering insights into where the market participants are most active. ️ How to use Set the desired range of candles or session. The indicator will
The Market Structures Pro indicator finds and displays 5 (five) patterns of the Smart Money Concepts (SMC) system on the chart, namely: Break Of Structures (BoS)       Change of character (CHoCH) Equal Highs & Lows Premium, Equilibrium and Discount zones with Fibo grid High-high, Low-low, High-low and Low-high extremes Patterns are displayed for two modes - Swing and Internal and are easily distinguished by color on the chart. Internal mode features higher contrast colors, finer lines, and smal
Indicator Summary The indicator dashboard displays values and trading actions, as well as provides a summary of trading actions based on 11 built-in indicators. Built-in Indicators: RSI (Relative Strength Index)   - A crossover from the overbought zone downwards is a sell signal. A crossover from the oversold zone upwards is a buy signal. When fluctuating in the zone between overbought and oversold, the signal is formed depending on the value's position relative to 50. Above 50 indicates a buy,
- It is 30$ now.  It is enabled for 1 purchase. User Manual Contact me for instruction or any questions! Gold Entry PRO Precision Timing for XAUUSD Institutional Moves Gold Entry PRO is a specialized trading engine designed to conquer the high volatility of Gold (XAUUSD). By fusing multi-timeframe confluence with institutional trend-following logic, it eliminates the guesswork and allows you to trade with the momentum of the market, not against it. Suitable for Gold Scalpers, Intraday Tra
Les acheteurs de ce produit ont également acheté
Trend Sniper X
Sarvarbek Abduvoxobov
4.9 (41)
Trend Sniper X est un indicateur de suivi de tendance multi-unités de temps pour MetaTrader 5 qui aide les traders à identifier la direction de la tendance et les points d'inversion potentiels avec clarté et précision. pour MT4: https://www.mql5.com/en/market/product/193245 Informations sur le prix : Le prix actuel est un prix promotionnel et est susceptible de changer lors des prochaines mises à jour et nouvelles fonctionnalités. Offre bonus : Pour obtenir GRATUITEMENT l'Auto-Trade Assistant E
Smart Trend Trading System — MetaTrader 5 Après votre achat, envoyez-moi un message sur MQL5 pour recevoir GRATUITEMENT Smart Universal Expert Advisor, ainsi que le cours en ligne, le manuel PDF et l’accès au groupe privé. STTS réunit la direction de la tendance, les signaux d’entrée et de sortie, les zones de retournement et les niveaux de prix importants directement sur votre graphique. Suivez le système manuellement ou connectez un EA compatible distinct pour une exécution automatique selon l
Zoryk Gold
Reda El Koutbane
5 (15)
ZORYK — Système avancé de signaux XAUUSD pour MetaTrader 5 Vous connaissez certainement cette sensation. Vous passez du temps à analyser l’or. Vous attendez le bon point d’entrée. Vous ouvrez enfin la position, puis le prix commence immédiatement à évoluer contre vous. Vous fermez trop tôt, déplacez le Stop Loss ou hésitez pendant quelques secondes. Ensuite, le marché atteint exactement l’objectif que vous aviez initialement prévu, mais sans vous dans la position. Le problème n’était pas toujour
SuperScalp Pro
Van Minh Nguyen
4.56 (36)
SuperScalp Pro - Professional Multi-Layer Confluence Scalping System SuperScalp Pro est un indicateur avancé de scalping qui améliore le Supertrend classique grâce à plusieurs filtres intelligents de confirmation. Il aide à identifier des opportunités de Buy/Sell présentant une probabilité plus élevée, tout en réduisant considérablement les faux signaux. Des flèches Buy et Sell claires apparaissent directement sur le graphique, tandis que les niveaux de Stop Loss et Take Profit basés sur l’ATR s
Un nouveau Roi en ville - Indicateur + Gestion des ordres (TP1 + TP2 + TP3) + Envoi optionnel de signaux Telegram INCLUS (GRATUIT) (SYSTÈME COMPLET DE TRADING et DE SIGNAUX) Notre meilleur EA pour l’Or : Gold Slayer Cet indicateur inclut une stratégie avancée, un système de trading avec gestion des ordres personnalisable ainsi qu’un système de retour à la moyenne combinant des extensions d’enveloppes, soutenu par plusieurs filtres intelligents de confirmation comme le RSI afin de détecter des en
SMC Intraday Formula
VividMind Digital Solutions
5 (26)
Commençons par être honnêtes. Aucun indicateur ne vous rendra rentable à lui seul. Si quelqu’un vous dit le contraire, il vous vend un rêve. Tout indicateur qui affiche des flèches parfaites d’achat/vente peut être rendu impeccable — il suffit de zoomer sur la bonne partie de l’historique et de capturer uniquement les trades gagnants. Nous ne faisons pas cela.  SMC Intraday Formula est un outil. Il lit la structure du marché pour vous, identifie les zones de prix à la probabilité la plus élevée
La légende est de retour : Entry Points Pro 10. La relance de l'indicateur légendaire qui s'est maintenu 3 ans dans le Top-3 du MQL5 Market. Des centaines d'avis enthousiastes (589 sur les deux versions), des milliers de traders l'utilisent chaque jour, 31 000+ téléchargements de la démo   MT4+MT5 . J'ai lu chacun de vos avis publiés en cinq ans — et au lieu de promettre, j'ai intégré les réponses directement dans la version 10. Par un auteur présent sur les marchés depuis 1999, qui tient à l'ho
GoldenX Entry MT5
VividMind Digital Solutions
5 (16)
GoldenX Entry est un indicateur MT5 doté d’un algorithme adaptatif Smart Entry Trend, d’un système de scoring des signaux, d’un détecteur de régime de marché et d’un filtre de volatilité. Chaque signal inclut un niveau d’entrée calculé, trois niveaux de Take-Profit (TP1, TP2, TP3) ainsi qu’un niveau de Stop-Loss. Il est construit sur plusieurs couches analytiques conçues pour s’adapter à différentes conditions de marché, combinant un système analytique multicouche avec un optimiseur intégré et u
Gann Made Easy   est un système de trading Forex professionnel et facile à utiliser qui est basé sur les meilleurs principes de trading en utilisant la théorie de mr. WD Gann. L'indicateur fournit des signaux d'ACHAT et de VENTE précis, y compris les niveaux Stop Loss et Take Profit. Vous pouvez échanger même en déplacement en utilisant les notifications PUSH. VEUILLEZ ME CONTACTER APRÈS L'ACHAT POUR RECEVOIR GRATUITEMENT DES INSTRUCTIONS DE TRADING ET D'EXCELLENTS INDICATEURS SUPPLÉMENTAIRES! V
Auto Optimized SpeedAngle est un système de vectorisation du momentum de niveau institutionnel qui élimine l'ajustement de courbe ( curve-fitting ) grâce à une optimisation continue par avancement ( Walk-Forward Optimization , WFO). Plutôt que de s'appuyer sur des entrées statiques qui se dégradent lorsque les régimes de marché changent, l'indicateur recalibre dynamiquement ses paramètres en utilisant une validation hors échantillon ( Out-of-Sample , OOS), garantissant ainsi que les signaux affi
Neuro Poseidon MT5
Daria Rezueva
4.75 (52)
Neuro Poseidon is a new indicator by Daria Rezueva. It combines precise trading signals with adaptive TP/SL levels - creating best possible trades as a result! Message me and get  Neuro Poseidon Assistant  as a gift to automize your trading process! What makes it stand out? 1. Proven profitability on all assets and timeframes 2. Only confirmed BUY and SELL signals present on the chart 3. Adaptive TP & SL levels generated by the software for each trade 4. Easy to understand - suitable for al
Welcome to ENTRY IN THE ZONE AND SMC MULTI TIMEFRAME  SPECIAL BENEFIT / FOR OUR MQL5 CUSTOMERS FREE ACCESS TO THE NEW TOOL  — COMING SOON — Learn more on our official website  : https://www.fableedge.net Entry In The Zone and SMC Multi Timeframe is a real-time market analysis tool based on Smart Money Concepts (SMC) , designed to analyze market structure, price direction, and key trading zones. It supports both Single-Timeframe and Multi-Timeframe Analysis , providing a clearer view of overall m
Gardez votre avantage de trading dans votre ligne de mire ! M5 Sniper est un nouvel indicateur de MeanFX. Il combine des signaux de trading précis avec des niveaux de TP/SL adaptatifs — créant ainsi les meilleures opportunités de trading statistiques possibles ! Le prix augmente tous les 5 achats, le prochain prix est de 69$ Envoyez-moi un message après l’achat pour recevoir des conseils/un guide et un EA bonus Qu’est-ce qui le distingue ? Performance statistique éprouvée sur Gold XAUUSD ( fonct
M1 Sniper MT5
Oleg Rodin
5 (7)
M1 SNIPER   est un système d'indicateurs de trading facile à utiliser. Il s'agit d'un indicateur à flèche conçu pour l'unité de temps M1. Cet indicateur peut être utilisé seul pour le scalping sur l'unité de temps M1 ou intégré à votre système de trading existant. Bien que conçu spécifiquement pour le trading sur l'unité de temps M1, ce système peut également être utilisé avec d'autres unités de temps. Initialement, j'avais conçu cette méthode pour le trading du XAUUSD et du BTCUSD. Cependant, j
Unix Scalper
Issam Kassas
4 (4)
Unix Scalper — MetaTrader 5 Après votre achat, envoyez-moi un message sur MQL5 pour recevoir GRATUITEMENT Smart Universal Expert Advisor, ainsi que le cours en ligne, le manuel PDF et l’accès au groupe privé. Repérez la configuration. Consultez le plan. Choisissez comment intervenir. UNIX Scalper réunit l’analyse du marché, les décisions BUY/SELL/WAIT et les niveaux Entry, Stop Loss, TP1 et TP2 dans un panneau organisé. VISUALISEZ LE SIGNAL ET LE PLAN • Des décisions claires : BUY, SELL ou WAIT.
Scalper Vault   est un système de scalpage professionnel qui vous fournit tout ce dont vous avez besoin pour un scalpage réussi. Cet indicateur est un système de trading complet qui peut être utilisé par les traders de forex et d'options binaires. Le délai recommandé est M5. Le système vous fournit des signaux fléchés précis dans le sens de la tendance. Il vous fournit également des signaux supérieurs et inférieurs et des niveaux de marché Gann. Les indicateurs fournissent tous les types d'alert
Divergence Bomber
Ihor Otkydach
4.89 (94)
Chaque acheteur de cet indicateur reçoit également gratuitement : L’outil exclusif « Bomber Utility », qui accompagne automatiquement chaque opération de trading, fixe les niveaux de Stop Loss et de Take Profit, et clôture les positions selon les règles de la stratégie Des fichiers de configuration (set files) pour adapter l’indicateur à différents actifs Des set files pour configurer le Bomber Utility selon différents modes : « Risque Minimum », « Risque Équilibré » et « Stratégie d’Attente »
RelicusRoad Pro MT5
Relicus LLC
4.96 (25)
Arrêtez de deviner vos trades. Sachez quand entrer, où sortir et dans quel sens va le marché, le tout sur un seul graphique. RelicusRoad Pro réunit près de vingt outils dans un seul indicateur, et vous activez ceux qui correspondent à votre façon de trader. Entrées claires. Sorties claires. Un plan sur chaque graphique. Ça vous dit quelque chose ? Vous achetez, et le prix se retourne contre vous une minute plus tard. Vous clôturez trop tôt, puis vous regardez le mouvement continuer sans vous. Ci
Tokyo mt5 Indicator
Vasiliy Strukov
5 (7)
Le Tokyo Indicator offre une vue d'ensemble visuelle et claire de l'orientation de la tendance, des signaux de trading potentiels et des conditions du marché. Sa ligne de tendance en escalier, codée par couleur, distingue les phases haussières (en bleu) des phases baissières (en magenta). Des flèches directionnelles associées mettent en évidence les opportunités d'achat et de vente potentielles lors des changements de tendance. Un tableau de bord intégré regroupe le signal actuel, l'orientation
FX Trend MT5 NG
Daniel Stein
5 (6)
FX Trend NG : La Nouvelle Génération d’Intelligence de Tendance Multi-Marchés Vue d’ensemble FX Trend NG est un outil professionnel d’analyse de tendance multi-timeframe et de surveillance des marchés. Il vous permet de comprendre la structure complète du marché en quelques secondes. Au lieu de naviguer entre de nombreux graphiques, vous identifiez immédiatement quels instruments sont en tendance, où le momentum s’affaiblit et où plusieurs unités de temps sont alignées. Offre de Lancement – Ob
FiboSniper Pro
Van Minh Nguyen
5 (3)
FiboSniper Pro – Multi-Filter Fibonacci System with Auto SL/TP and Control Panel FiboSniper Pro est un indicateur technique qui combine des Fibonacci Envelopes dynamiques avec plusieurs filtres de confirmation afin de générer des signaux Buy et Sell sélectionnés. Les niveaux de Fibonacci sont calculés à partir de Moving Average et ATR, puis filtrés par ADX, EMA, RSI, ATR, Volume, Time et la structure des bougies. L’indicateur affiche directement sur le graphique les niveaux automatiques de Stop
Market Structure Order Block Dashboard MT5 est un indicateur MT5 conçu pour les traders qui veulent lire la structure de marché et les principales zones de réaction du prix directement sur le graphique. Il combine BOS, ChoCH, Order Blocks, Fair Value Gaps (FVG), Liquidité, Kill Zones, Volume Profile, et un dashboard compact pour une analyse rapide. Cet indicateur s'adresse aux traders qui utilisent la structure de marché, les concepts ICT et Smart Money comme cadre de décision. Il peut aider à r
Bonjour à tous les traders ! De nombreux investisseurs individuels utilisent des scripts web lents. Une approche systématique est essentielle pour un trading rentable. L'indicateur Astro AI n'est pas un simple affichage sur un graphique. Il s'agit d'un réseau neuronal sophistiqué composé de deux agents fonctionnant directement dans le terminal. Détails techniques du système : 1. Agent 1 : Analyste (Réseau neuronal graphique – GNN) Le marché n'est pas constitué de barres de prix individuelle
Adaptive Price Action Engine Achetez un indicateur, obtenez l'EA gratuitement Analyse auto-optimisée des tendances et des figures de chandeliers Multi-Timeframe Les marchés évoluent constamment, et tous les modèles de Price Action n’ont pas la même valeur dans toutes les conditions de marché. Adaptive Price Action Engine a été conçu pour s’adapter aux changements du marché en combinant structure de tendance, analyse Multi-Timeframe, figures de chandeliers et optimisation statistique au sein d’un
Présentation       Quantum Breakout PRO   , l'indicateur révolutionnaire MQL5 qui transforme la façon dont vous négociez les zones d'évasion ! Développé par une équipe de traders expérimentés avec une expérience commerciale de plus de 13 ans,       Évasion quantique PRO       est conçu pour propulser votre parcours commercial vers de nouveaux sommets grâce à sa stratégie de zone de discussion innovante et dynamique. Quantum Breakout Indicator vous donnera des flèches de signalisation sur les z
Trend Catcher ind mt5
Ramil Minniakhmetov
5 (18)
INDICATEUR DE DÉTECTEUR DE TENDANCE L'indicateur de détecteur de tendance analyse les mouvements de prix du marché grâce à une combinaison d'indicateurs d'analyse de tendance adaptatifs, propriétaires et personnalisés. Il identifie la véritable direction du marché en filtrant les fluctuations à court terme et en se concentrant sur la force de la dynamique sous-jacente, l'expansion de la volatilité et la structure des prix. Il utilise également une combinaison d'indicateurs personnalisés de lis
Quant Direction MT5
Georgios Kalomoiropoulos
Quant Direction est un outil d'analyse de marché 3D. Il fournit une analyse de marché parfaitement objective, basée sur un algorithme, en calculant des écarts précis en pourcentage sur différents paramètres. Développé à l'aide d'outils de modélisation avancés basés sur l'IA et soumis à des tests rigoureux, cet algorithme analyse le marché avec une précision inégalée. Vous pouvez analyser n'importe quelle paire de devises ou instrument financier sur la plateforme. Que vous pratiquiez le trading à
Quantum TrendPulse
Bogdan Ion Puscasu
5 (26)
Présentation de   Quantum TrendPulse   , l'outil de trading ultime qui combine la puissance de   SuperTrend   ,   RSI   et   Stochastic   dans un seul indicateur complet pour maximiser votre potentiel de trading. Conçu pour les traders qui recherchent précision et efficacité, cet indicateur vous aide à identifier les tendances du marché, les changements de dynamique et les points d'entrée et de sortie optimaux en toute confiance. Caractéristiques principales : Intégration SuperTrend :   suivez f
Atomic Analyst MT5
Issam Kassas
4.47 (60)
Atomic Analyst — MetaTrader 5 Après votre achat, envoyez-moi un message sur MQL5 pour recevoir GRATUITEMENT Smart Universal Expert Advisor, ainsi que le cours en ligne, le manuel PDF et l’accès au groupe privé. Atomic Analyst réunit l’action des prix, la direction de la tendance, les signaux d’entrée et de sortie, le Stop Loss et plusieurs niveaux de Take Profit directement sur votre graphique. REPÉREZ LE SIGNAL. COMPRENEZ LA CONFIGURATION. Atomic Analyst présente son analyse sous forme d’inform
Btmm state engine pro
Garry James Goodchild
5 (4)
BTMM State Engine Pro by G-Labs — Beat The Market Maker indicator for MetaTrader 5. Asian session range, London and New York kill zones, level progression (L1/L2/L3), peak formation detection (PFH/PFL), entry signals, and a multi-pair scanner from one chart. Stop scanning charts one pair at a time. The State Engine tracks the BTMM daily cycle automatically — Asian box, room boundaries, level blocks, peak formations, and filtered entries — while the scanner dashboard shows level, peak status, d
Plus de l'auteur
Bubbles CVD
Kettani abdouessalam
Bubbles — order flow bubbles + CVD Tick-level order flow made visible: every trade becomes a bubble, cumulative delta reads in a separate window. Short description   Bubbles plots real order flow directly on the chart: one bubble per trade, size scaled to volume, colour set by the aggressor side. A sub-window tracks session cumulative delta, exposing divergence and absorption as they build. Full description Bubbles reads the native tick stream ( TICK_FLAG_BUY / TICK_FLAG_SELL , volume_real ) a
VWAP session
Kettani abdouessalam
VWAP — Volume Weighted Average Price The Volume Weighted Average Price (VWAP) is a trading indicator that calculates the average price of an asset weighted by its trading volume over a specified period. It represents the true average price at which the asset has traded. VWAP is widely used by traders to: Identify trend direction Price above VWAP = bullish bias, Price below VWAP = bearish bias. Find dynamic support and resistance VWAP often acts as a magnet for price, especially during ranging
Footprint Edge
Kettani abdouessalam
Footprint Visual Order flow footprint chart, drawn directly in the main window, sharing the real price scale of your candles. Short description (for the Market listing) Footprint Visual draws a real bid/ask footprint — buy and sell volume per price level, POC, Value Area and net delta — for each of the most recent bars, right next to your candles. Built on genuine volume_real tick data (not tick-count approximations), it works on any symbol whose broker feed reports real trade volume, and is tun
Stacked Imbalances - Footprint Order Flow Indicator Take your order flow analysis to the next level. This professional tool automatically detects and highlights Stacked Imbalances directly on the Footprint chart, helping you identify strong institutional buying and selling pressure with precision. What is a Stacked Imbalance? A standard imbalance occurs when the Bid or Ask volume at one price level is significantly larger than the opposite side, showing aggressive buying/selling. A Stacked Imbal
CVD divergences
Kettani abdouessalam
Real CVD Light plots Cumulative Volume Delta as candles (Open / High / Low / Close) in a separate window. It is built tick by tick from real trade data, and it detects divergences between price and CVD. What it does Builds CVD candles from real tick flags (BUY / SELL) and real trade volume. Updates incrementally on every tick, so the live candle stays fast and accurate. Detects confirmed pivots on price (fractal highs and lows) and compares them with the CVD at the same pivots. Finds four types
CVD Bubbles RealTime — Order flow, absorption and CVD divergences CVD Bubbles RealTime reads tick data and builds a real-time view of order flow: a cumulative delta (CVD) candle chart in a sub-window, volume bubbles on the price chart, absorption detection and CVD/price divergences. MAIN FEATURES 1) CVD candles (sub-window) - Cumulative Volume Delta drawn as candles: open = previous close, with real   intrabar highs/lows on the live bar. - Green = buyers dominate, red = sellers dominate, yel
Filtrer:
Aucun avis
Répondre à l'avis