Price Action 6 Pattern Pro

Price Action 6 Pattern Pro

Price Action 6 Pattern Pro is a MetaTrader 5 technical indicator that automatically detects and visualizes six classical Price Action patterns directly on the chart.

The indicator is designed for market analysis. It does not open, modify or close trades. Signals are generated from confirmed price structures and can be displayed as arrows, text labels and optional graphical pattern structures.

The indicator detects:

  • Inside Bar Breakout
  • Outside Bar
  • Pivot Point Reversal (PPR)
  • Move-Congestion-Move (MCM)
  • 1-2-3 Reversal
  • 2B Reversal

Signals are evaluated on closed bars.

Main Features

  • 6 Price Action pattern models in one indicator
  • Bullish and bearish signal detection
  • Closed-bar signal confirmation
  • Interactive on-chart control panel
  • Individual ON/OFF control for every pattern
  • Global BULL and BEAR filters
  • Confluence mode
  • Signal counters for each pattern
  • Last detected signal information
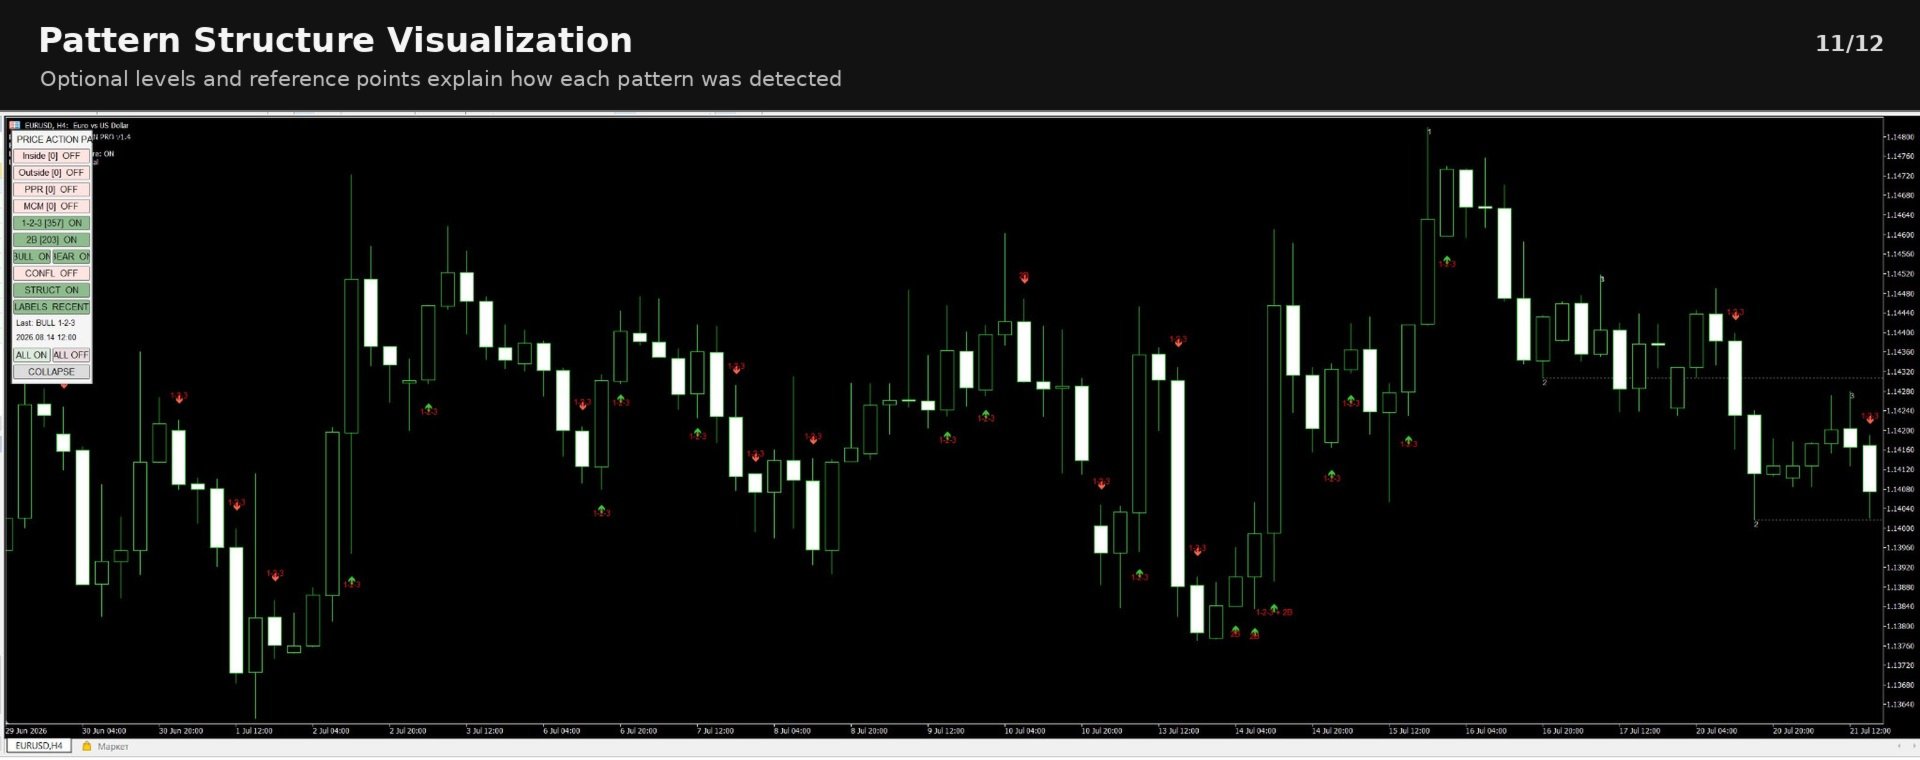
  • Optional pattern structure visualization
  • Signal label modes: OFF, RECENT and ALL
  • Popup, push and email notifications
  • Historical signal display
  • Panel state memory when changing timeframe
  • Collapsible control panel
  • Indicator buffers for external access
Pattern Detection Logic

Inside Bar Breakout

The Inside Bar model identifies a candle whose range is contained within the range of a previous mother bar.

After the Inside Bar structure is detected, the indicator waits for a breakout of the reference range.

A bullish pattern is confirmed when price breaks above the relevant upper boundary.

A bearish pattern is confirmed when price breaks below the relevant lower boundary.

The maximum number of bars allowed between the Inside Bar and the breakout can be configured.

Main parameters:

  • InsideBreakoutMaxBars
  • InsideRequireCloseBreak

When structure visualization is enabled, the reference range can be displayed directly on the chart.

Outside Bar

The Outside Bar model identifies a candle that expands beyond the high and low of the previous candle.

The indicator can additionally require the candle to close beyond the previous range before the signal is confirmed.

Bullish and bearish Outside Bar signals are evaluated separately.

Main parameter:

  • OutsideRequireCloseBeyond

PPR — Pivot Point Reversal

PPR is a three-bar reversal structure.

The middle candle forms the relevant local extreme, while the following candle provides confirmation of the reversal structure.

The model can be configured to require the middle candle to form the actual local high or low of the three-bar sequence.

Main parameter:

  • PPRRequireMiddleExtreme

The indicator detects bullish and bearish PPR structures independently.

MCM — Move-Congestion-Move

MCM is a continuation structure consisting of three stages:

Move → Congestion → Move

The first stage represents a directional impulse.

The second stage represents temporary price compression or congestion.

The final stage represents continuation in the direction of the original move.

The detector evaluates both volatility and candle-body characteristics.

Main parameters:

  • MCMMinMoveATR
  • MCMMinBodyRatio
  • MCMMaxCongestionRangeRatio
  • MCMMaxCongestionBodyRatio

These settings define the required strength of the move and the maximum size of the congestion phase.

1-2-3 Reversal

The 1-2-3 model is based on three swing points.

For a bullish structure:

  1. Point 1 forms a market low.
  2. Point 2 forms a corrective high.
  3. Point 3 forms a higher low.
  4. The pattern is confirmed when price breaks above Point 2.

For a bearish structure, the logic is reversed.

The indicator automatically detects pivot points and evaluates the geometry of the complete structure.

Main parameters:

  • PivotLeftBars
  • PivotRightBars
  • PivotSearchBars
  • Min123LegATR
  • Max123Bars

When structure visualization is enabled, Points 1, 2 and 3 and the Point 2 breakout level can be displayed on the chart.

2B Reversal

The 2B model detects a false breakout of a previous market extreme.

A bearish example:

  1. A previous high is identified.
  2. Price later trades above this high.
  3. The breakout fails.
  4. Price closes back below the previous high.

A bullish 2B uses the opposite logic around a previous low.

Main parameters:

  • TwoBExtremeLookback
  • TwoBMinPullbackBars
  • TwoBMaxPullbackBars
  • TwoBMinBreakATR
  • TwoBRequireCloseBackInside

When structure visualization is enabled, the reference extreme and false-break level can be shown on the chart.

Interactive Control Panel

The indicator includes an on-chart control panel.

The following pattern models can be switched independently:

  • Inside
  • Outside
  • PPR
  • MCM
  • 1-2-3
  • 2B

Each button displays its current state:

ON — the pattern is visible and active in the display.

OFF — the pattern is hidden.

The number shown next to each pattern represents the number of currently displayed detections within the analyzed history.

Example:

Inside [48] ON

PPR [17] OFF

2B [23] ON

Bullish and Bearish Filters

The panel contains global direction controls:

  • BULL
  • BEAR

These controls make it possible to display only bullish signals, only bearish signals, or both.

Example:

BULL ON

BEAR OFF

In this configuration only bullish detections remain visible.

These controls affect signal display and do not change the underlying pattern definitions.

Confluence Mode

The CONFL button enables Confluence Mode.

When Confluence Mode is active, the indicator displays only bars where several enabled pattern models detect a structure in the same direction.

The minimum required number of matching patterns is controlled by:

MinConfluencePatterns

Default:

2

Examples of possible confluence:

  • PPR + 2B
  • Inside Bar + 1-2-3
  • Outside Bar + PPR

Bullish and bearish confluence are evaluated independently.

Confluence indicates agreement between several enabled detection models. It does not represent a guaranteed or statistically predefined probability of future price movement.

Pattern Structure Visualization

The STRUCT button enables or disables graphical pattern structure.

When enabled, the indicator may display reference points or levels associated with the detected model.

Examples:

  • mother-bar range for Inside Bar
  • reference range for Outside Bar
  • PPR three-bar structure
  • Move/Congestion/Move elements
  • Points 1, 2 and 3 for 1-2-3
  • reference extreme for 2B

Historical structure depth is controlled by:

StructureHistoryBars

Structure visualization is disabled by default to keep the chart clean.

Signal Labels

The LABELS button cycles between three modes:

OFF

Pattern names are hidden.

Signal arrows can remain visible.

RECENT

Pattern names are displayed only on the most recent part of the chart.

The historical depth is controlled by:

LabelHistoryBars

ALL

Pattern names are displayed throughout the analyzed history.

For performance protection, the maximum number of text objects can be limited by:

MaxLabelObjects

Last Signal

The control panel shows the most recent currently visible detection.

Example:

Last: BEAR 2B

2026.08.14 12:00

If several models detect confluence on the same bar, more than one pattern name can be displayed.

Example:

Last: BULL PPR + 2B

Panel State Memory

When:

RememberPanelState = true

the indicator remembers the current panel configuration when the chart timeframe is changed.

The following states are preserved:

  • individual pattern switches
  • BULL filter
  • BEAR filter
  • Confluence Mode
  • Structure display
  • Label mode
  • collapsed or expanded panel state
Compact Mode

The panel can be collapsed using the COLLAPSE button.

When collapsed, only a compact expand control remains visible.

This allows the user to keep the chart clear while keeping the indicator active.

Alerts

The indicator supports:

  • MetaTrader popup alerts
  • push notifications
  • email notifications

Notification types can be enabled or disabled independently in the Inputs.

Push notifications and email require the corresponding MetaTrader 5 terminal settings to be configured by the user.

General Inputs

HistoryBars

Defines the number of historical bars used for pattern analysis and visualization.

A larger value provides a deeper signal history but may increase processing and graphical load.

ATRPeriod

ATR period used by models that normalize price movements relative to current volatility.

Default:

14

DetectBullish

Enables bullish pattern detection.

DetectBearish

Enables bearish pattern detection.

Common Detection Parameters

EqualityToleranceATR

ATR-based tolerance used when comparing structural price levels.

It prevents pattern detection from depending on exact price equality.

BreakBufferATR

Optional ATR-based buffer required beyond a breakout level.

A value of 0 means no additional breakout distance is required.

ArrowOffsetATR

Controls the visual distance between a signal arrow and the corresponding candle.

This parameter affects chart appearance only.

Suggested Use

Price Action 6 Pattern Pro can be applied to different symbols and timeframes.

Lower timeframes generally produce a larger number of detected structures, while higher timeframes usually produce fewer and more widely separated patterns.

The appropriate timeframe and parameter configuration depend on the user's own analysis method, instrument and market conditions.

Important Information

Price Action 6 Pattern Pro is a technical analysis tool.

It does not:

  • open trades
  • close trades
  • modify positions
  • manage money or risk
  • guarantee profitable signals
  • predict future price movement
  • guarantee that a detected pattern will lead to a reversal or continuation

A displayed signal means only that the corresponding price structure satisfied the configured detection conditions.

Trading decisions and risk management remain the responsibility of the user.

Demo Version

The MQL5 Market demo version can be evaluated in the MetaTrader 5 Strategy Tester.

Use Visual Mode to inspect:

  • historical pattern detection
  • arrows and labels
  • pattern structure
  • control panel
  • BULL and BEAR filters
  • Confluence Mode
  • pattern counters
  • LABELS modes
  • STRUCT mode

MQL5 Market demo products are restricted to the Strategy Tester by the platform.


おすすめのプロダクト
Crypto_Forex インジケーター「インサイドバーとアウトサイドバーパターン」MT5用。再描画なし、遅延なし。 - インジケータ「インサイドバーとアウトサイドバーパターン」は、プライスアクション取引に非常に強力です。 - インジケータは、チャート上のインサイドバーとアウトサイドバーパターンを検出します。 - 強気パターン - チャート上の青い矢印信号(画像を参照)。 - 弱気パターン - チャート上の赤い矢印信号(画像を参照)。 - インサイドバー自体の R/R 比率(報酬/リスク)が高い。 - PC & Mobile alerts. - インジケータ「インサイドバーとアウトサイドバーパターン」は、サポート/レジスタンスレベルと組み合わせるのに最適です。 高品質のトレーディングロボットとインジケーターをご覧になるにはここをクリックしてください! これは、この MQL5 ウェブサイトでのみ提供されるオリジナル製品です。
How it works No RSI, no stochastic. VectorMomentum measures momentum three independent ways and demands agreement: –   Regression-slope t-statistic — a linear regression on log price over N bars; the t-stat of the slope (slope divided by its standard error) gives statistically-significant momentum that self-normalizes across symbols and volatility levels. –   Volume-pressure-weighted rate of change — ROC weighted by relative tick volume, so momentum on dead volume scores lower than the same move
Crypto_Forex MT5用インジケーター「ピンバー&アウトサイドバーパターン」。リペイント不要、遅延なし。 - インジケーター「ピンバー&アウトサイドバーパターン」は、プライスアクション取引に非常に効果的です。 - インジケーターはチャート上のピンバーとアウトサイドバーパターンを検出します。 - 強気パターン - チャート上の青い矢印シグナル(画像参照)。 - 弱気パターン - チャート上の赤い矢印シグナル(画像参照)。 - PC, Mobile alerts. - インジケーター「ピンバー&アウトサイドバーパターン」は、サポートレベル/レジスタンスレベルと組み合わせるのに最適です。 高品質のトレーディングロボットとインジケーターをご覧になるにはここをクリックしてください! これは、このMQL5ウェブサイトでのみ提供されるオリジナル製品です。
Reversal Wick Zones Non-repainting reversal zones built from confirmed Engulfing candles. Reversal Wick Zones is a clean, lightweight MT5 indicator that highlights potential reaction areas on your chart, based on Engulfing candlestick patterns that occur at market swing (turning) points. How it works The indicator scans price for swing highs and swing lows — the turning points in price. Around each swing point, it looks for an Engulfing candle pair — a candle whose body fully engulfs the previou
How it works An inducement trap is a sequence, not a candle pattern. TrapRadar's state machine requires all four legs: –   Bait — an obvious level forms (minor swing, equal highs/lows, range boundary) that retail will trade the breakout of. –   Trigger — price breaks the level and actually attracts participation; relative volume rises on the breakout bar, confirming traders took the bait. –   Trap spring — within K bars a displacement candle (range greater than 1.5× ATR, closing 70%+ through its
[ MT4 Version ]  [ Kill Zones ]  [ SMT Divergences ] Order Blocks ICT Multi TF - FVG-Confirmed Order Blocks for MT5 Most ICT order block indicators for MT5 turn every opposite candle into an order block. The chart fills up and the label stops meaning anything. Order Blocks ICT Multi TF uses Fair Value Gap confirmation and monitors up to four timeframes from one chart. It is built for traders who want a defined reason for the block, not another coloured rectangle. GIVE THE BLOCK A REASON TO MATTE
The Bheurekso Pattern Indicator for MT5 helps traders automatically identify candlestick pattern that formed on the chart base on some japanese candle pattern and other indicator to improve accurate. This indicator scans all candles, recognizes and then displays any candle patterns formed on the chart. The candle displayed can be Bullish or Bearish Engulfing, Bullish or Bearish Harami, and so on. There are some free version now but almost that is repaint and lack off alert function. With this ve
The Optimized MACD Divergence indicator is a powerful tool designed to identify potential trading opportunities by detecting divergences between price action and the MACD indicator. It combines classic divergence analysis with candlestick pattern recognition and volume filtering to provide more accurate and reliable signals. How it Works The indicator operates on the following principles: MACD Calculation:   It calculates the MACD indicator using user-defined parameters for fast EMA, slow EMA,
The indicator identifies two most important patterns of technical analysis - Pin Bar and Engulfing. MT4-version:    https://www.mql5.com/en/market/product/53591 Settings: Mincandle size for PinBar   - The minimum size of the Pin-Bar candlestick; Percentage of candle body on size   - The percentage of the candle body in relation to its length; PinBar Alert   - Alert when a Pin-Bar is detected; PinBar Mail   - Sends an email when a Pin Bar is found; PinBar Notification   - Sends a push notificati
ユーザーマニュアル:SROインテリジェントマーキングシステム 1. はじめに SROインジケーターは、プライスアクションおよびSMCトレーダー向けに設計されたMetaTrader 5用のダイナミック描画ツールです。その優れた点は、その明瞭な視覚効果です。将来のみを予測する重要なレベルを描画できるため、チャート履歴全体を横切るラインを回避できます。また、各オブジェクトには、作成された時間枠が自動的にラベル付けされます。 2. クイック実行コマンド このシステムはホットキーで操作します。希望の価格にマウスを合わせ、以下のキーを押すだけです。 「S」キー(サポート):カーソルから右に水平線を描画します。底値や需要ゾーンのマーキングに最適です。 「R」キー(レジスタンス):水平の天井線を描画します。供給ゾーンと高値を識別するのに使用します。 「O」キー(注文ブロック):選択したローソク足を自動的に囲みます。高値、安値、そして損益分岐点または機関投資家にとって最も敏感な領域を表す中心線(50%)を描画します。 3. パラメータ設定 入力メニューでは、コードに触れることなく表示をカスタ
カップとハンドルのパターンは、カップとハンドルに似た技術的な価格構成です。カップは「U」字型で、ハンドルにはわずかに下向きのドリフトがあります。パターンの右側-ハンドル-は左側-cup-より小さく、上から50%以内に戻ります。継続パターンと反転パターンの両方があります。 [ インストールガイド | 更新ガイド | トラブルシューティング | よくある質問 | すべての製品 ] クリアな取引シグナル カスタマイズ可能な色とサイズ パフォーマンス統計を実装します カスタマイズ可能なサイズとパターン特性 適切なストップロスおよび利益レベルを表示します 再描画および非再描画ではありません 電子メール/音声/視覚アラートを実装します 入力パラメータ 振幅:振幅は、代替価格ポイント間のバーの最小量を表します。大きなパターンを見つけるには、振幅パラメーターを大きくします。小さなパターンを見つけるには、振幅パラメーターを小さくします。 カップの平坦度比:このパラメーターは、カップの上部がカップのサイズに対してどの程度「平坦」でなければならないかを示します。値を大きくすると、パターンはより厳密になりま
Usdjpy Trend Follower
Marcos Ramon Aparicio Pelaez
バックテストされた堅牢な MetaTrader 5 ロボットを使用して、USDJPY を自動的に取引します。Momentum Master H1 は、動的な Bulls Power と ATR ベースのエントリに基づいた高確率のロングオンリー戦略を使用します。主な機能は次のとおりです: タイムテスト済み: H1 チャートで 2019–2025 年からバックテスト済み。 精密エントリー: 短期的なプルバックと確認されたトレンドシグナルに基づいてトリガーされるロングトレード。 スマートなリスク管理: 適応サイジングのための ATR ベースのストップロスおよび利益目標。 柔軟な取引時間: 週を通して動作し、セッション制限を設定できます。 簡単な統合: ブローカー制限がなく、MT4 用に最適化されています。 自動化された規律でトレンドの捕捉を最大化します – USDJPY で長期のみのモメンタム戦略を求めるトレーダーに最適です。
これはほぼ間違いなく、MetaTraderプラットフォームで見つけることができる最も完全な調和価格形成自動認識インジケーターです。 19種類のパターンを検出し、フィボナッチプロジェクションをあなたと同じように真剣に受け止め、潜在的逆転ゾーン(PRZ)を表示し、適切なストップロスとテイクプロフィットレベルを見つけます。 [ インストールガイド | 更新ガイド | トラブルシューティング | よくある質問 | すべての製品 ] 19の異なる調和価格形成を検出します プライマリ、派生および補完フィボナッチ投影(PRZ)をプロットします 過去の価格行動を評価し、過去のすべてのパターンを表示します この指標は、独自の品質とパフォーマンスを分析します 適切なストップロスとテイクプロフィットのレベルを表示します ブレイクアウトを使用して適切な取引を通知します すべてのパターン比をグラフにプロットします 電子メール/音声/視覚アラートを実装します スコット・M・カーニーの本に着想を得て、この指標は最も純粋で急を要するトレーダーのニーズを満たすように設計されています。ただし、トレードを容易にする
OBOS indicator OBOS Indicator is an exclusive indicator to spot entries based on price action. The OBOS Indicator is both effective and user friendly. Indicator uses simple color codes and levels to indicate Overbought and Oversold conditions. No more headache. The OBOS Indicator will only gives you indication when there are possible entries. Means you only get useful information. Inputs of the indicator are: MaxBars : number of bars to display in your chart Smoothing period : number of b
This indicator will help traders quickly identify inside bars, which are often used in price action trading strategies as potential consolidation or continuation patterns. An inside bar formation is a counter trend candle on both sides as it didn't break the previous candle high or low. Key feature: Identify inside bars in real-time. Colours inside bars while keeping normal bars. Configurable history bars. Optional pop-up alerts and phone notifications with symbol name and time of detection. W
Aurum Swing Grid Signals for MT5 Aurum Swing Grid Signals for MT5 is a clean and practical MetaTrader 5 indicator designed to help traders identify confirmed swing high and swing low areas on the chart. It displays clear buy and sell signal arrows together with visual grid-distance guide lines, making it easier to analyze possible entry zones, take-profit levels, and structured price movement around swing points. This indicator is especially designed for XAUUSD / Gold M1 analysis , but it may al
Простой индикатор тренда в NRTR виде с отрисовкой линий стоплосса и тейпрофита, цвет и направление движения которых определяются действующим трендом. Индикатор имеет возможность подавать алерты, отправлять почтовые сообщения и push-сигналы при смене направления тренда. Следует учесть что значение входного параметра индикатора Deviation of the take profit line in points для каждого финансового актива на каждом таймфрейме   необходимо подбирать индивидуально!
Все паттерны из книги Томас Н. Булковский "Полная энциклопедия графических ценовых моделей" в одном индикаторе со сканером. Cканер включается параметром ScannerMode. При ScannerMode=false индикатор ищет один паттерн (выбирается переменной Pattern). При выявлении паттерна индикатор рисует стрелку, открывает окно сообщений, выполняет push-уведомление. У индикатора много параметров, некоторые их них задействованы всегда, некоторые выборочно. Включите переменную ShowHelp - на графике отобразится по
Wyckoff Schematic Detector Accumulation Distribution Spring UTAD Automatically detects and labels the classic Wyckoff accumulation and distribution sequence — PS, SC, AR, ST, Spring, SOS, LPS and the distribution mirror PSY, BC, AR, ST, UTAD, SOW, LPSY — from price structure combined with volume and bar range analysis. Draws the trading range, marks each event on the bar where it occurred, and alerts on new events. Everything is evaluated on closed bars only, so nothing repaints. Automate the Wy
The Market Flow Tracker indicator is a professional technical tool designed to visualize local shifts in market momentum. Its algorithm is based on a combination of price extreme filtering via Moving Averages and dynamic Volume analysis. The indicator identifies specific patterns where price breaks through averaged High/Low levels while being supported by volume confirmation. This helps the trader identify potential moments of short-term trend continuation or exhaustion. Key Features : Volatilit
A machine translation from English product description was used. We apologies for possible imprecisions. 英語の製品説明からの機械翻訳が使用されました。   不正確な可能性があることをお詫び申し上げます。 お気に入りのろうそく足の価格アクションパターンの視覚化システム。 アタッチされると、インジケーターはチャート上の次のパターンを自動的にマークします。 ピノキオバー - 長い「鼻」を持つ小さなボディのバー、非常によく知られている逆のパターン。 内側のバー - 範囲が前のバーの範囲内にあるバー。   それは市場の不確実性を表しています。 外側のバー - 範囲が前のバーの範囲を超えるバー。   それは市場の不確実性を表しています。 レールパターン - ほぼ等しく、より大きなボディを持つ 2 つの結果として生じる反対側のバー。   逆のパターン。これは、より高い時間枠のピノキオバーパターンと実際に一致します。 マスターキャンドル パターン - キャンドルの 5 つ、後続の 4 つのキャンド
Apollo Supply Demand Zones   は、サポートとレジスタンスのレベルを計算する指標です。このインジケーターは、使用する戦略に関係なく、すべてのトレーダーにとって絶対に役立ちます。この指標は、取引システムの主要な要素の 1 つになる可能性があります。このインジケーターは、現在の時間枠でレベルを計算し、MTF モードで動作して、より高い時間枠からのレベルを表示できます。この指標は、任意の時間枠で、任意の取引商品で絶対に使用できます。インジケーターは、実際に市場の全体像を表示するさまざまなタイプのレベルを示します。このインジケーターは音声アラートを提供するため、このインジケーターの操作が非常に 購入後、必ず私に書いてください!インジケーターの使用に関する推奨事項を共有します。あなたを待っている素晴らしいボーナスもあります!
TL Method — Automatic Trendline Detection & Strength Indicator Tired of drawing trendlines manually? TL Method does it for you — automatically detecting, drawing, and scoring trendlines in real time. What it does: Scans up to 1000 bars to find valid support and resistance trendlines Scores each trendline by counting confirmed anchor touches Generates buy/sell signal arrows when price approaches strong trendlines Alerts you via popup, push notification, or sound — with smart cooldown to avoid spa
Reversal Identifier MT5 - チャート上の反転ポイントを検出できるインジケーターです。 再描画や遅延なしで動作し、フラクタルピークとトラフを識別し、反転ポイントを矢印で表示します。 このインジケーターは、トレンドの方向転換や調整が起こる前の早期反転ポイントを特定します。 このインジケーターの最適な使用方法は、2つの時間足を使用することです。上位時間足でトレンドを判断し、下位時間足でエントリーシグナルを受け取ります。 このインジケーターは単独で使用することも、他のインジケーターやトレーディングシステムと組み合わせて使用​​することもできます。 "Filter level" は、矢印の表示頻度を調整するパラメーターで、1 から 5 の範囲で設定できます。これにより、矢印の表示頻度を制御し、リスクと機会を調整できます。 あらゆる金融商品で使用できるように設定されています。 適切な時間足は、M5、M15、M30、H1、H4です。青色の矢印は下降反転、赤橙色の矢印は上昇反転を示します。 このインジケーターは再描画しません。矢印はローソク足の終値で固定されます。 矢
MT5用「ダブル・シューティングスター・パターン」インジケーター(リペイントなし・遅延なし) - 「ダブル・シューティングスター・パターン」は、プライスアクション・トレードにおいて非常に強力なインジケーターであり、特に下降トレンドの相場に適しています。 - チャート上で、稀ではあるものの有効性の高いパターンである「弱気(ベアリッシュ)ダブル・シューティングスター」を検知します。 - 弱気ダブル・シューティングスター・パターン:チャート上に赤い矢印のシグナルが表示されます(画像をご参照ください)。 - PCおよびモバイルへの通知機能を搭載しています。 - 「ダブル・シューティングスター・パターン」は、サポートラインやレジスタンスラインと組み合わせて使用​​するのに最適です。 - シグナル矢印には4種類のスタイルが用意されています。 Click here to see high quality Trading Robots and Indicators! 本製品は、このMQL5ウェブサイトでのみ提供されているオリジナル商品です。
Titan Action HUD Titan Action HUD, MetaTrader 5 terminali içinde piyasa izlemeyi optimize etmek için tasarlanmış kapsamlı çok zaman dilimli analitik bir gösterge panelidir. Birden fazla dönemden alınan gerçek zamanlı teknik verileri tek bir ekrana toplayarak, çeşitli grafikler arasında sürekli geçiş yapma ihtiyacını ortadan kaldırır. Panel, piyasa ortamlarını sürekli tarar, yapısal trendleri, hacim metriklerini ve aktif işlem oturumlarını birleşik bir görsel matriks içinde gösterir. 6.10 sürümün
グラフィック分析のためのインジケーター。 チャート上の主要な日本のローソク足パターンをマークします。 現在、トレーダーは次のパターンのセットを利用できます。  - Bearish/Bullish Abandoned Baby;  - Bearish Advance Block;  - Bearish Deliberation;  - Bearish/Bullish Belt Hold;  - Bearish/Bullish Engulfing;  - Bearish Shooting Star;  - Bearish Evening Star;  - Bearish Evening Doji Star;  - Bearish/Bullish Doji Star;    - Bearish/Bullish Tri-Star;  - Bearish Hanging Man;  - Bearish/Bullish Harami;  - Bearish/Bullish Harami Cross;  - Bearish Two Crows;  - Bearish Identical Three
RBreaker Gold Indicatorsは、金先物の短期日内取引戦略であり、トレンドフォローと日内反転の2つの取引手法を組み合わせたものです。トレンド相場での利益を捉えるだけでなく、相場が反転した際には迅速に利確し、その流れに沿ってポジションを反転させることができます。 この戦略は、アメリカの雑誌『Futures Truth』において、15年連続で最も収益性の高い取引戦略トップ10に選ばれた実績を持ち、非常に長いライフサイクルを誇り、現在も国内外で広く使用・研究されています。 本インディケーターは、2026年の金先物の値動きに対応し、14日間のATR指標に基づいて、ブレイクアウト係数A、観察係数B、リバーサル係数Rをより合理的な値で定義しています。非常に優れたインディケーターであり、安定的な年間収益を実現しています。ぜひおすすめします〜
Elliott Wave Hunter - SMC Edition Elliott Wave Hunter identifies Elliott Wave 2 and Wave 5 setups and combines them with Smart Money Concepts to filter entries to high-probability zones only. Wave 2 signals mark continuation entries in the direction of the dominant Wave 1 impulse. The indicator waits for the retracement to confirm, locates an Order Block, Fair Value Gap or Liquidity Sweep zone within the impulse, then triggers only when price returns to retest that zone with a qualifying revers
Confluence Edge Indicator Confluence Edge Indicator is a powerful all-in-one technical analysis tool designed to provide a complete multi-timeframe view of market conditions. It removes the need for multiple chart indicators by combining proven trading methodologies into a single, clean, intuitive dashboard. Built for traders who rely on confluence, this indicator delivers real-time analysis using price action, volume, momentum, market structure, and algorithmic scoring concepts. It is designed
このプロダクトを購入した人は以下も購入しています
この製品は 2026 年の市場向けに更新され、最新の MT5 ビルドに最適化されています。 価格更新のお知らせ: Smart Trend Trading System は現在 $99 で提供されています。 次の 30 件の購入 後、価格は $199 に上がります。 特別オファー: Smart Trend Trading System を購入後、私にプライベートメッセージを送ることで、 Smart Universal EA を無料 で受け取り、Smart Trend のシグナルを自動売買に変えることができます。 Smart Trend Trading System は、リペイントなし、再描画なし、遅延なしの完全なトレーディングシステムです。よりクリーンなシグナル、より明確なトレンド方向、そしてより整理された取引方法を求めるトレーダー向けに作られています。   [User Manual]   ,  [PDF]  ,   [Installation manual]   and  [Online course] このシステムは、トレンド検出、反転ゾーン、Smart Cloud、トレーリングス
Trend Sniper X
Sarvarbek Abduvoxobov
5 (10)
Trend Sniper X は、MetaTrader 5 用のマルチタイムフレーム・トレンドフォロー・インジケーターです。トレーダーがトレンドの方向性と反転ポイントを明確かつ正確に特定できるよう支援します。 価格情報: 現在の価格はキャンペーン価格であり、今後のアップデートや新機能のリリースに伴い変更される可能性があります。 Code2Profit チャンネル マルチタイムフレーム分析で市場をマスターしよう! 技術仕様 プラットフォーム MetaTrader 5 インジケータータイプ マルチタイムフレーム・トレンドインジケーター 操作タイムフレーム あらゆるチャートタイムフレームに対応。個別に選択可能な上位タイムフレーム (M1–MN1) を搭載 主要銘柄 FX、ゴールド (XAUUSD)、およびその他のCFD 推奨口座 あらゆる口座タイプに対応 視覚化 色分けされたトレンドローソク足 (買い/売り/弱気/変化) + 買い/売り矢印 追加モジュール セッション市場ボックス (シドニー、東京、ロンドン、ニューヨーク) 主な機能 マルチタイムフレーム・トレンド分析: 上位タイムフレームの
Welcome to ENTRY IN THE ZONE AND SMC MULTI TIMEFRAME Entry In The Zone and SMC Multi Timeframe is a real-time market analysis tool based on Smart Money Concepts (SMC), designed to analyze market structure, price direction, and key trading zones. It supports both Single-Timeframe Analysis and Multi-Timeframe Analysis, providing a clearer view of the overall market structure across multiple timeframes, with real-time BUY / SELL signals that do not repaint. It is designed to help filter trading opp
SuperScalp Pro
Van Minh Nguyen
4.61 (31)
SuperScalp Pro – プロフェッショナル多層コンフルエンス・スキャルピングシステム SuperScalp Pro は、複数のコンフルエンスを組み合わせたプロフェッショナル向けスキャルピングシステムです。より高い確率のトレードチャンスを見つけられるよう設計されており、明確なエントリー確認、ATRに基づくStop LossとTake Profit、さらにXAUUSD、BTCUSD、主要なFX通貨ペアに対応した柔軟なシグナルフィルター機能を提供します。 完全なドキュメントは製品ブログにあります: [User Guide] SuperScalp Pro Auto Trader EA による自動売買が利用可能です: [Auto Trader] SuperScalp Pro のトレードロジックを基に開発されたゴールド自動スキャルピングEA: [SuperScalp Gold] SuperScalp Pro は、Supertrend、VWAP、EMA、RSI、ADX、出来高分析、ボリンジャーバンド、MACDダイバージェンスを組み合わせ、低品質なトレードセットアップをフィルタリングし
時折、私自身もこのシステムを使って取引を行っています。 実口座での私の手動による「BOMBER」トレードをぜひご評価ください - LIVE SIGNAL このインジケーターを購入された方には、以下の特典を 無料 で提供しています: 各トレードを自動で管理し、ストップロスとテイクプロフィットを設定し、戦略ルールに基づいてポジションを決済する補助ツール 「Bomber Utility」 様々な銘柄に合わせたインジケーターの設定ファイル(セットファイル) 「最小リスク」、「バランスリスク」、「待機戦略」 の3つのモードで使用できる Bomber Utility 用の設定ファイル このトレーディング戦略をすぐに導入・設定・開始できる ステップバイステップのビデオマニュアル ご注意: 上記の特典を受け取るには、MQL5のプライベートメッセージシステムを通じて販売者にご連絡ください。 オリジナルのカスタムインジケーター 「Divergence Bomber(ダイバージェンス・ボンバー)」 をご紹介します。これは、MACDのダイバージェンス(乖離)戦略に基づいた 「オールインワン」型のトレーディン
伝説が帰ってきました:Entry Points Pro 10。 MQL5 Marketのトップ3に3年間入り続けた伝説的インジケーターの再始動です。 2つのバージョンで合計589件の高評価レビュー、毎日数千人のトレーダーが実際のトレードに使用し、デモのダウンロードは31,000件以上   MT4+MT5 。 私はこの5年間に寄せられたレビューをすべて読み、約束を並べる代わりに、その答えをバージョン10に組み込みました。1999年から相場に携わり、 誠実さ、自らの評判、そして顧客を大切にする 作者による製品です。 Entry Points Proのエントリーシグナルは、リペイント(再描画)を一切行いません。 そして今回初めて、これは作者の言葉ではなく検証可能な事実になりました。確定シグナルはローソク足の終値確定後にのみ表示され、自動テストで リペイントはゼロ と確認されています(EURUSD、XAUUSD、BTCUSDで2,486,568回の不変条件チェック、違反0件)。検証方法は公開されており、ストラテジーテスターでご自身で再現できます。 ご購入後は、必ずすぐにダイレクトメッセージでご
まず正直に言いましょう。 どんなインジケーターも、それ単体であなたを利益化させることはできません。もしそう言う人がいるなら、それは夢を売っているだけです。完璧な売買シグナル(矢印)を表示するインジケーターは、いくらでも“完璧に見せる”ことができます。正しい過去の区間を拡大して、勝ちトレードだけを切り取ればいいだけです。私たちはそれをしません。 SMC Intraday Formula はツールです。 市場構造を読み取り、最も高い確率の価格ゾーンを特定し、今この瞬間のスマートマネーの痕跡をシンプルな言葉で正確に示します。最終判断はあなたが行います。トレードを実行するのもあなたです。しかし今は「希望」ではなく「精度」でエントリーできます。 私たちはこのインジケーターを、ゴールド(XAUUSD)および主要FX通貨ペアで約3年間、日々のスキャルピングに使用してきました。M1、M5、M15、M30の主要ツールです。これは未来を予測しようとするのではなく、今まさに形成されている高確率セットアップを示し、その理由を説明します。 他のすべてのインジケーターと何が違うのか? ほとんどのトレーディングイ
Neuro Poseidon is a new indicator by Daria Rezueva. It combines precise trading signals with adaptive TP/SL levels - creating best possible trades as a result! Message me and get  Neuro Poseidon Assistant  as a gift to automize your trading process! What makes it stand out? 1. Proven profitability on all assets and timeframes 2. Only confirmed BUY and SELL signals present on the chart 3. Adaptive TP & SL levels generated by the software for each trade 4. Easy to understand - suitable for al
SUPERHEROインジケーターは、「オールインワン」方式に基づいて設計された多通貨対応の取引システムです。このインジケーターは市場を独自に分析し、取引の開始および終了のタイミングに関するシグナルを提供します。ストップロス注文とテイクプロフィット注文を使用します。R:R比率は1:1です。 私は時折、このシステムのシグナルに基づいて自ら取引を行いますが、その結果は以下の通りです— ライブシグナル このシステムはスマートフォンにプッシュ通知を送信できるため、PCに縛られることなく「外出先」からでも取引を行うことができます。自己勘定取引を行う企業に最適です。 すべてのお客様への特典: このインジケーターをご購入いただいたすべてのお客様に、私から特別なユーティリティをプレゼントいたします。その内容は以下の通りです: 自動的にストップロス注文とテイクプロフィット注文を発注します 価格が目標水準に達すると、自動的に取引を決済します 指値注文による取引に対応しています 平均化取引モードに対応しています この優れた、しかも非常に便利なユーティリティをプレゼントとして受け取りたい場合は、SUPERHER
UZFX {SSS} スキャルピング・スマートシグナル v4.0 MT5は、変動の激しい市場において正確かつリアルタイムのシグナルを求めるスキャルパー、デイトレーダー、スイングトレーダー向けに設計された、リペイントのない高性能な取引インジケーターです。(UZFX-LABS)によって開発されたこのインジケーターは、価格行動分析、トレンド確認、スマートフィルタリングを組み合わせることで、すべての通貨ペアおよび時間軸において、高確率の売買シグナル、警告シグナル、トレンド継続の機会を生成します。 トレードの判断に迷うのはもうやめましょう。明確さ、正確さ、そして規律ある市場執行を求めるトレーダーのために設計された、体系的なシグナルシステムに従い始めましょう。 私のおすすめ* 最適な時間足:15分足以上。 {H1} が私のお気に入りです。そして、その成果は驚異的です…!! 主な機能の更新 • 自動売買シグナル検出 • 高度な反転認識ロジック • 市場反転の可能性に先立つ早期警告シグナル • トレンド継続確認シグナル • エントリー、ストップロス、TP1、TP2、TP3レベルを備えた組み込み型
この製品は 2026 年の市場向けに更新され、最新の MT5 ビルドに最適化されています。 価格更新のお知らせ: Atomic Analyst は現在 $99 で提供されています。 次の 30 件の購入 後、価格は $199 に上がります。 特別オファー: Atomic Analyst を購入後、私にプライベートメッセージを送ることで、 Smart Universal EA を無料 で受け取り、Atomic Analyst のシグナルを自動売買に変えることができます。 Atomic Analyst は、リペイントなし、再描画なし、遅延なしの Price Action トレーディングインジケーターで、手動取引、シグナルの明確化、EA 自動化のために設計されています。 User manual: settings, inputs and strategy.   &   User Manual PDF . 価格行動、強さ、モメンタム、マルチタイムフレーム方向、高度なフィルターを分析し、トレーダーがノイズを減らし、弱いセットアップを避け、より構造化された取引判断を行えるようにします。 このイ
M1 SNIPER は使いやすいトレーディングインジケーターシステムです。M1時間足向けに設計された矢印インジケーターです。M1時間足でのスキャルピングのためのスタンドアロンシステムとして、また既存のトレーディングシステムの一部としても使用できます。このトレーディングシステムはM1時間足での取引に特化して設計されていますが、他の時間足でも使用できます。元々、この手法はXAUUSDとBTCUSDの取引用に設計しましたが、他の市場においても役立つと考えています。 インジケーターのシグナルは、トレンドの方向と逆方向に取引できます。インジケーターのシグナルを利用して両方向に取引するのに役立つ特別な取引テクニックをご紹介します。この手法は、特別な動的なサポートとレジスタンスの価格帯を利用することに基づいています。 ご購入後、M1 SNIPER矢印インジケーターをすぐにダウンロードできます。さらに、M1 SNIPERツールのすべてのユーザーに、以下のスクリーンショットに表示されているApollo Dynamic SRインジケーターを無料で提供しています。この2つのインジケーターを組み合わせることで
Gann Made Easy   は、ミスター・ギャンの理論を使用した取引の最良の原則に基づいた、プロフェッショナルで使いやすい外国為替取引システムです。 W・D・ガン。このインジケーターは、ストップロスとテイクプロフィットレベルを含む正確な買いと売りのシグナルを提供します。 PUSH通知を利用して外出先でも取引可能です。 ご購入後、取引方法の説明と優れた追加インジケーターを無料で入手するには、私にご連絡ください! おそらく、ギャンの取引手法についてはすでに何度も聞いたことがあるでしょう。通常、ギャンの理論は初心者のトレーダーだけでなく、すでにある程度の取引経験がある人にとっても非常に複雑なものです。なぜなら、ギャンの取引手法は理論的にはそれほど簡単に適用できるものではないからです。私はその知識を磨き、最良の原則を私の外国為替インジケーターに組み込むために数年を費やしました。 このインジケーターは非常に簡単に適用できます。必要なのは、それをチャートに添付し、簡単な取引推奨事項に従うだけです。このインジケーターは常に市場分析の仕事を行い、取引の機会を探します。適切なエントリーポイントを検
SR Liquidity は、市場の流動性が集中し、価格が最も強く反応する「隠れたゾーン」を可視化するために設計されたトレーディング指標です。こうした流動性の高いエリアは強力なサポート(支持)およびレジスタンス(抵抗)レベルとして機能し、市場が反転する可能性が最も高いポイントを明確に示してくれます。 単なる一般的なサポートラインやレジスタンスラインを描画するのではなく、「SR Liquidity」は実際の価格変動を分析し、売りと買いの圧力が集中するゾーンを特定します。これらは、市場の真の動きを牽引する「流動性のプール(溜まり場)」そのものです。それらをチャート上に直接可視化することで、価格が実際に反応する前に、その動きを予測することが可能になります。つまり、このインジケーターは価格の方向性が変わる可能性を予測するのです。生のプライスアクションを、市場の重要な水準(転換点となり得るポイント)を示す、明確で実用的なロードマップへと変換してくれます。 このインジケーターは、FX、株価指数、貴金属、仮想通貨など、あらゆる銘柄や時間足で使用可能です。 ご購入後、取引手順や無料の優れた追加インジケ
トレンドキャッチャーインジケーター トレンドキャッチャーインジケーターは、開発者独自の適応型トレンド分析指標を組み合わせることで、市場価格の動きを分析します。短期的なノイズを除去し、根底にあるモメンタムの強さ、ボラティリティの拡大、価格構造の挙動に焦点を当てることで、真の市場方向性を特定します。また、移動平均線、RSI、ボラティリティフィルターなどの平滑化およびトレンドフィルタリング機能を備えたカスタマイズ指標も使用します。 実際の運用状況のモニタリングやその他の製品については、こちらをご覧ください: https://www.mql5.com/en/users/mechanic/seller ご注意ください。私はTelegramでEAや設定を販売していません。詐欺です。すべての設定はブログで無料で公開しています。 重要!ご購入後すぐにご連絡ください。手順とボーナスをお送りします!
Power Candles V3 - 自己最適化型強弱インジケーター Power Candles V3は 、通貨や銘柄の強さを、適用されたすべてのチャート上で実行可能なトレードプランに変換します。単にローソク足を色分けするだけでなく、バックグラウンドでリアルタイムの自動最適化を実行し、目の前の銘柄に対して最適なストップロス、テイクプロフィット、およびシグナルの閾値を提示します。ワンクリックで実取引に適用でき、エントリーポイント、ストップロス、テイクプロフィットのラインが正確な価格位置にチャート上に表示され、方向性を示すアラートがリアルタイムで発動します。 このツールは、Stein Investmentsのエコシステムの一部です。  18種類以上のツールをすべて閲覧し、AIを活用したセットアップの推奨事項を入手し、  https://stein.investments でコミュニティに参加しましょう クローズしたバーごとに3,000回以上のトレードシミュレーション。9つの強さの状態。2つの戦略を並行してテスト。勝率の高い設定をワンクリックで適用。 なぜこれが必要なのか ほとんどの強
Crystal Heikin Ashi Signals - Professional Trend & Signal Detection Indicator Advanced Heikin Ashi Visualization with Intelligent Signal System for Manual & Automated Trading Final Price: $149 ---------> Price goes up $10 after every 10 sales . Limited slots available — act fast . Overview Crystal Heikin Ashi Signals is a professional-grade MetaTrader 5 indicator that combines pure Heikin Ashi candle visualization with an advanced momentum-shift detection system. Designed for both manual traders
M1 Quantum MT5
Hamed Dehgani
4.27 (11)
M1 Quantum を使用したライブトレードシグナル : シグナル (取引は 自動的に Quantum Trade Assistant によって実行され、この製品に 無料 で含まれています。) 最新ニュース: バージョン1.64がリリースされました。現在、すべての取引で、関連するサポート/レジスタンスゾーンの後ろにStop Lossが設定されます。今回のバージョンでは、EAのパフォーマンスを向上させるためにSmart Close機能も改善されました。 8月9日から、ライブシグナルはバージョン1.64で稼働しています。 価格プラン: 現在価格: $169 (早期購入者向けオファー) 次回予定価格: $189 予定小売価格: $299 開発者からのお知らせ: ご購入後、 最新の推奨設定ファイル(Set File) 、運用アドバイス、および他の M1 Quantum ユーザーと交流できる VIPサポートグループ への招待をご希望の場合は、お気軽にご連絡ください。 よくある質問 - 設定ファイル - インストールガイド M1 Quantum は、M1専用のプロフェッショナルトレーディング
この製品は 2026 年の市場向けに更新され、最新の MT5 ビルドに最適化されています。 価格更新のお知らせ: Smart Price Action Concepts は現在 $200 で提供されています。 次の 30 件の購入 後、価格は $299 に上がります。 特別オファー: 購入後、私にプライベートメッセージを送ることで、 無料ボーナス + ギフト を受け取ることができます。 まず、このトレーディングツールはリペイントなし、再描画なし、遅延なしのインジケーターであり、プロフェッショナルな取引に最適であることを強調しておきます。 [Online course] ,   [User Manual]  ,  [How to Install]  ,   [PDF] Smart Price Action Concepts Indicator は、初心者から経験豊富なトレーダーまで使える非常に強力なツールです。20 種類以上の便利なインジケーターを 1 つにまとめ、Inner Circle Trader Analysis や Smart Money Concepts Trading S
FX Trend NG:次世代マルチマーケット・トレンドインテリジェンス 概要 FX Trend NG は、複数の時間足に対応したプロフェッショナル向けトレンド分析およびマーケット監視ツールです。 市場全体の構造を数秒で把握することができます。 複数のチャートを切り替える必要はありません。どの銘柄がトレンド中なのか、どこでモメンタムが弱まっているのか、そしてどの時間足で強い整合性があるのかを瞬時に確認できます。 ローンチ特別オファー – FX Trend NG を $30(6ヶ月) または $80 永久ライセンス でご利用いただけます。 すでに Stein Investments のユーザーですか? -> メッセージを送信 して、プライベートグループへアクセスしてください。 セットアップや詳細情報が必要ですか? -> Stein Investments 公式ページ をご覧ください。 1. FX Trend NG が他と異なる理由 3ステート・トレンドロジック ― Buy と Sell だけではない • 多くのインジケーターは Buy または Sell の2状態のみを表示します。
BTMM State Engine Pro by G-Labs — Beat The Market Maker indicator for MetaTrader 5. Asian session range, London and New York kill zones, level progression (L1/L2/L3), peak formation detection (PFH/PFL), entry signals, and a multi-pair scanner from one chart. Stop scanning charts one pair at a time. The State Engine tracks the BTMM daily cycle automatically — Asian box, room boundaries, level blocks, peak formations, and filtered entries — while the scanner dashboard shows level, peak status, d
Reversion King Indicator
Eugen-alexandru Zibileanu
5 (6)
新たな王者が登場 - インジケーター + 注文管理表示(TP1 + TP2 + TP3)+ オプションのTelegramシグナル送信機能付き(無料) (完全なトレード&シグナルシステム) ゴールド向け最高のEA: Gold Slayer このインジケーターには、高度な戦略、カスタマイズ可能な注文管理システム、そしてエンベロープ拡張を組み合わせた平均回帰システムが搭載されています。さらに、RSIなど複数のインテリジェントな確認フィルターによって、高確率の反転エントリーをBUY・SELLシグナルとして検出します。 単にトレードを学ぶだけでなく、複数ポジションを効果的に管理し、過去に利益を出しているオープンポジションで損失トレードをカバーする方法も学べます。 M5向けに構築・最適化されており、流動性が高くシグナルの精度が安定しているBTCUSDとXAUUSDで優れたパフォーマンスを発揮します。 このインジケーターは、ATRを基に自動計算されたエントリー、ストップロス、テイクプロフィットレベルを備えた明確なLong・Shortシグナルを提供するため、リスク管理が最初から組み込まれています。 マ
Azimuth Pro
Ottaviano De Cicco
5 (7)
Azimuth Pro V2:MT5向けシンセティック・フラクタル構造分析と確認済みエントリー 概要 Azimuth Pro は Merkava Labs によるマルチレベルスイング構造インジケーターです。4つのネストされたスイングレイヤー、スイングアンカーVWAP、ABCパターン検出、3タイムフレーム構造フィルタリング、そして確定バーでの確認済みエントリー — 1つのチャートで、ミクロスイングからマクロサイクルまでを網羅するワークフロー。 これはブラインドシグナル製品ではありません。ロケーション、コンテキスト、タイミングを重視するトレーダーのための構造ファーストワークフローです。 ️ サマーセール — 夏至とThe Oracle Proの発売を記念して、Azimuth Proが30%オフ。現在279 USD(通常399 USD)。期間限定の夏季オファー。 1. V2での変更点 シンセティック・マルチタイムフレームエンジン 上位タイムフレーム分析をMeridian Proと同じ独自のシンセティックアーキテクチャで一から再構築。よりクリーンなHTFコンテキスト、安定したライブ動作、
AXIOM MATRIX MT5 ローンチ価格:$99 Axiom Matrix はローンチ価格 $99 でご利用いただけます。 最初の30件の購入後、価格は $199 に上がります。 ご購入後、手順のご案内と限定ギフトボーナスの受け取りのために、直接DMをお送りください。 Axiom Matrix は、MetaTrader 5 用のプロフェッショナルなマルチシンボル・マルチタイムフレーム市場スキャナー兼意思決定ダッシュボードです。 Market Watch をスキャンし、複数の時間足を分析し、複数のエビデンスエンジンを読み取り、最も強いチャンスを比較し、1つのクリーンなマトリックスダッシュボード内で最適な BUY、SELL、WAIT、またはブロック状態を表示します。 私が Axiom Matrix を作った理由は、市場スキャンという重い作業を代わりに行ってくれる1つのツールが欲しかったからです。 RSI だけを確認したくありませんでした。 次に MACD だけ。 次に移動平均線。 次に出来高。 次にボラティリティ。 次にサポートとレジスタンス。 そして、1つのトレードアイデアを作るた
FX Power: 通貨の強弱を分析して、より賢い取引を実現 概要 FX Power は主要通貨と金の実際の強弱をあらゆる市場状況で理解するための必須ツールです。強い通貨を買い、弱い通貨を売ることで、 FX Power は取引の意思決定を簡素化し、高い確率の取引機会を見出します。トレンドを追従する場合でも、極端なデルタ値を使用して反転を予測する場合でも、このツールはあなたの取引スタイルに完全に適応します。ただ取引するだけではなく、 FX Power で賢く取引をしましょう。 1. なぜ FX Power がトレーダーにとって非常に有益なのか 通貨と金のリアルタイム強弱分析 • FX Power は主要通貨と金の相対的な強弱を計算し、マーケットダイナミクスに関する明確な洞察を提供します。 • どの資産がリードしているか、または後れを取っているかを監視して、取引するペアを賢く選びましょう。 マルチタイムフレームの包括的なビュー • 短期、中期、長期のタイムフレームで通貨と金の強弱を追跡し、マーケットトレンドに基づいて取引戦略を調整できます。 • スキャルピングからスイングトレード
Atbot
Zaha Feiz
4.69 (55)
AtBot: どのように機能し、どのように使用するか ### どのように機能するか MT5プラットフォーム用の「AtBot」インジケーターは、テクニカル分析ツールの組み合わせを使用して売買シグナルを生成します。単純移動平均(SMA)、指数移動平均(EMA)、および平均真実範囲(ATR)インデックスを統合して取引機会を特定します。さらに、Heikin Ashiキャンドルを使用してシグナルの精度を向上させることもできます。 購入後にレビューを残すと、特別なボーナスギフトを受け取ります。 ### 主な機能: - 再描画なし: シグナルはプロット後に変更されません。 - 再描画なし: シグナルは一貫しており、変更されません。 - 遅延なし: 遅延なくタイムリーなシグナルを提供します。 - 多様な時間枠: あらゆる時間枠で使用可能で、取引戦略に合わせることができます。 ### 操作手順: #### 入力と設定: - firstkey (TrendValue): トレンド検出の感度を調整します。 - Secondkey (SignalValue): 売買シグナル生成の感度を定義します。 - ma
Gartley Hunter Multi - An indicator for searching for harmonic patterns simultaneously on dozens of trading instruments and on all possible timeframes. Manual (Be sure to read before purchasing) | Version for MT4 Advantages 1. Patterns: Gartley, Butterfly, Shark, Crab. Bat, Alternate Bat, Deep Crab, Cypher 2. Simultaneous search for patterns on dozens of trading instruments and on all possible timeframes 3. Search for patterns of all possible sizes. From the smallest to the largest 4. All fou
Quantum TrendPulse を ご紹介します。これは、   SuperTrend   、   RSI   、および Stochastic のパワーを 1 つの包括的なインジケーターに組み合わせて、取引の可能性を最大限に引き出す究極の取引ツールです。精度と効率を求めるトレーダー向けに設計されたこのインジケーターは、市場のトレンド、勢いの変化、最適なエントリー ポイントとエグジット ポイントを自信を持って特定するのに役立ちます。 主な特徴: SuperTrend 統合: 現在の市場動向に簡単に追従し、収益性の波に乗ることができます。 RSI精度: 買われすぎと売られすぎのレベルを検出し、市場の反転のタイミングに最適で、SuperTrendのフィルターとして使用されます。 確率的精度: 確率的振動を活用して、変動の激しい市場で隠れたチャンスを見つけます。SuperTrend のフィルターとして使用されます。 マルチタイムフレーム分析:   M5 から H1 または H4 まで、さまざまなタイムフレームで市場を常に把握します。 カスタマイズ可能なアラート: カスタム取引条件が満たされ
Crystal Quantum Pro
Muhammad Jawad Shabir
5 (2)
CRYSTAL QUANTUM PRO Institutional Signal & Trade Intelligence for MetaTrader 5 Final Price: 199 USD ----> Price goes up 10 USD after every 10 sales. Limited launch slots available, act fast. Most indicators give you an arrow and leave you alone. A naked arrow is a gamble. Winning consistently requires CONFLUENCE , a clear STOP and TARGET , and honest PROOF that the system works. Crystal Quantum Pro delivers all three in one clean, no-repaint package. Crystal Quantum Pro is a complete decision sy
Bill Williams Advanced is designed for automatic chart analysis using Bill Williams' "Profitunity" system. The indicator analyzes four timeframes at once. Manual (Be sure to read before purchasing) Advantages 1. Analyzes the chart using Bill Williams' "Profitunity" system. Signals are displayed in a table in the corner of the screen and on the price chart. 2. Finds all known AO and AC signals, as well as zone signals. Equipped with a trend filter based on the Alligator. 3. Finds "Divergence Bar
フィルタ:
レビューなし
レビューに返信