Strategy Compare MT4
- インディケータ
- バージョン: 1.13
- アップデート済み: 14 9月 2026
- アクティベーション: 5

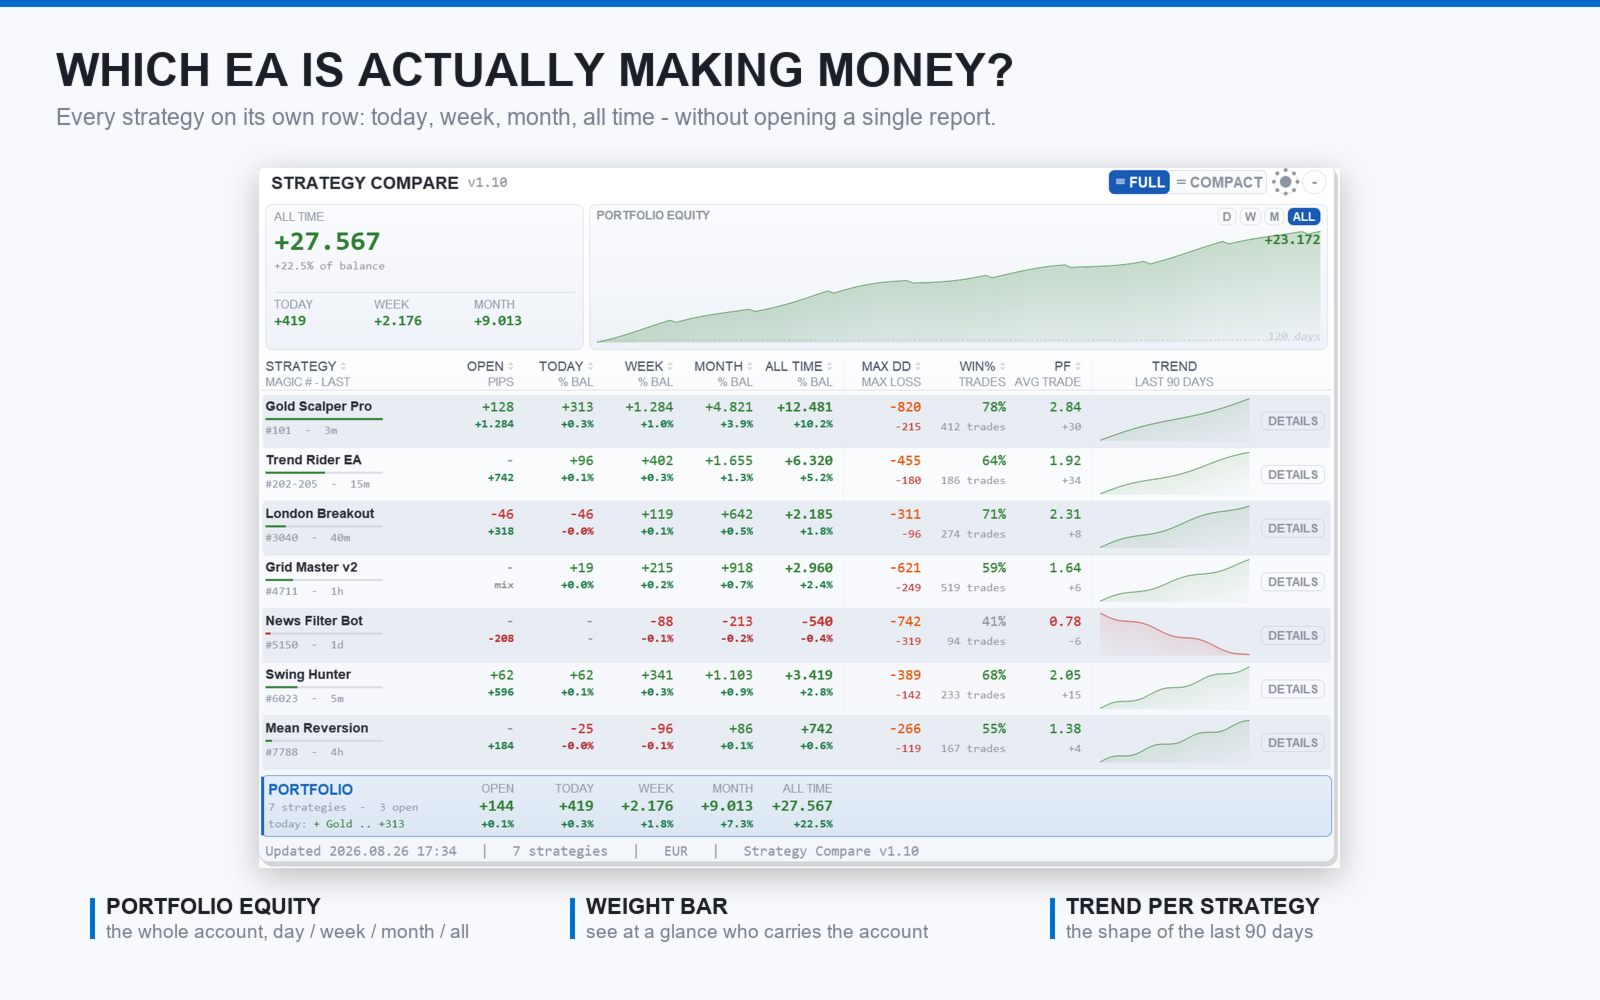
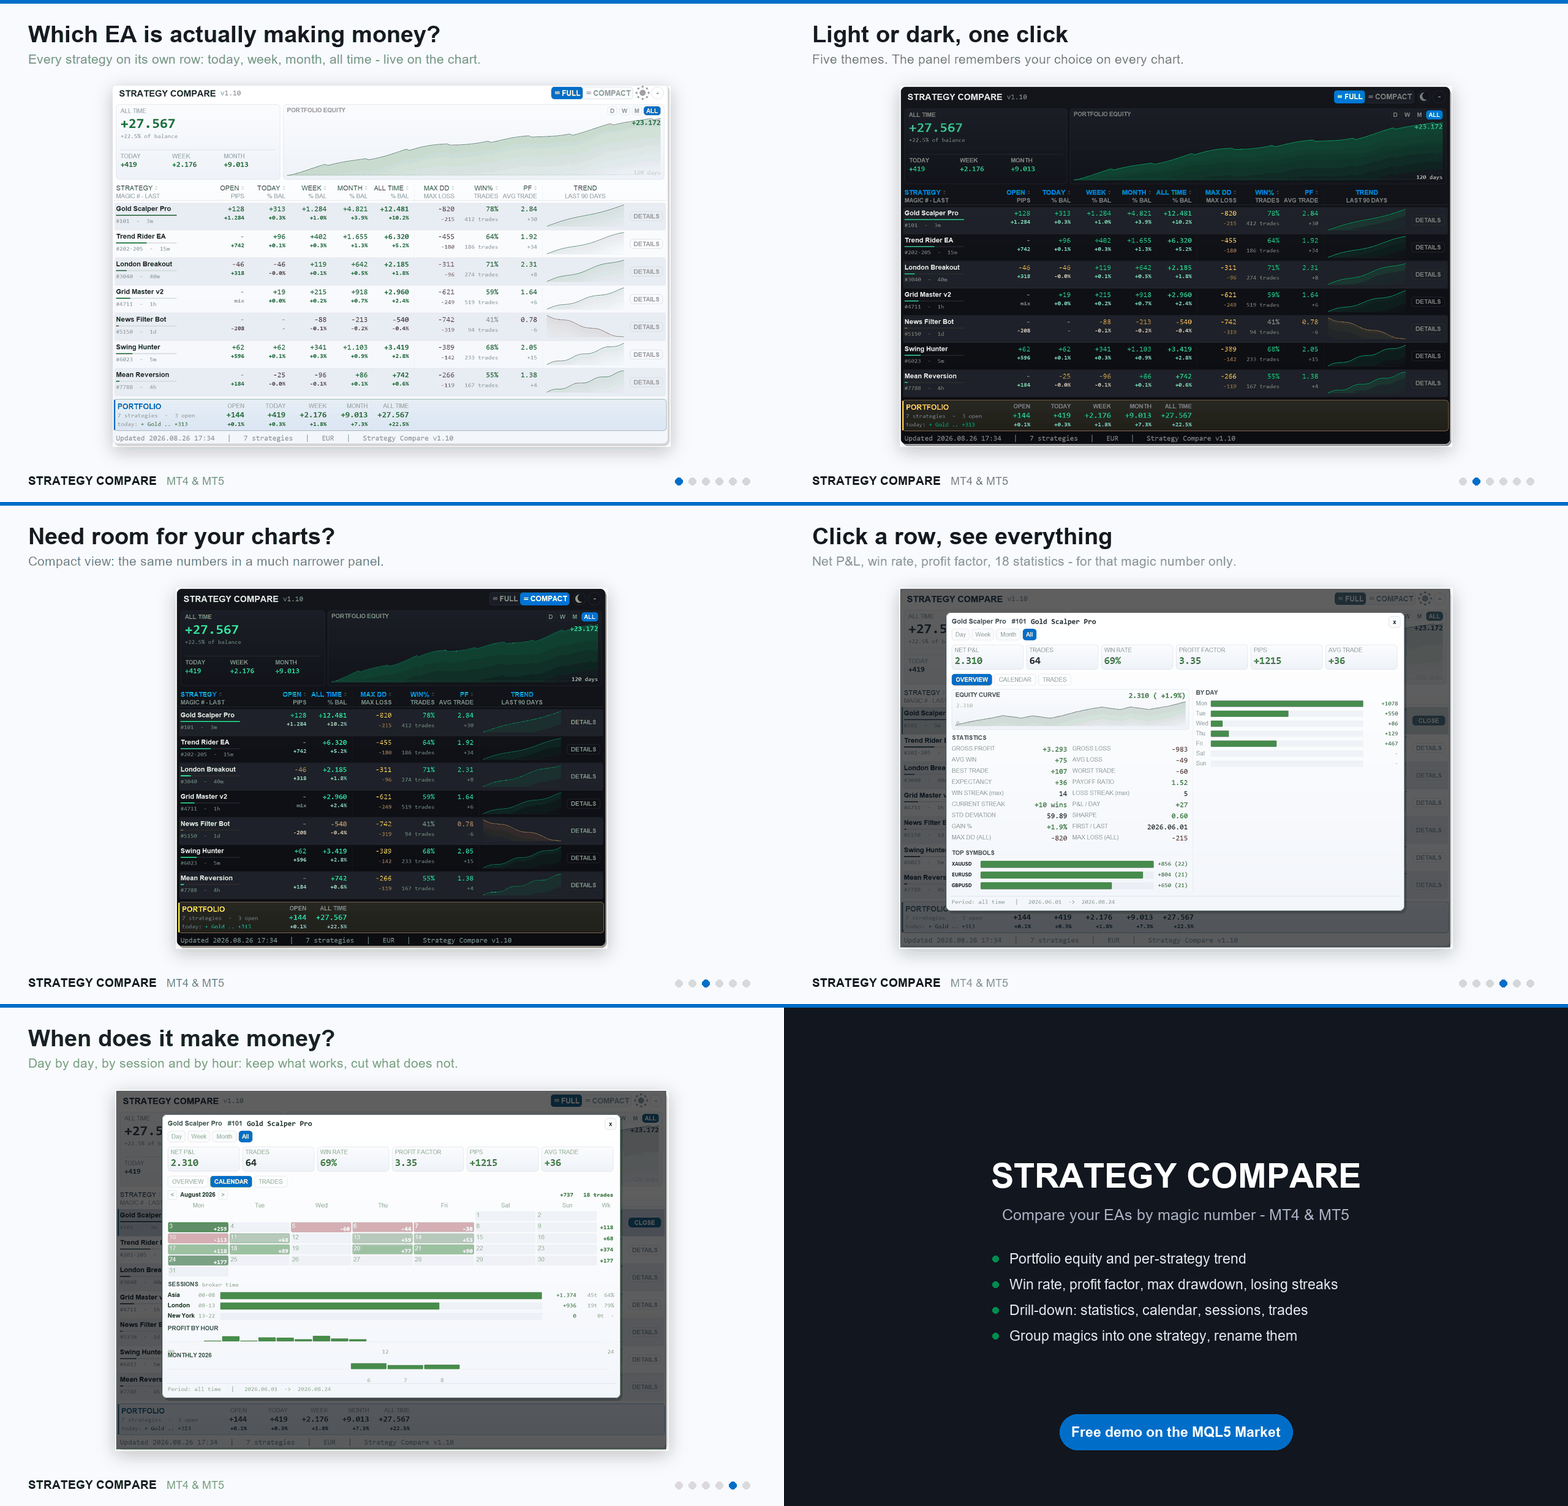
Strategy Compare MT4 is a dashboard that compares the Expert Advisors and strategies running on one MetaTrader 4 account, by magic number. It reads the account history, splits it by magic number and shows each Expert Advisor, or each group of magics you define, as one row of a live table: Open, Today, Week, Month and All Time profit, win rate, profit factor, pips, worst drawdown and worst losing streak, side by side. Clicking a row opens a statistics panel for that single strategy.
The user manual is published on the MQL5 blog: https://www.mql5.com/en/blogs/post/774850
Support is available through the product comments or the mql5.com messaging system.
Comparison table
One row per magic number or per named group of magics. Profit columns for Open, Today, Week, Month and All Time, shown as money, as percent of balance, or both. Per-strategy metrics: pips, win percent and profit factor (each column can be switched off). Max DD is the worst floating drawdown of each strategy, saved to file so it survives restarts; Max Loss is the worst losing streak on closed trades. The table can be sorted by any column. A portfolio total row and an account summary (balance, equity, floating profit and margin) complete the table.
Grouping and naming
A magic number can be given a name (for example 123=Scalper) and the table shows the name instead of the number. A range of magics can be merged into one row (for example 8000-9000=Grid) with group statistics and a shared Max DD tracking. Entries are comma separated across three input fields for long strategy lists.
Drill-down panel
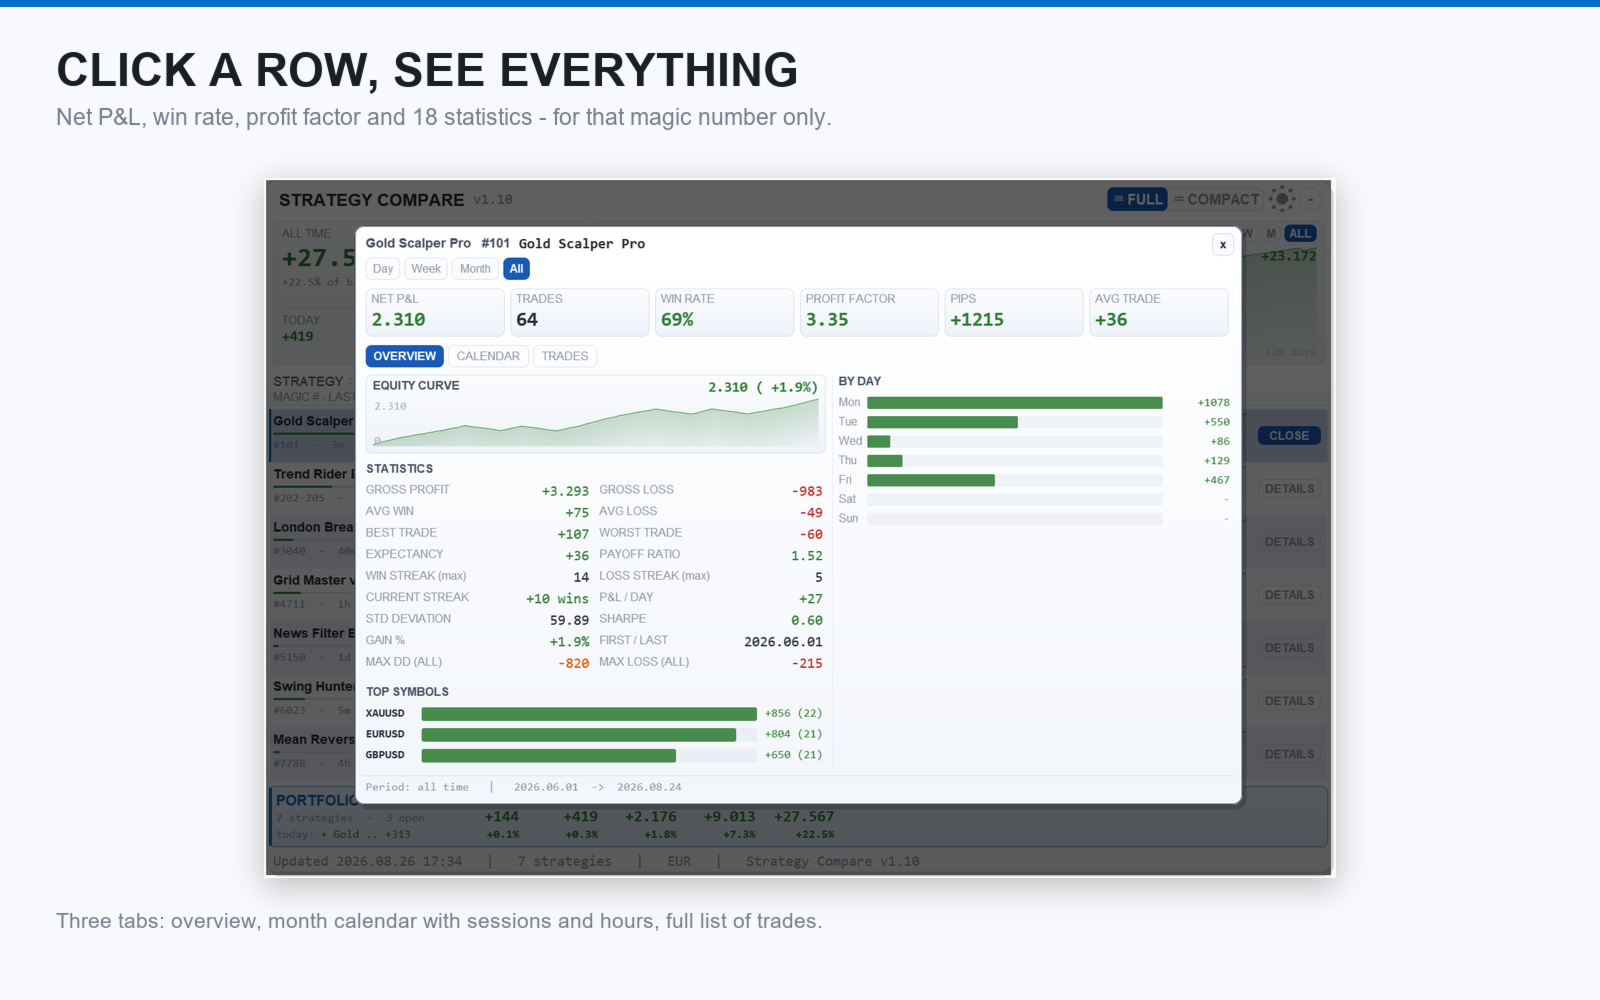
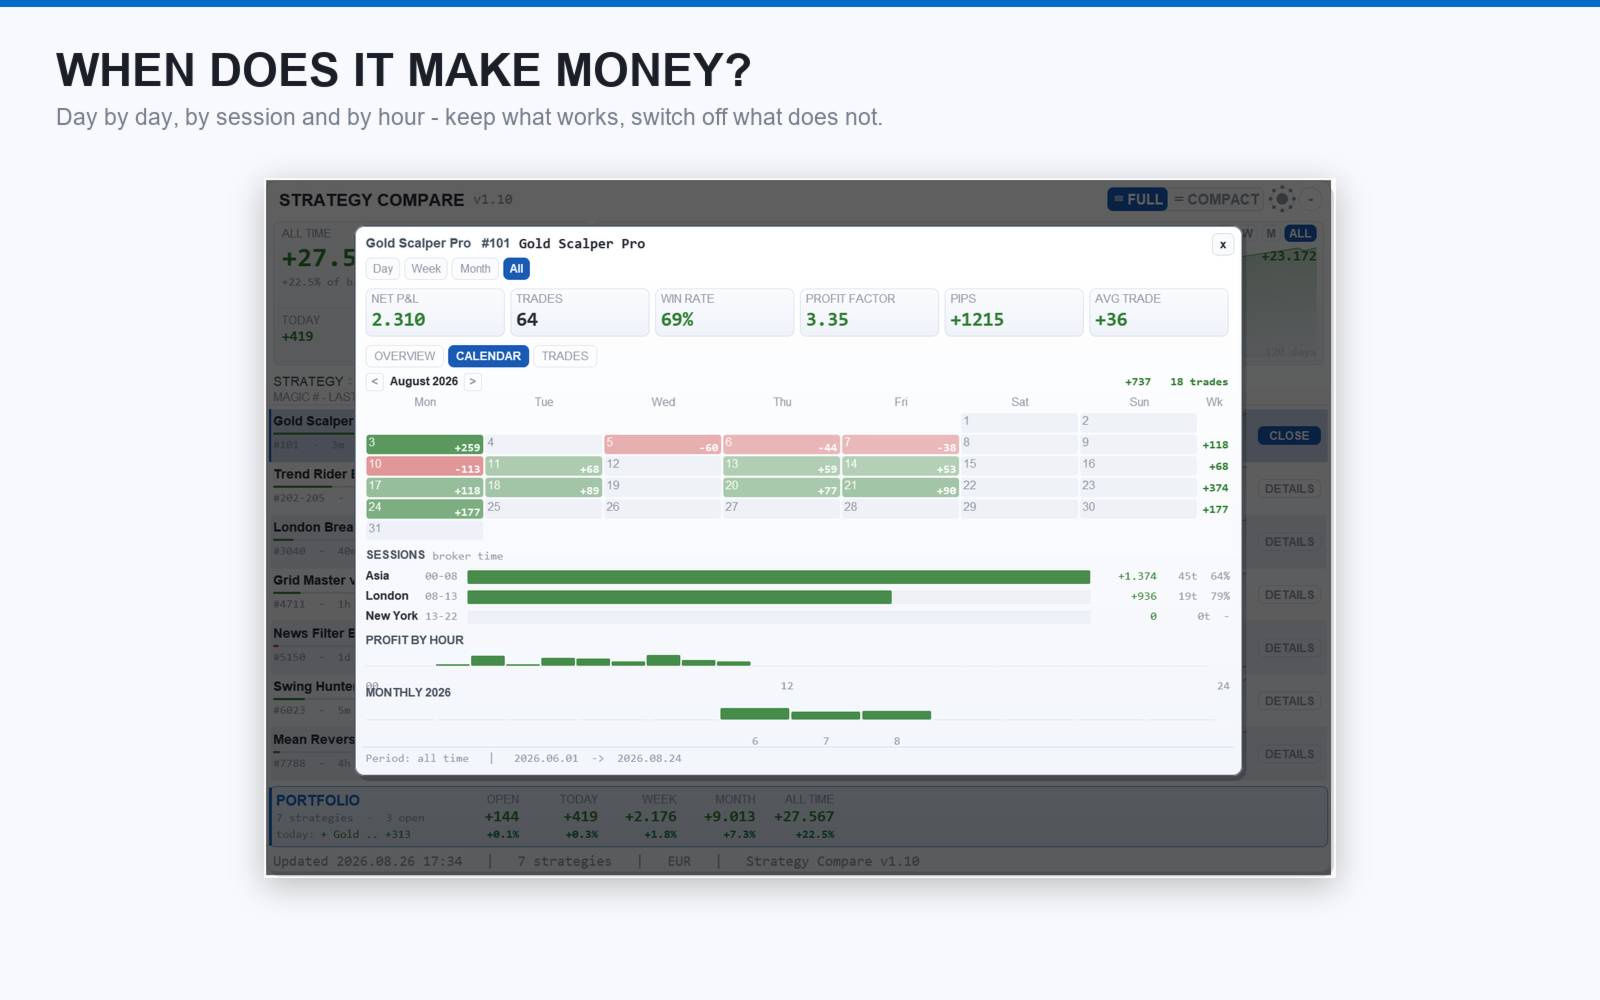
Clicking a row opens a panel with net profit and equity curve for Day, Week, Month or All Time, win rate, profit factor, average, best and worst trade, win and loss streaks, all-time maximum drawdown and the latest trades with close date and lot size. A monthly calendar shows the profit of each day with weekly totals, and there is a breakdown by session (Asia, London, New York), by hour and by month.
Filters
Show only magics active in the last X days (default one year), restrict the table to a list of magics or exclude specific ones. A custom pip size per symbol gives correct pip values on metals, indices and crypto.
Equity curve
Realized equity curve of the visible strategies with zero line and min and max markers. The scale is daily, weekly or monthly depending on the history span, or trade by trade. A separate curve for the selected strategy and period is shown in the drill-down.
Display
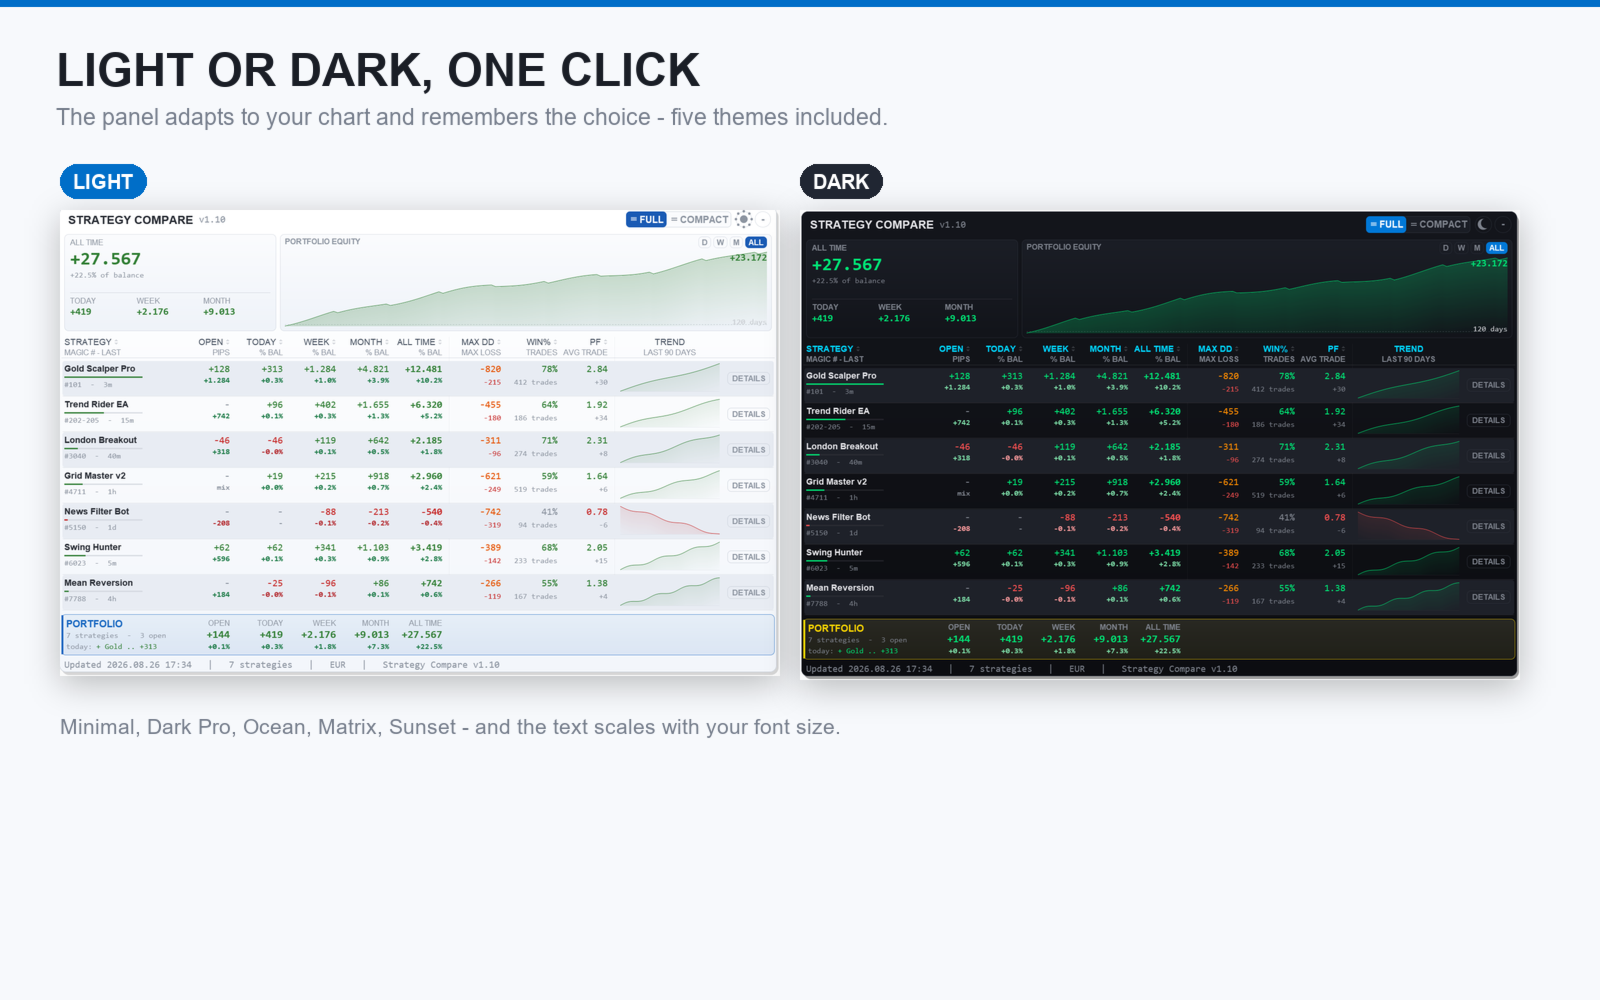
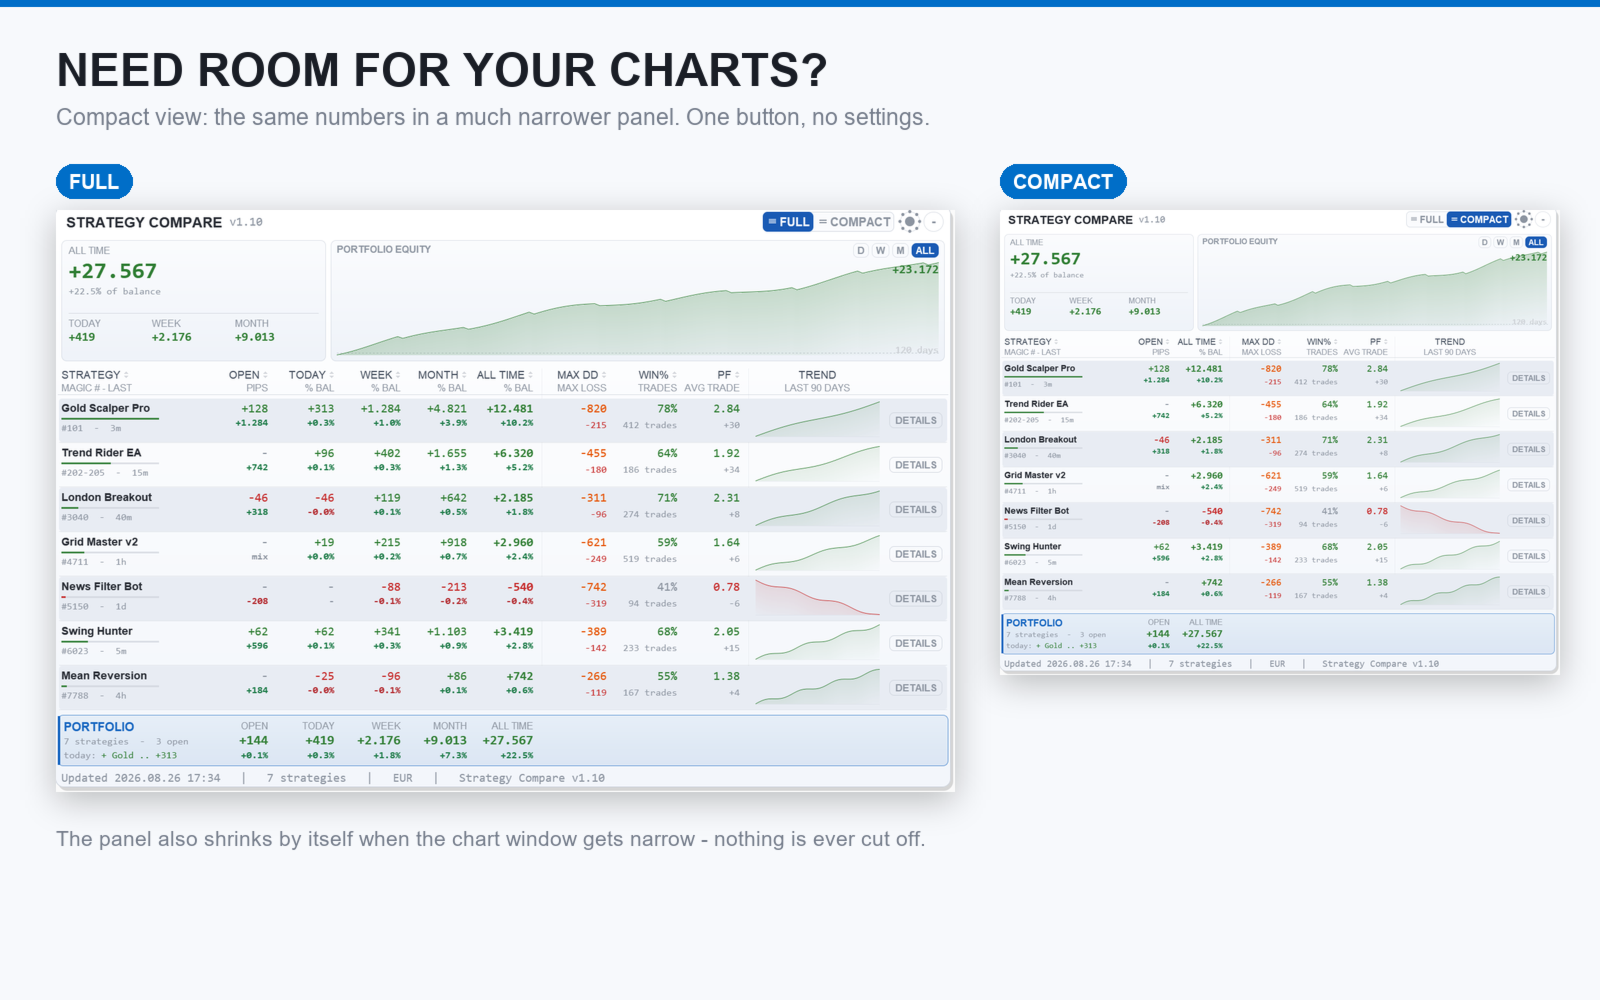
The panel is drawn on a canvas with KPI cards on top (Balance and Equity, Open, Today, Week, Month, All Time) and the realized equity curve underneath. It can be scrolled when taller than the chart, minimized to its title bar, and shown in one of five color themes including a light one. An optional clean-chart mode hides the chart elements. Font sizes and description length are adjustable. Closed-trade history is cached and recalculated only when it changes; the update frequency is configurable.
Input parameters
Strategies: magic names and groups (three fields), active in last X days, include list, exclude list, custom pip sizes.
Columns: profit display mode (money, percent, both), pips, win percent, profit factor, Max DD, Max Loss.
Equity curve: scale mode, curve on or off.
Display: theme, font sizes, description length, clean-chart mode, panel position, update frequency.
Notes
This is an analysis tool, not a trading system: it does not open or close trades. Load it on one chart per account. It works with any symbol and any broker and also tracks manual trading alongside the Expert Advisors. No DLL is required. Available for MetaTrader 4 and MetaTrader 5. Other tools by the same author are listed on the seller page: https://www.mql5.com/en/users/edl2/seller.