Repaint Auditor
- インディケータ
-
Aitor Ilundain Real
 I build tools for retail traders: a trading journal, chart and macro analysis, risk calculators, and a code generator that produces MQL5 and Pine Script you compile and run yourself.
 - バージョン: 1.0
=== WHY THE TWO BEHAVIOURS ARE NOT THE SAME THING ===
"Repainting" gets used for two very different things, and mixing them up is the reason the
harmful one goes unnoticed.
Intrabar movement. Any indicator built on the current price moves while the bar is still
forming and settles when the bar closes. This is normal. It is not a defect, and it is not
what breaks a backtest. It only matters if you act on a signal before the bar has closed -
and then it matters a great deal, because the signal you acted on may not be there at the
close.
Change after the close. The value shown on a bar that has already closed turns out to be
different later. This is the one that invalidates a backtest, because the strategy is tested
against numbers that were never available at the time. It is also nearly invisible in
day-to-day use: reloading a chart only ever shows you the final values, never what was
displayed when the decision would have been made.
This indicator measures both, keeps them apart, and passes no judgement. Plenty of indicators
change after the close by design and are perfectly legitimate - zigzags, fractals, and any
pattern confirmed some bars after the fact. The point is not to label them: it is to make the
behaviour visible, so you know which one you are holding and can decide whether it belongs in
a backtest.
=== HOW THE DETECTION WORKS ===
On historical bars only final values exist, so a change after the close cannot be detected by
looking backwards - the information needed is simply not there any more. The only way is to
watch forwards:
1. When a bar closes in real time, the indicator records the value the audited buffer was
showing at that exact moment, together with the bar's open time.
2. Some bars later it asks again what that buffer now says about that same bar.
3. If the two values differ by more than the tolerance, that bar changed after it had closed.
It is counted once.
Bars are matched by OPEN TIME, not by index. A bar's index shifts when the terminal loads more
history, and comparing against the wrong bar would produce a false positive - which is exactly
what a tool like this cannot afford.
The comparison is relative and bounded, dividing by the larger of the two values (and never by less than 1e-10),
so it behaves correctly for oscillators that cross zero, where a plain percentage would blow up.
=== HOW TO USE IT ===
1. Set "Indicator to audit" to the path of the indicator, relative to MQL5\Indicators and
without the .ex5 extension. Example: Examples\Custom Moving Average
2. Set "Buffer index" to the buffer you want to watch (0 is the first one).
3. If the indicator needs parameters, set "How many of the parameters below to pass" and fill
them in. Leave it at 0 to use the indicator's own defaults.
4. Leave the chart open and let bars close.
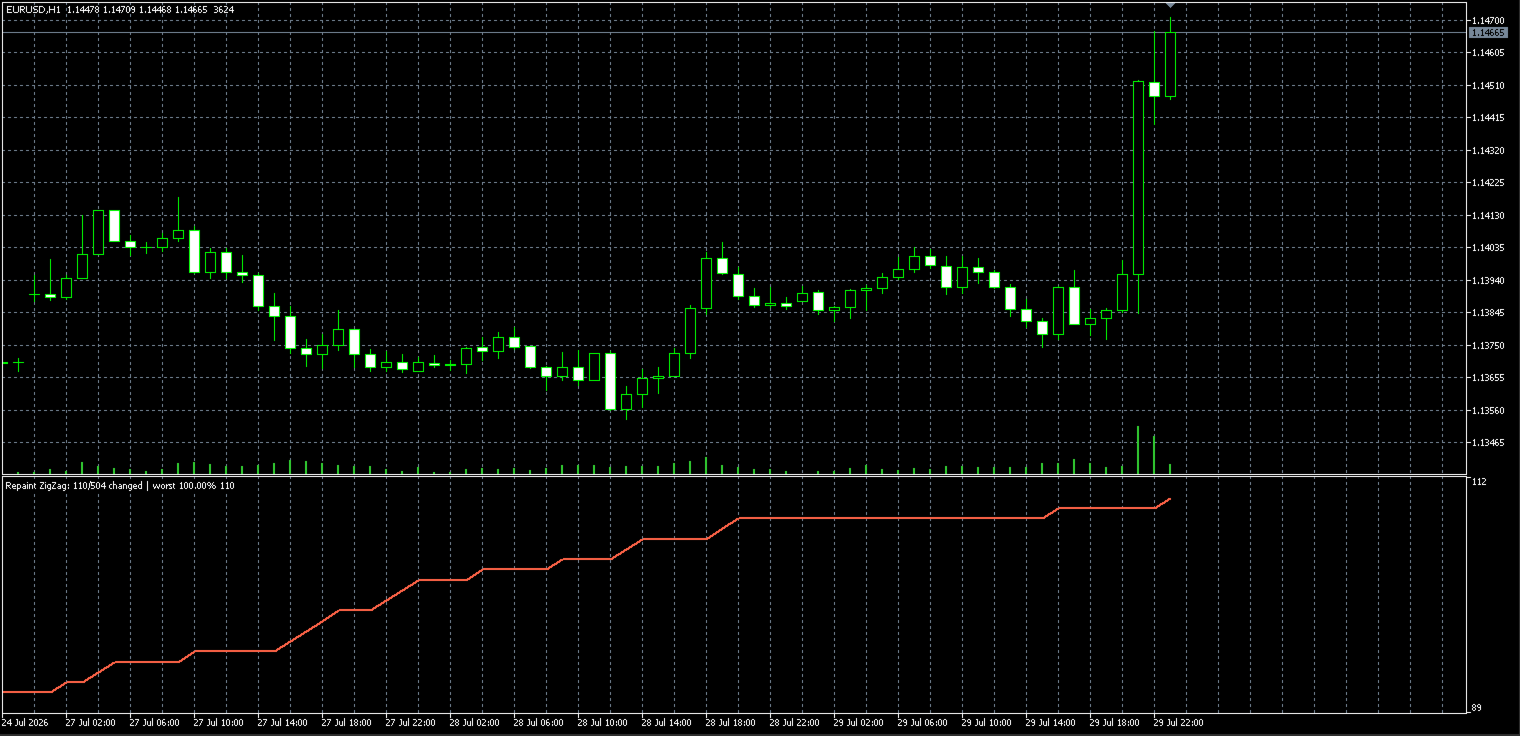
The verdict appears in the indicator window header, and the line plots the running count of
bars that changed after closing.
Sanity check first. Point it at an indicator you know does not repaint, such as a simple moving
average, and leave it for a while. The counter must stay at zero. If it does not, the tolerance
is too tight for that instrument and should be raised.
=== READING THE RESULT ===
"waiting for live bars" - the normal state right after attaching it. It is not a clean bill of
health.
"no changes after close (N bars observed)" - over the bars observed so far, nothing moved once
it had closed. How much this is worth depends entirely on how large N is: five means almost
nothing, several hundred means a lot.
"CHANGES AFTER CLOSE: X of N bars" - at least one closed bar changed value later, with the
worst change measured as a percentage.
=== LIMITATIONS, STATED UP FRONT ===
- It only audits forwards, in real time. It cannot audit history, and neither can anything
else: the information required no longer exists on historical bars.
- Observations accumulate only while the indicator stays attached, and reset when the chart or
the terminal restarts. Longer sessions produce a more meaningful verdict.
- It reads a buffer through iCustom, so the audited indicator has to expose the value in a
buffer. Values a script keeps in internal variables cannot be reached.
- It reports behaviour, not intent. An indicator that changes after the close is not
automatically broken - but a strategy backtested on one is not measuring what it appears to
measure.
- Lower timeframes produce a verdict sooner, simply because more bars close per hour.
=== EDUCATIONAL ===
This is a measurement tool. It does not trade, it does not open or close positions, it does not
produce buy or sell signals and it does not tell anyone what to trade. Published as open source
so the method can be read end to end: a tool whose whole point is verification should be
verifiable itself.
More free tools and the trading journal they come from: https://suavar.com