Structure Pulse SMC
- インディケータ
- バージョン: 4.53
- アップデート済み: 1 8月 2026
- アクティベーション: 5

Structure Pulse SMC
Structure Pulse SMC is a multifunctional indicator for MetaTrader 5 that combines market structure, liquidity, trend, and volume analysis in one visual system. It helps traders assess current market conditions faster, identify potential entry points, and plan trade management levels in advance.
Instead of using multiple separate indicators and manually drawn lines, Structure Pulse SMC creates a complete market picture directly on the chart: structural direction, key level breakouts, liquidity sweeps, imbalance zones, volume levels, and confirmed BUY or SELL signals.
Market Structure Analysis
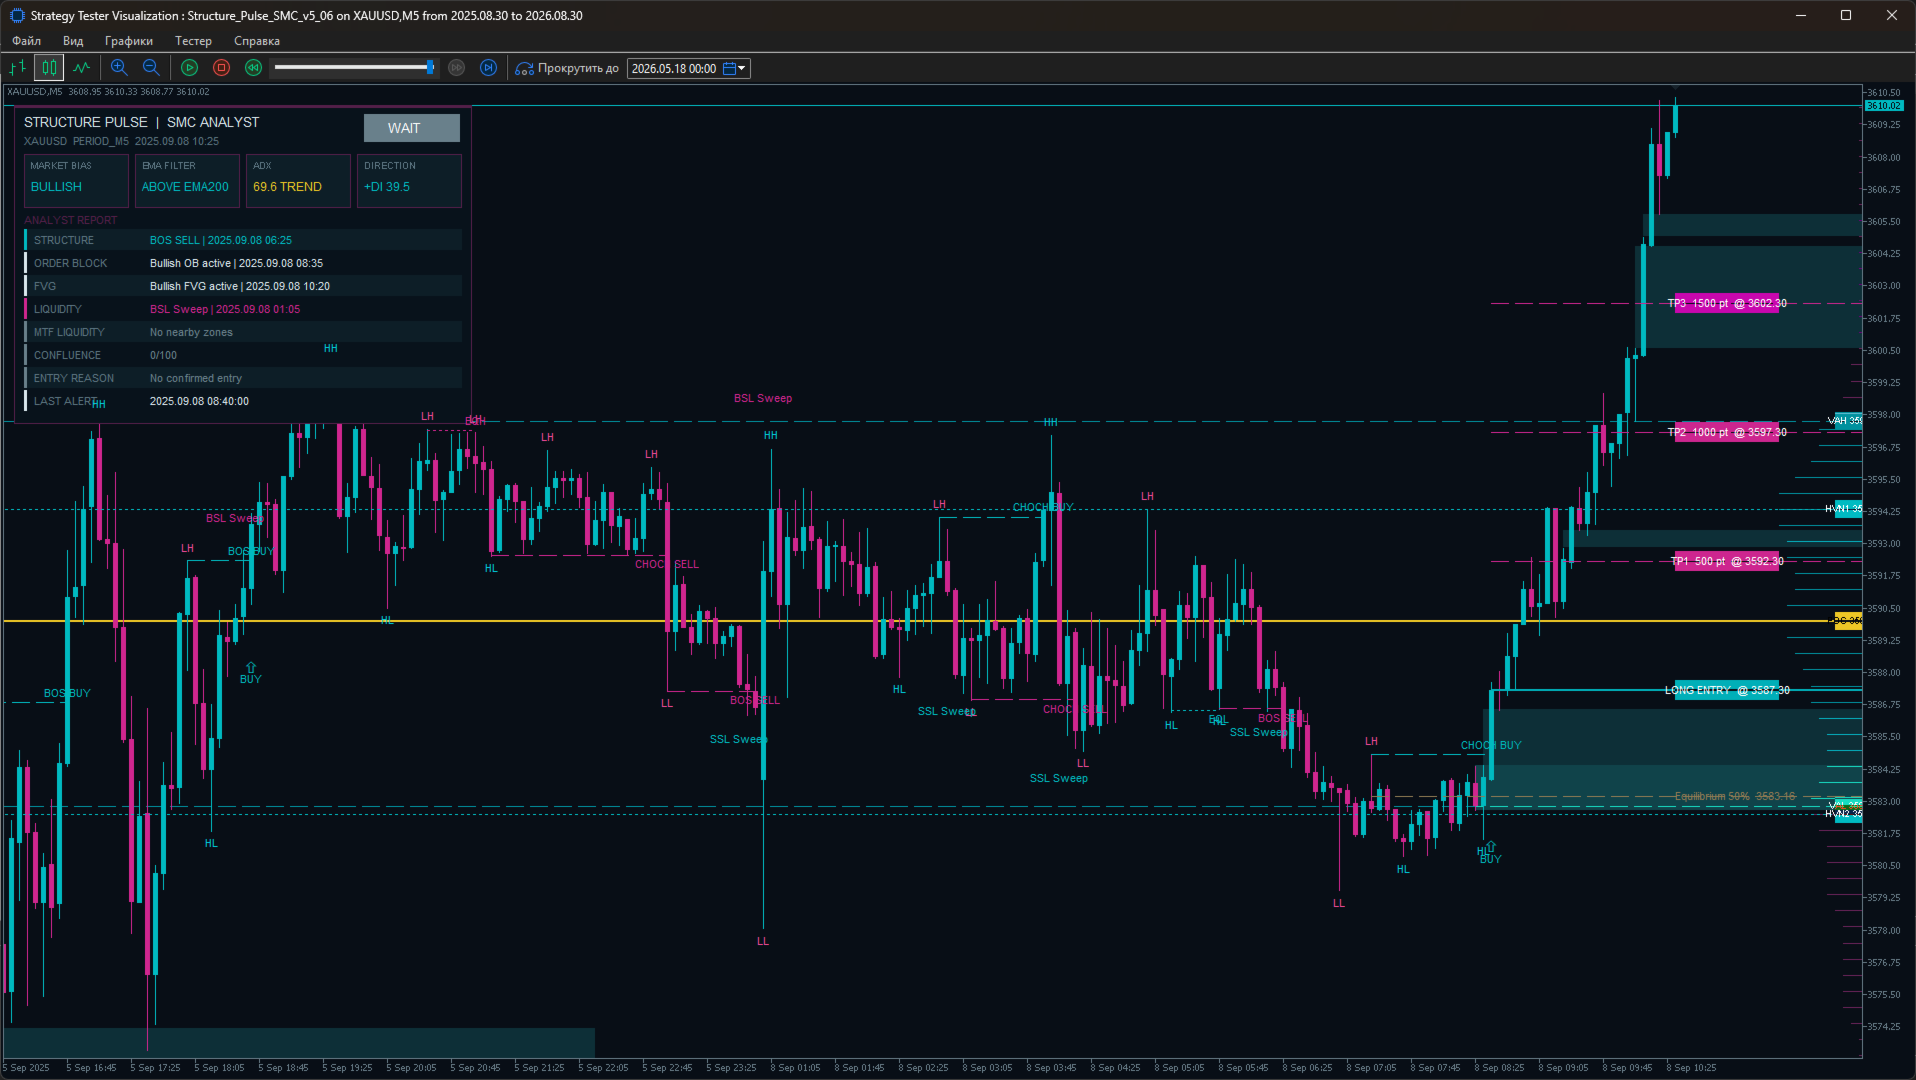
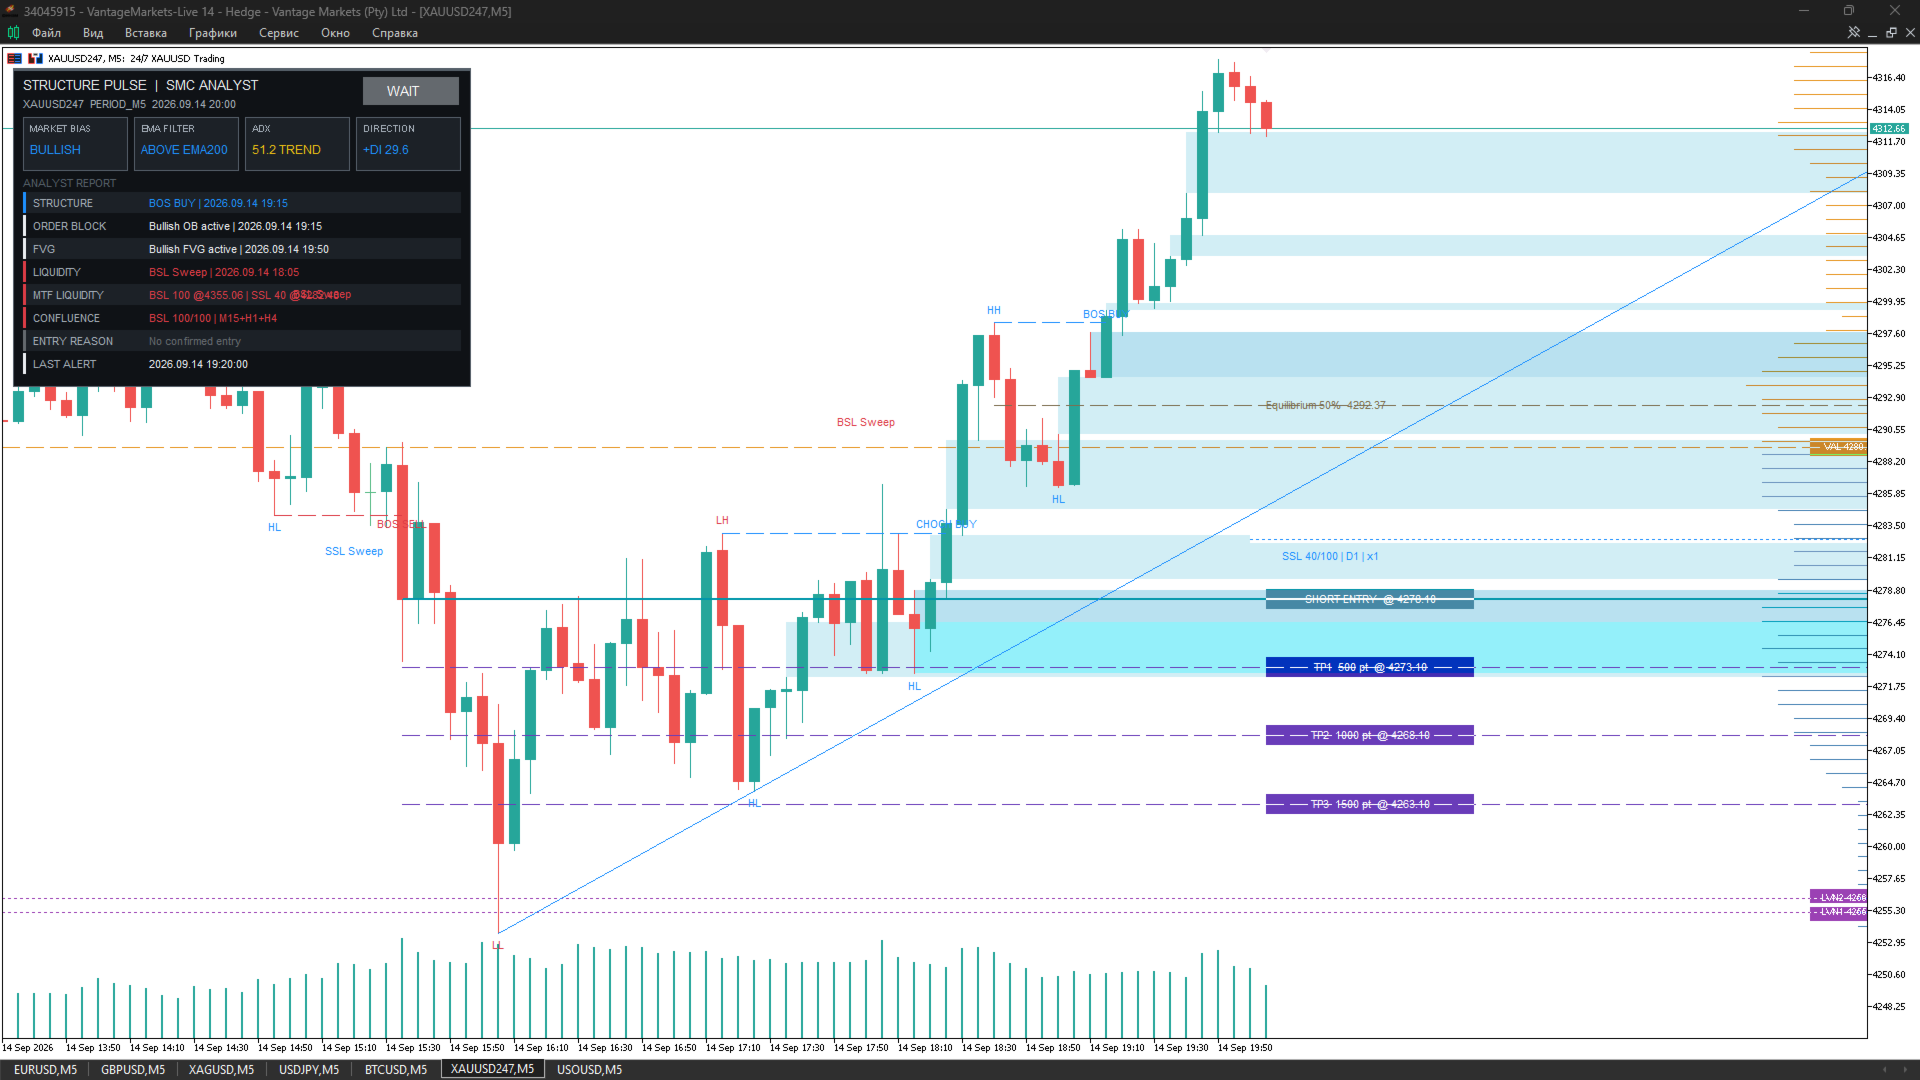
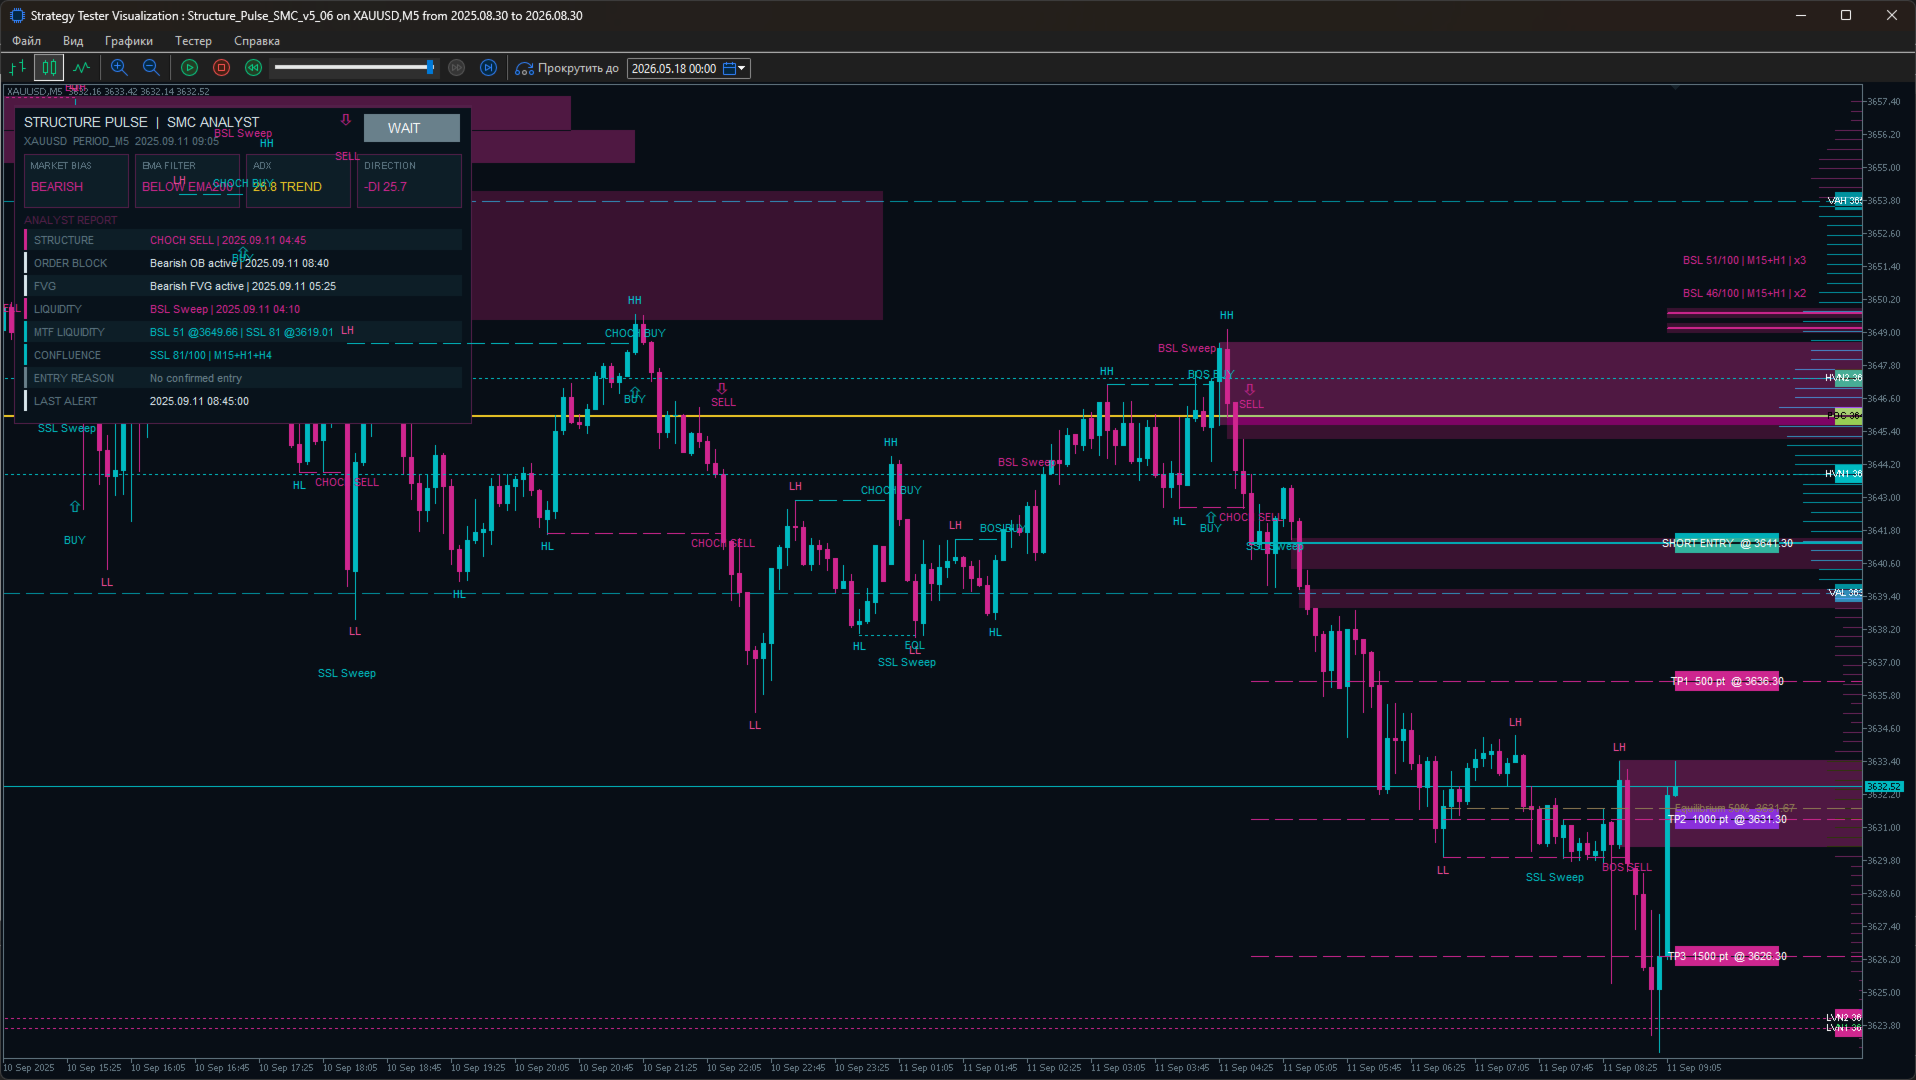
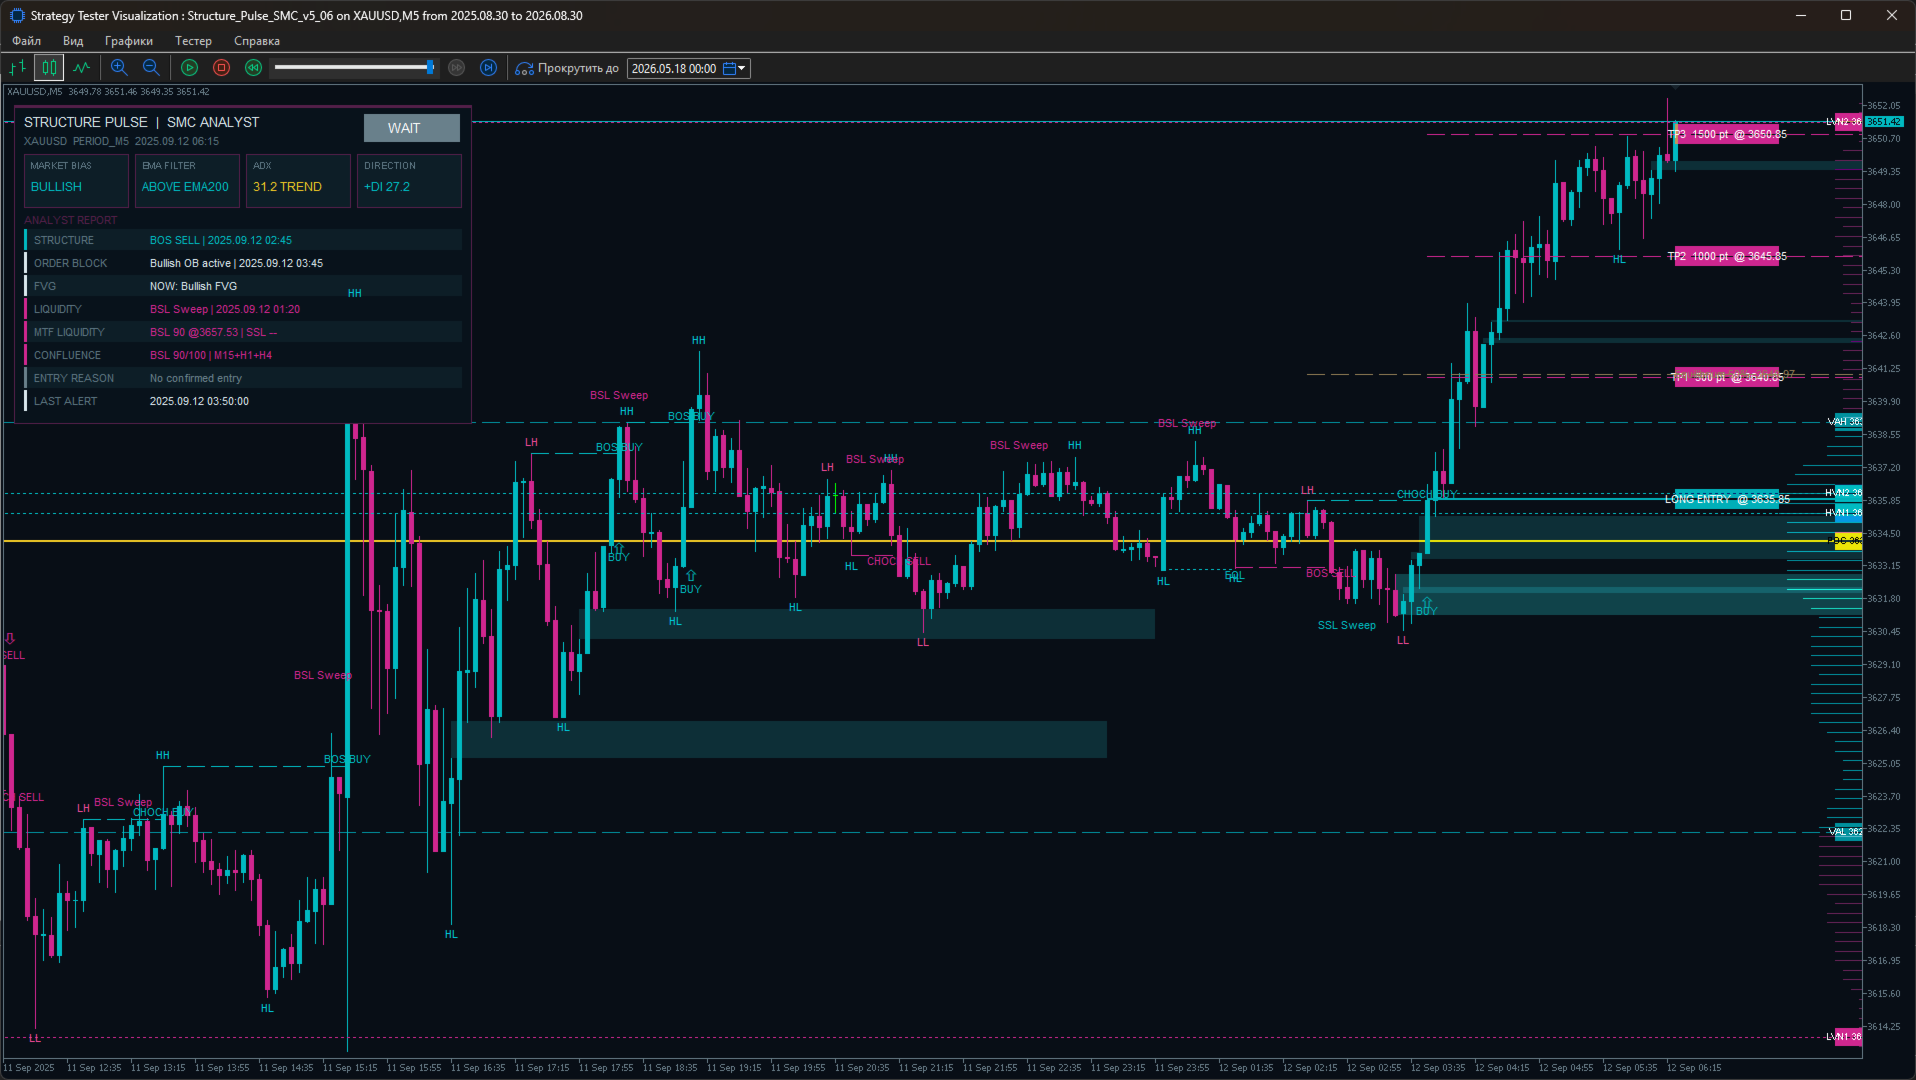
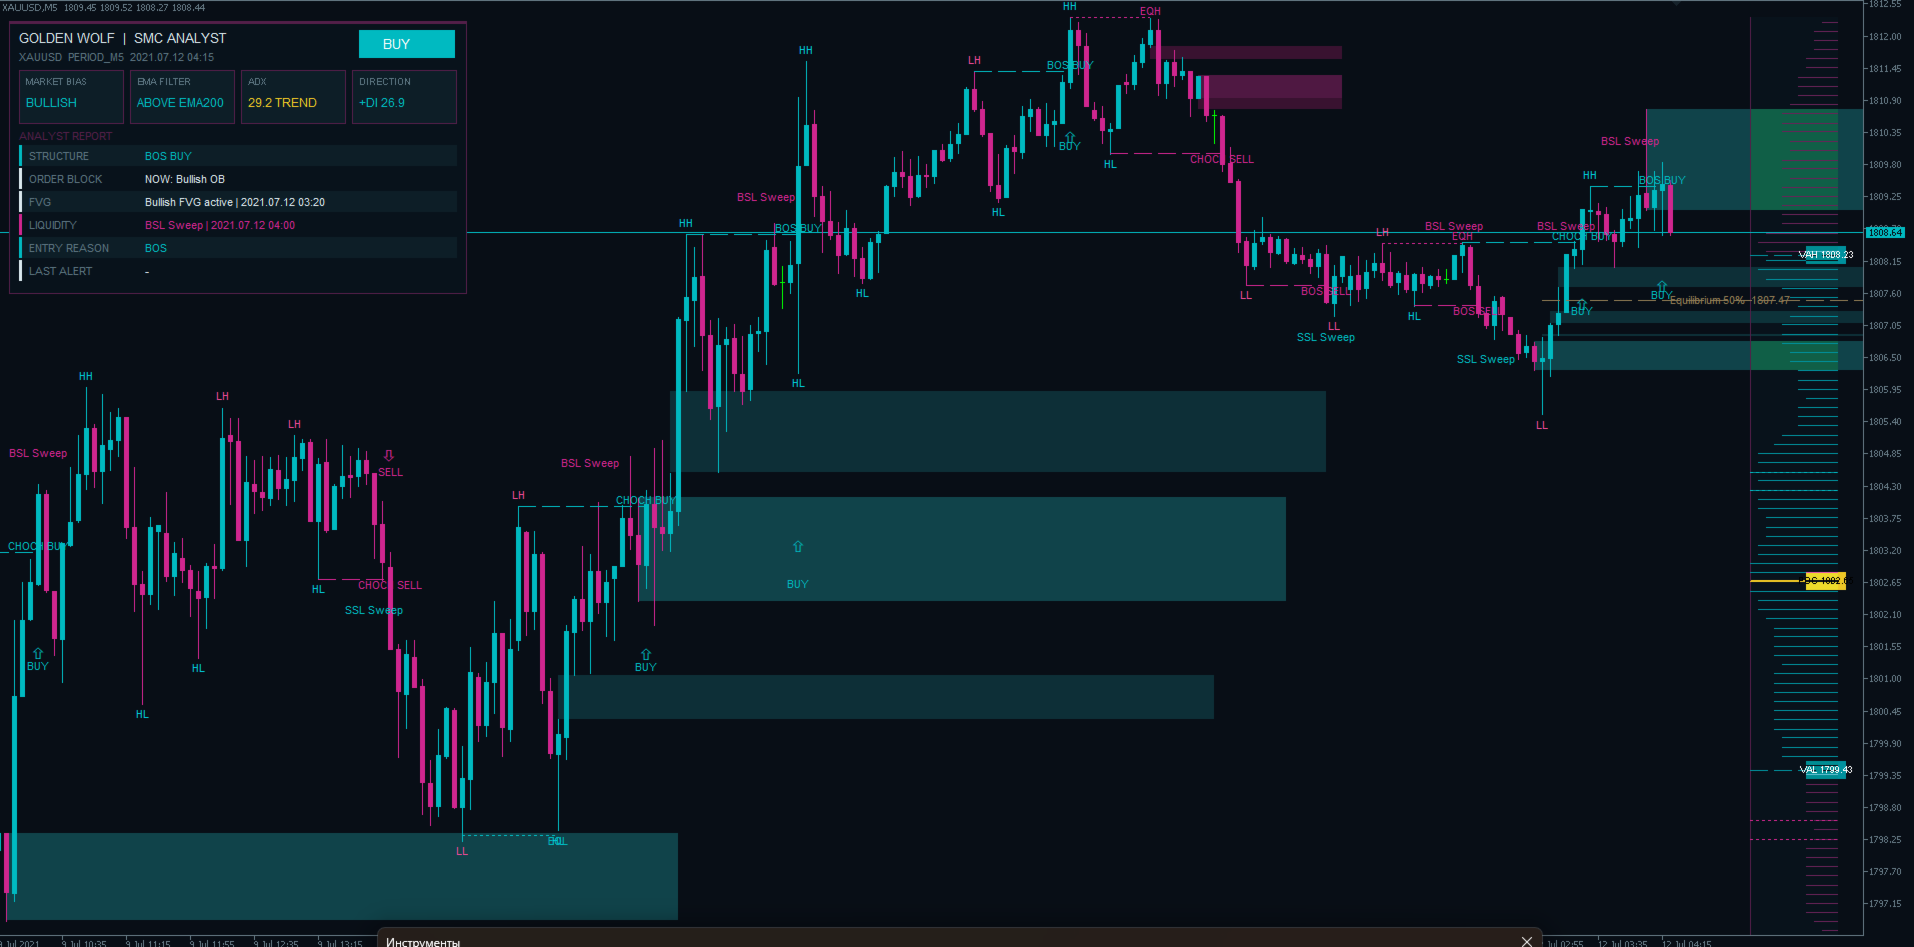
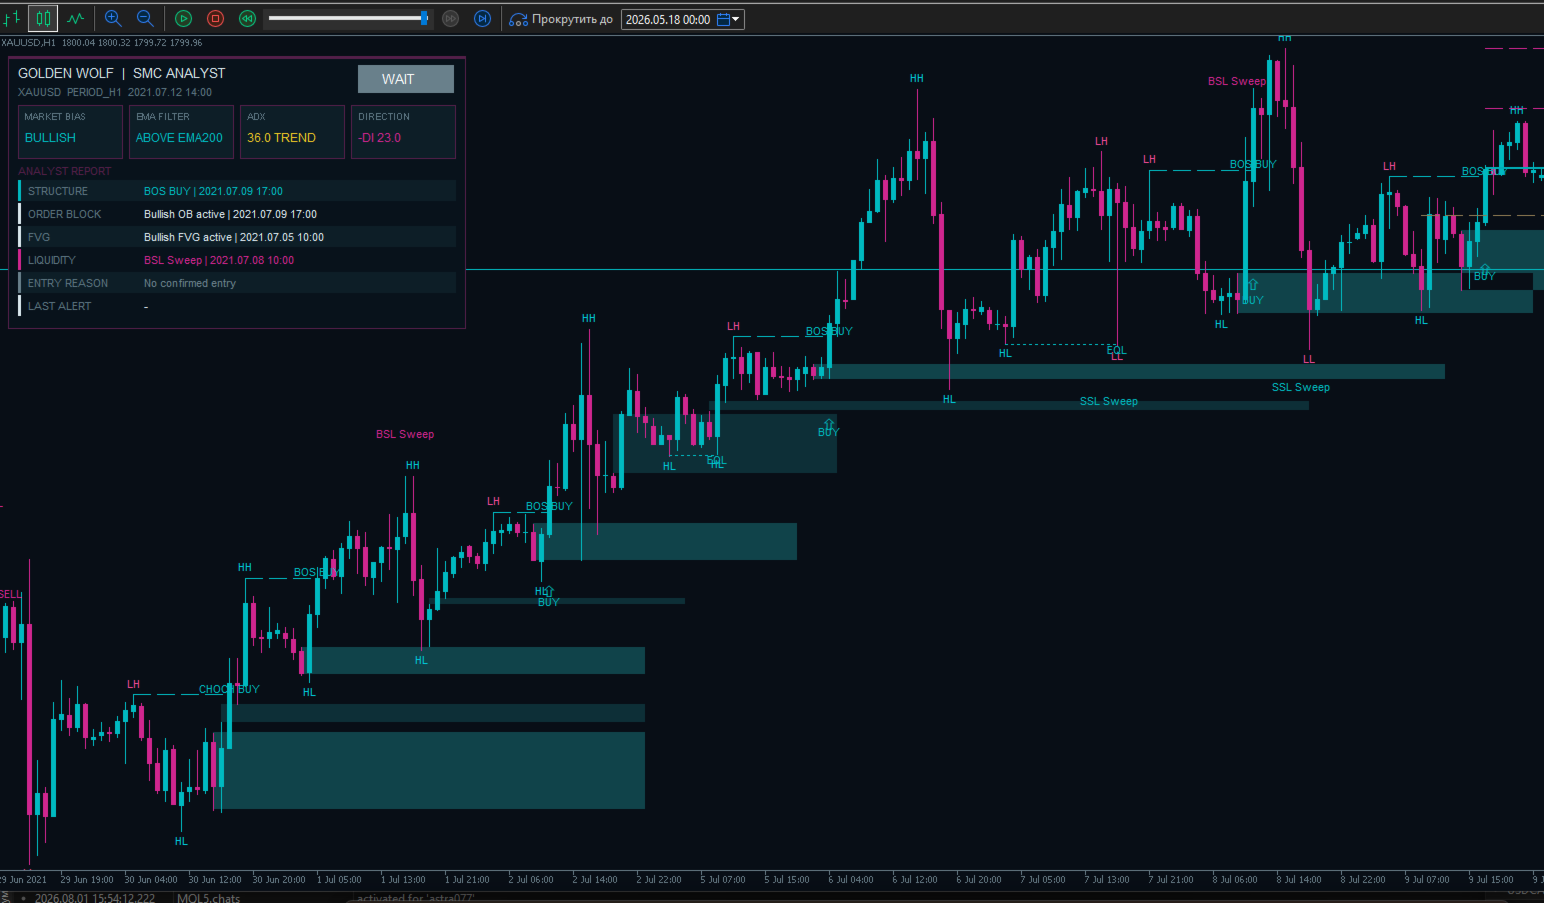
The indicator automatically detects and displays the main elements of market structure: HH — Higher High, HL — Higher Low, LH — Lower High, LL — Lower Low, BOS — Break of Structure, CHOCH — Change of Character.
This helps identify trend development, continuation, and possible changes in market direction without manually marking every local high and low.
Liquidity Analysis
Structure Pulse SMC tracks liquidity areas and identifies BSL Sweep — liquidity taken above previous highs, SSL Sweep — liquidity taken below previous lows.
These events may indicate a false breakout, liquidity collection, and a possible subsequent price reaction. Liquidity labels are displayed separately from trading signals, allowing traders to distinguish between a market event and a confirmed entry.
Order Blocks, FVG and Equilibrium
The indicator visualizes key Smart Money Concepts elements: bullish and bearish Order Blocks, Fair Value Gap zones, Equilibrium 50% between relevant structural extremes.
These zones are displayed directly on the chart and help identify potential reaction areas, imbalances, and zones of market interest.
Fixed Range Volume Profile
Structure Pulse SMC includes a built-in Fixed Range Volume Profile that analyzes a selected range of closed candles and shows tick-volume distribution across price levels.
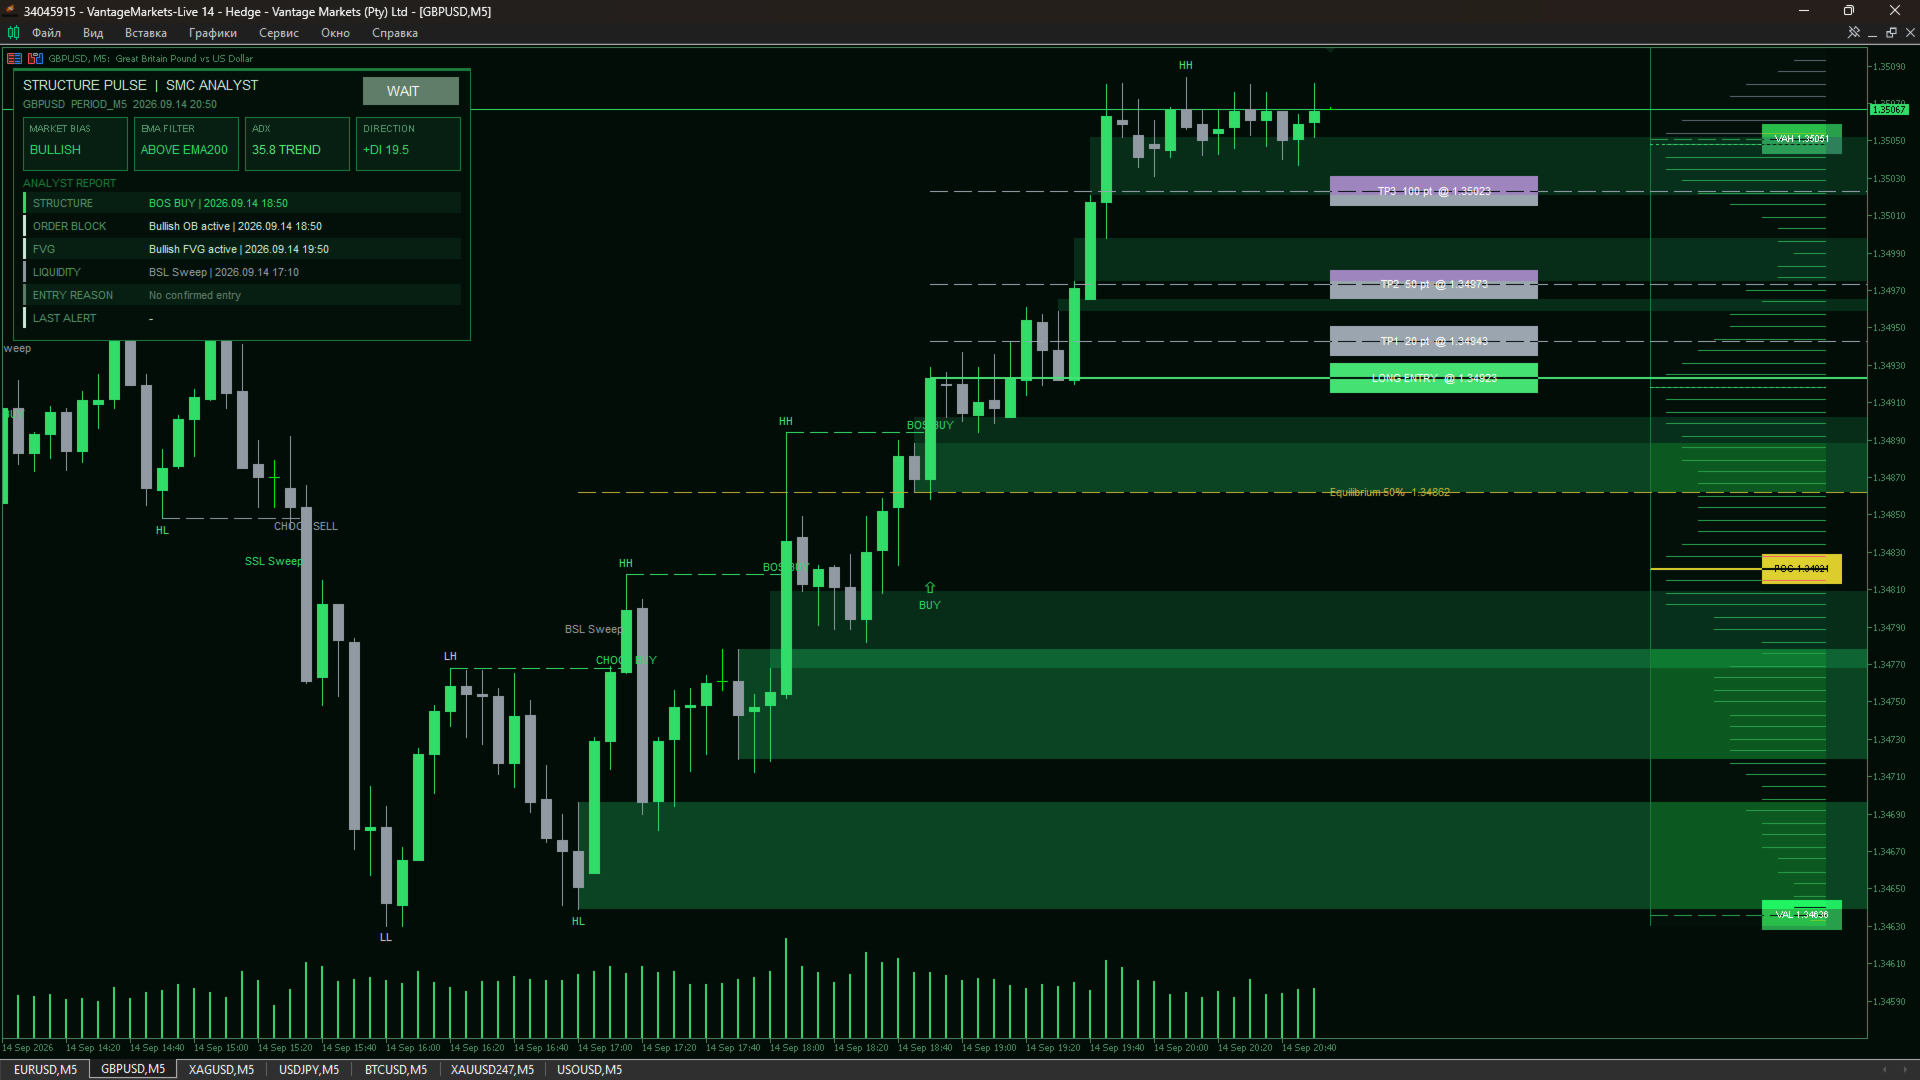
The profile displays POC — the price level with the highest volume, VAH — the upper boundary of the Value Area, VAL — the lower boundary of the Value Area, HVN — High Volume Nodes, LVN — Low Volume Nodes.
The Volume Profile is positioned on the right side of the chart and can be configured by calculation depth, number of price levels, profile width, and Value Area percentage.
EMA and ADX Signal Filtering
Trading signals are additionally filtered by EMA and ADX. BUY signals are considered when price is above the EMA, SELL signals are considered when price is below the EMA, ADX is used to evaluate trend strength, +DI and -DI confirm directional bias.
If the filtering conditions are not met, the indicator does not generate a confirmed trading signal. This helps reduce weak and countertrend entries.
Signals and Trade Levels
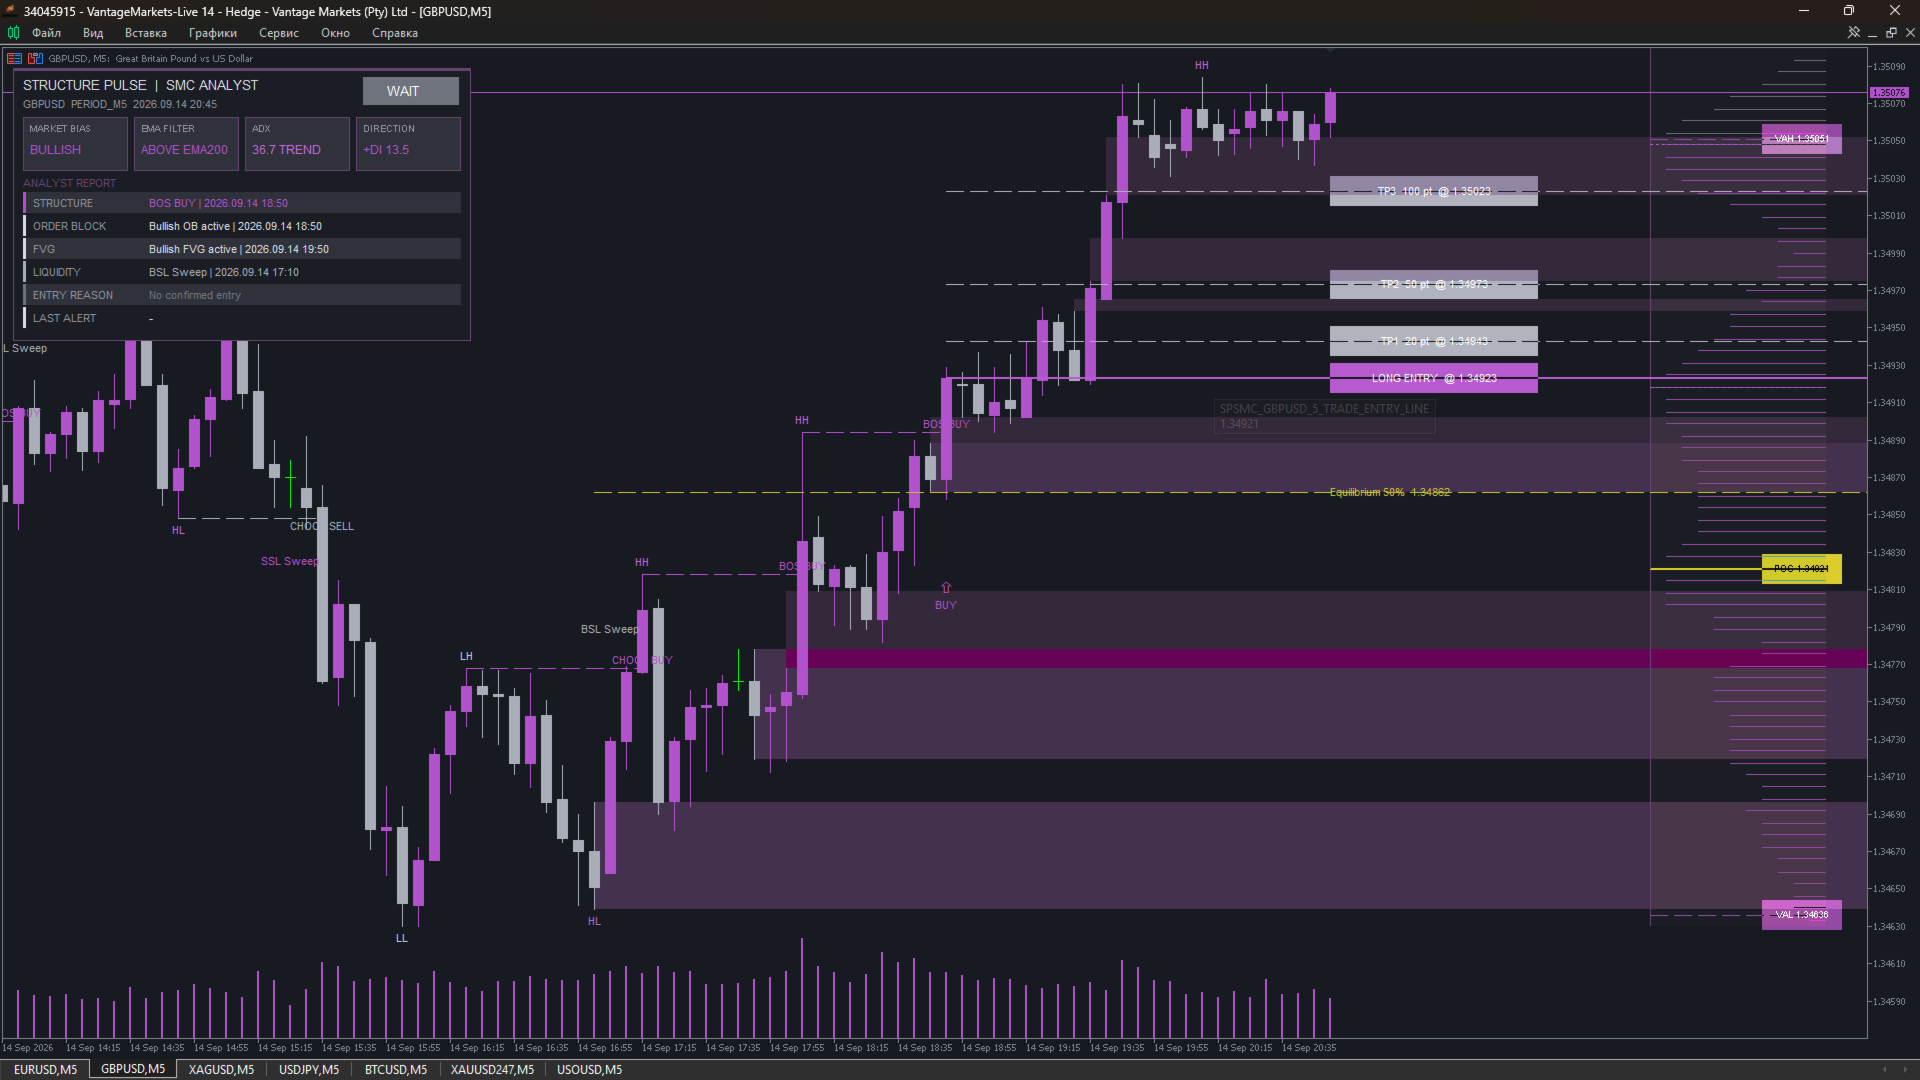
When a signal is confirmed, Structure Pulse SMC displays BUY or SELL, an entry arrow, Entry, Stop Loss, TP1, TP2, TP3.
Stop Loss and Take Profit distances are specified in points. Stop Loss visualization can be enabled or disabled separately. Arrow and label positioning is optimized to reduce overlap with BOS, CHOCH, BSL Sweep, and SSL Sweep.
Information Panel
The compact information panel provides a quick overview of the current market situation and displays BUY, SELL or WAIT status, market structure direction, price position relative to the EMA, ADX value, +DI/-DI direction, Order Block status, FVG status, latest liquidity event.
This allows traders to review the most important market information in one place without analyzing every chart element separately.
Alerts
The indicator supports multiple notification types for market events and confirmed signals. Depending on the settings, alerts can be generated for BUY and SELL, BOS, CHOCH, BSL and SSL Sweep, Trendline Break, Order Block, FVG.
Color Schemes
Several ready-made chart themes are available: Standard MT5 Chart, Neon Cyan/Magenta, Emerald Green, Graphite Purple, Custom.
You can use a modern dark interface or keep the standard MetaTrader 5 chart appearance. The main visual elements can be configured separately.
Structure Pulse SMC combines market structure, Smart Money Concepts, liquidity analysis, Volume Profile, trend filters, and trade levels in one tool. The indicator is designed for traders who need a clear visual system for market analysis, signal confirmation, and trade planning.