Quantum SnR Thrones
- インディケータ
- バージョン: 1.0
- アクティベーション: 20

Clear Market Structure, Smarter Trades
Professional Support & Resistance Visualizer is a powerful MT5 indicator that automatically identifies and displays high-probability support and resistance levels directly on your chart. No more manual trendline drawing—let the algorithm do the heavy lifting while you focus on what matters: executing quality trades.
Key Features
Intelligent Level Detection
-
Automatically identifies significant support and resistance zones using advanced price action algorithms
-
Filters out market noise to show only the levels that matter
-
Merges nearby levels into clean, actionable zones
Dynamic Updates
-
Levels update automatically as new market structure forms
-
Real-time recalibration ensures you always see current key levels
-
No need to refresh or reload—the indicator works continuously
Clean, Professional Visualization
-
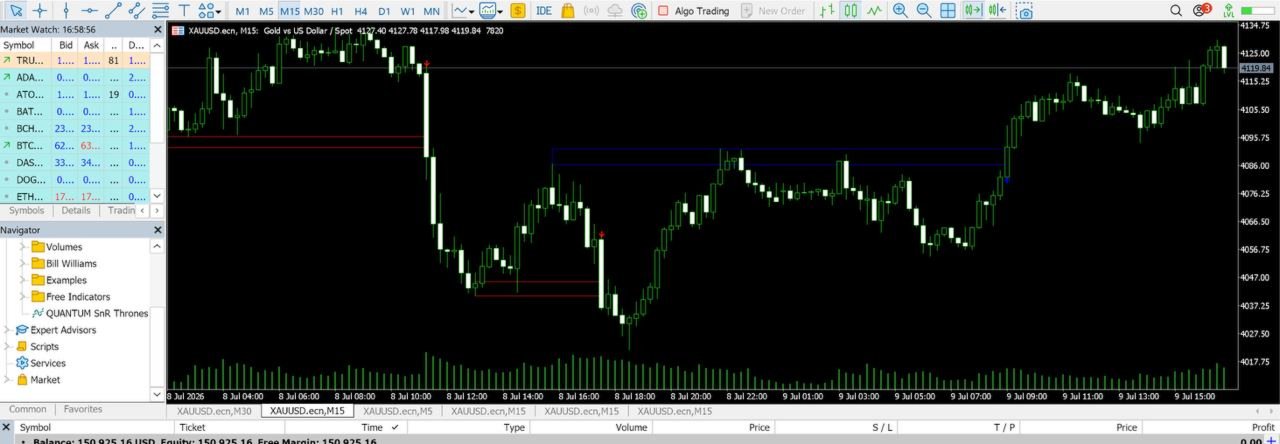
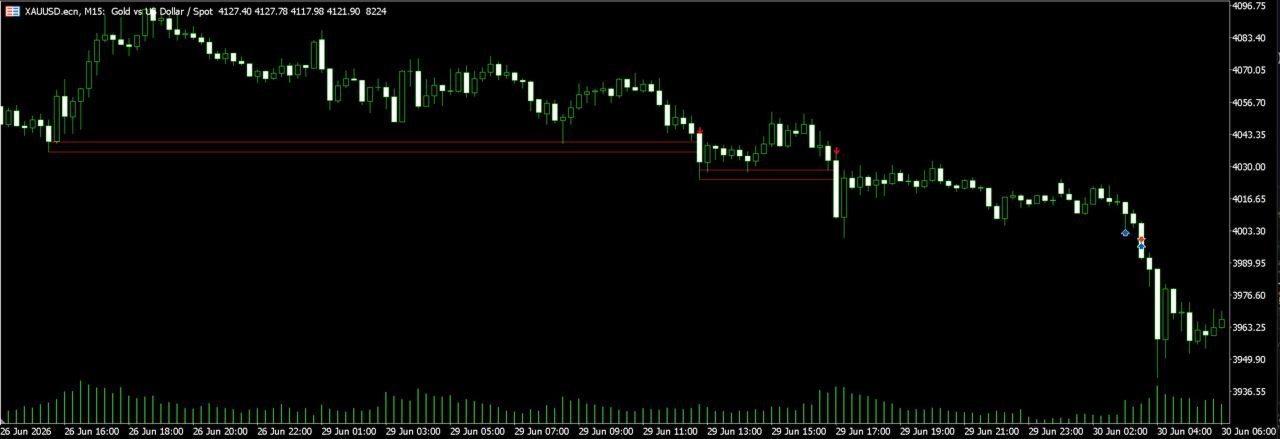
Distinct colors for support (green) and resistance (red) zones for instant recognition
-
Non-cluttered chart appearance—only the strongest levels displayed
-
Fully customizable colors, line styles, and sensitivity settings
Multi-Timeframe Compatibility
-
Works seamlessly across all MT5 timeframes from M1 to MN
-
Adapts to any trading style—scalping, day trading, swing trading, or position trading
Performance Optimized
-
Lightweight code that won't slow down your terminal
-
Fast calculation even on multiple charts simultaneously
-
Works on all symbols including Forex, XAUUSD, Indices, Cryptocurrencies, Commodities, and Stocks
What You'll See on Your Chart
When you attach this indicator, you'll immediately see:
-
Support Levels (green zones) - Areas where buying pressure historically halts price declines
-
Resistance Levels (red zones) - Areas where selling pressure historically caps price advances
-
Level Strength - Indication of how many times a level has been tested
-
Clean Zones - Merged levels that create clear, actionable trading areas
How It Helps Your Trading
Identify High-Probability Entries
Stop guessing where to enter. Use clean support and resistance zones to time your entries with precision.
Place Logical Stop Losses
Set stops beyond key levels where the market is most likely to react—improving your risk-reward ratio.
Set Realistic Take Profit Targets
Use resistance levels as profit targets for long trades and support levels for short trades.
Spot Breakout Opportunities
When price breaks through a strong level, you'll see it immediately—allowing you to catch breakouts early.
Avoid False Breakouts
By seeing the full picture of key levels, you can distinguish between genuine breakouts and false moves.
Who Is This For?
-
Price Action Traders - Clean levels for pure price action analysis
-
Scalpers - Quick identification of key reaction zones on lower timeframes
-
Day Traders - Clear structure for intraday decision making
-
Swing Traders - Higher timeframe levels for position planning
-
Smart Money Traders - Understand where institutional orders are likely placed
Perfect For All Markets
| Market | Compatibility |
|---|---|
| Forex | All major and minor pairs |
| Gold (XAUUSD) | Fully supported |
| Indices | US30, NASDAQ, S&P500, and more |
| Cryptocurrency | BTCUSD, ETHUSD, and others |
| Commodities | Oil, Silver, and more |
| Stocks | All available symbols |
Customization Options
Every aspect of the indicator can be adjusted to match your trading style:
| Parameter | What It Controls |
|---|---|
| look back Period | How far back to analyze for levels |
| Sensitivity. | How many touches required for a level to be significant |
| Zone Thickness | Visual width of support/resistance zones |
| Merge Distance | How close levels must be to merge into one zone |
| Colors | Custom colors for support and resistance |
| Line Styles | Solid, dashed, or dotted lines |
Recommended Use
For the highest-probability setups, combine this Support & Resistance Visualizer with:
-
Trend Confirmation - Use with moving averages or ADX to trade with the trend
-
Momentum Indicators - RSI or MACD for additional confirmation
-
Candlestick Patterns - Pin bars, engulfing patterns, or inside bars at key levels
-
Volume Analysis - Volume spikes at support/resistance confirm interest
Professional Tip: Always check higher timeframe levels before entering trades. A level that's significant on H4 or Daily will be more powerful than a level from M15 alone.
Why Traders Choose This Indicator
Saves Time - No more manual trendline drawing
Removes Subjectivity - Algorithm-based level detection
Clean Charts - Only the strongest levels displayed
Versatile - Works on any timeframe and any symbol
Professional Grade - Used by traders who rely on structure analysis
Disclaimer
This indicator is a tool for market analysis and does not constitute financial advice. Trading involves significant risk. Past performance does not guarantee future results. Always use proper risk management and consider your personal financial situation before trading.