EMA Multi Timeframe
- インディケータ
- バージョン: 4.0
- アクティベーション: 5

EMA MTF v4.0 – Multi-Timeframe EMA Dashboard
One Glance. All Timeframes. Instant Direction. EA-Ready.
EMA MTF v4.0 transforms your chart into a complete multi-timeframe command centre. No more switching between timeframes or guessing alignment. See every EMA direction at once on an ultra-clean, CPU-optimized MT5 display.
What It Answers in Seconds
| Question | How It Answers |
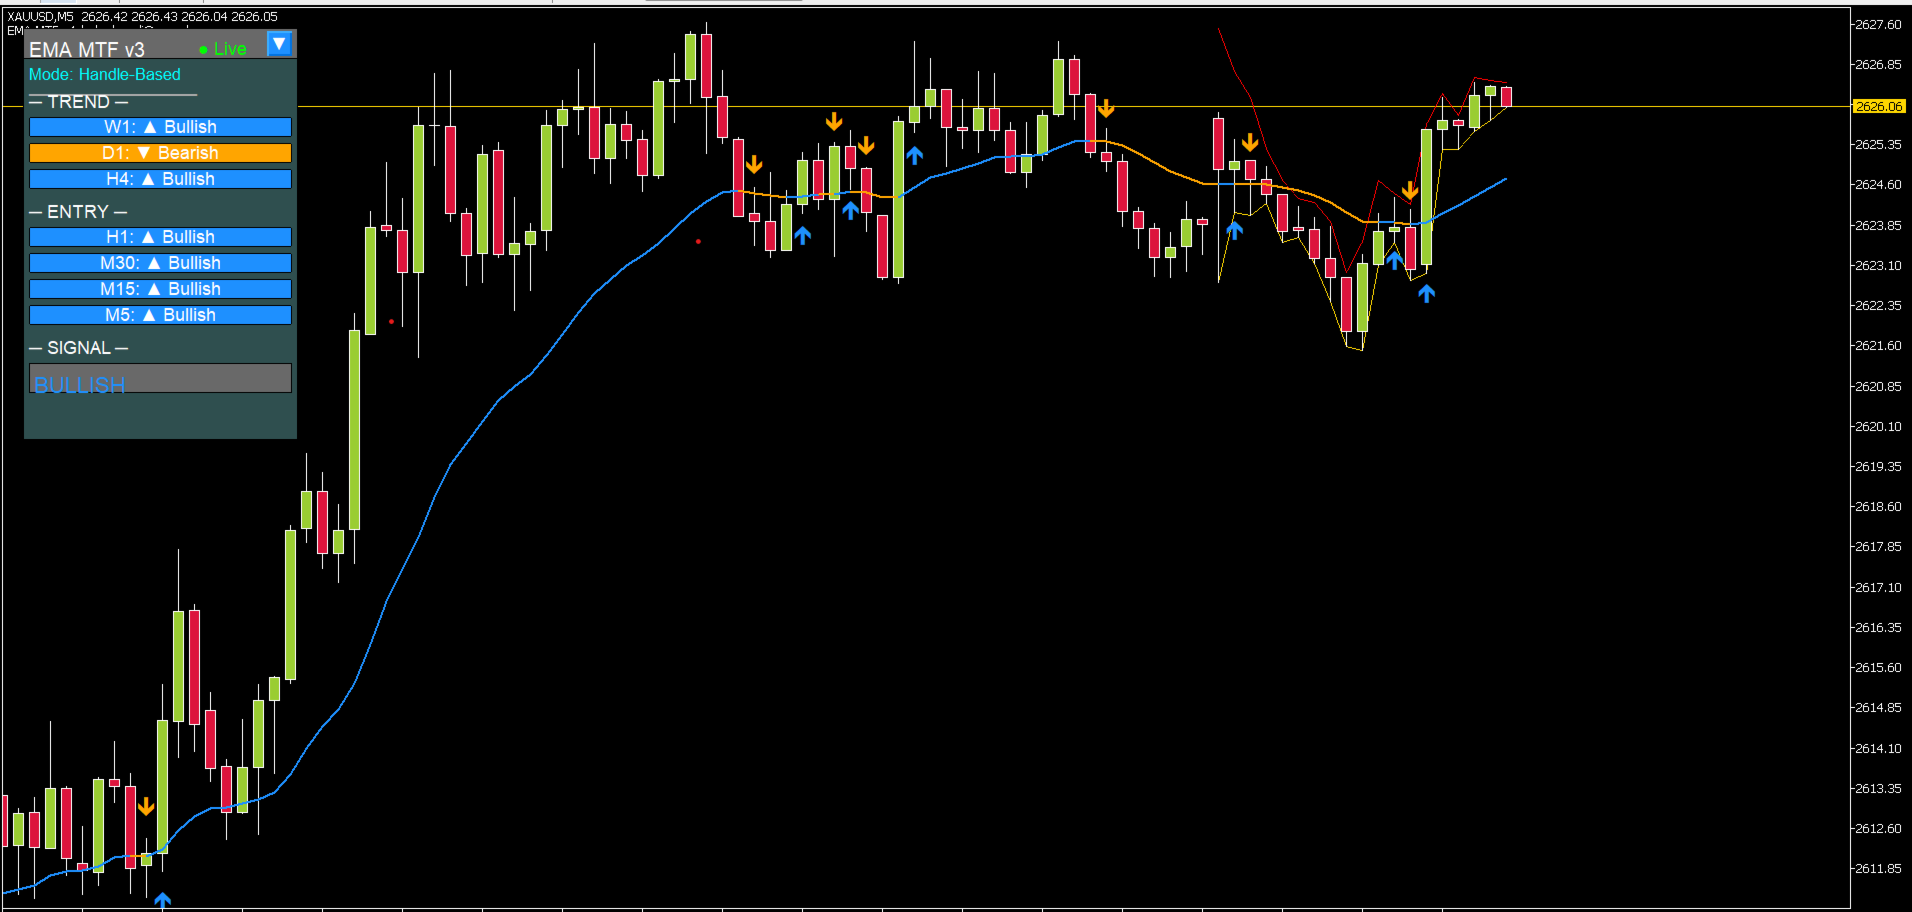
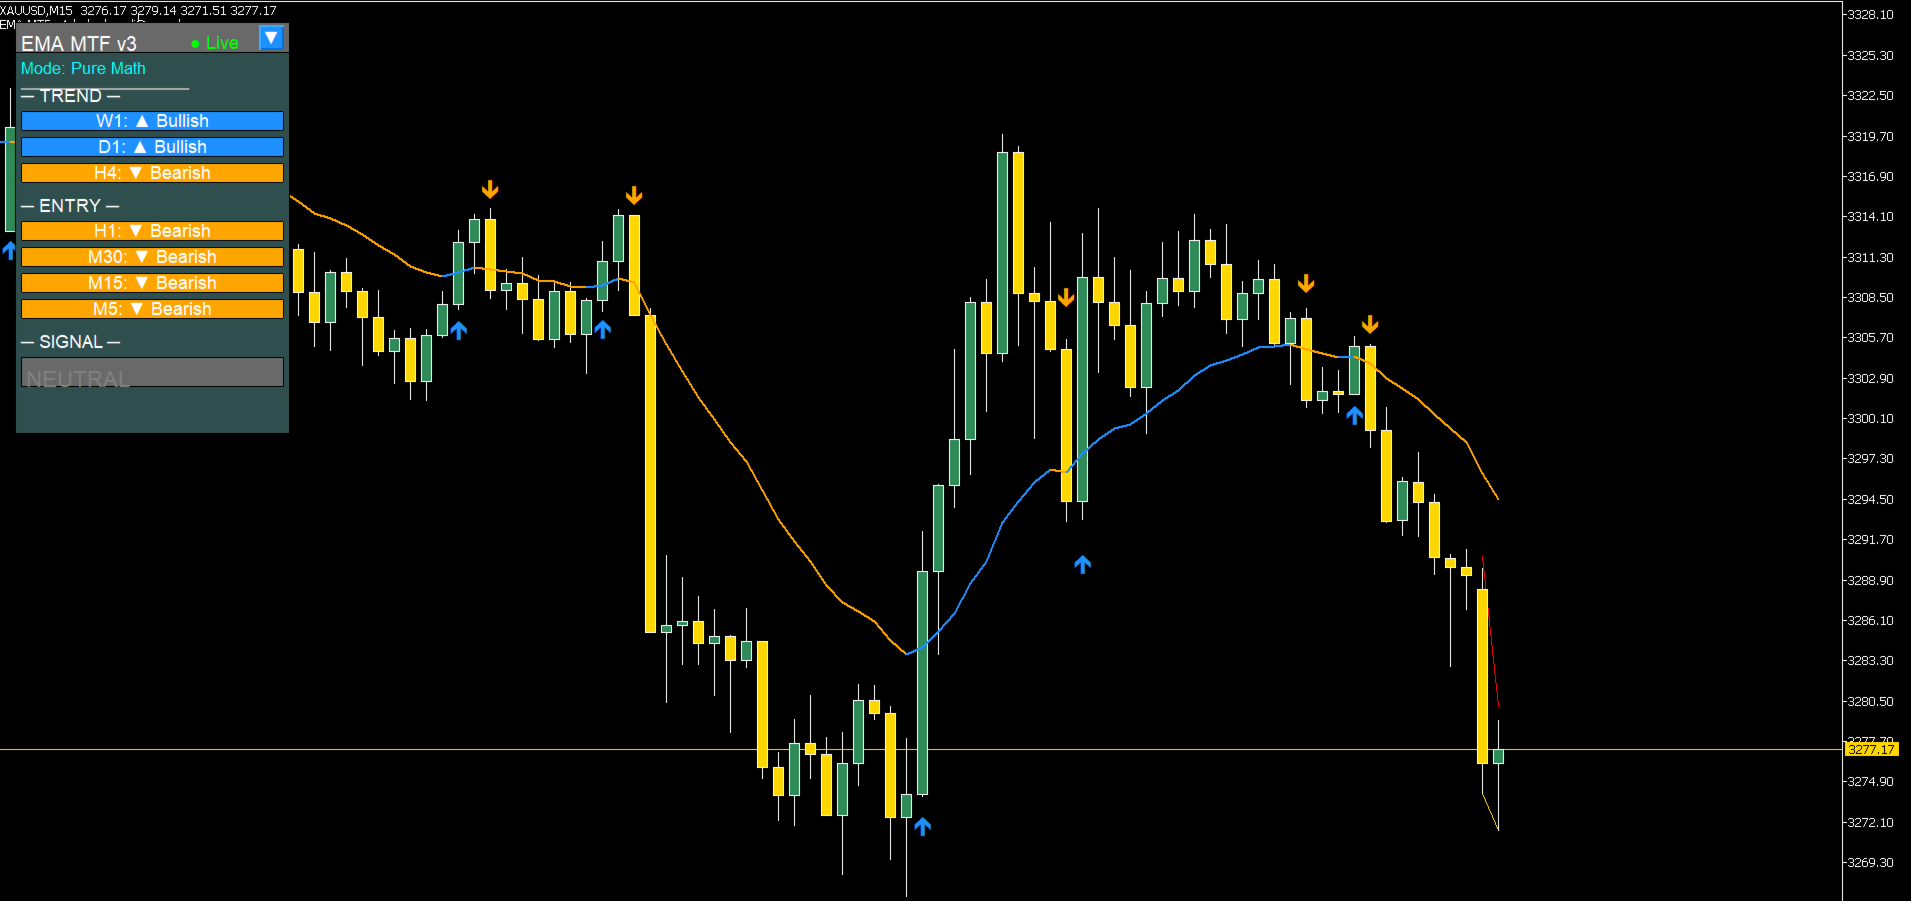
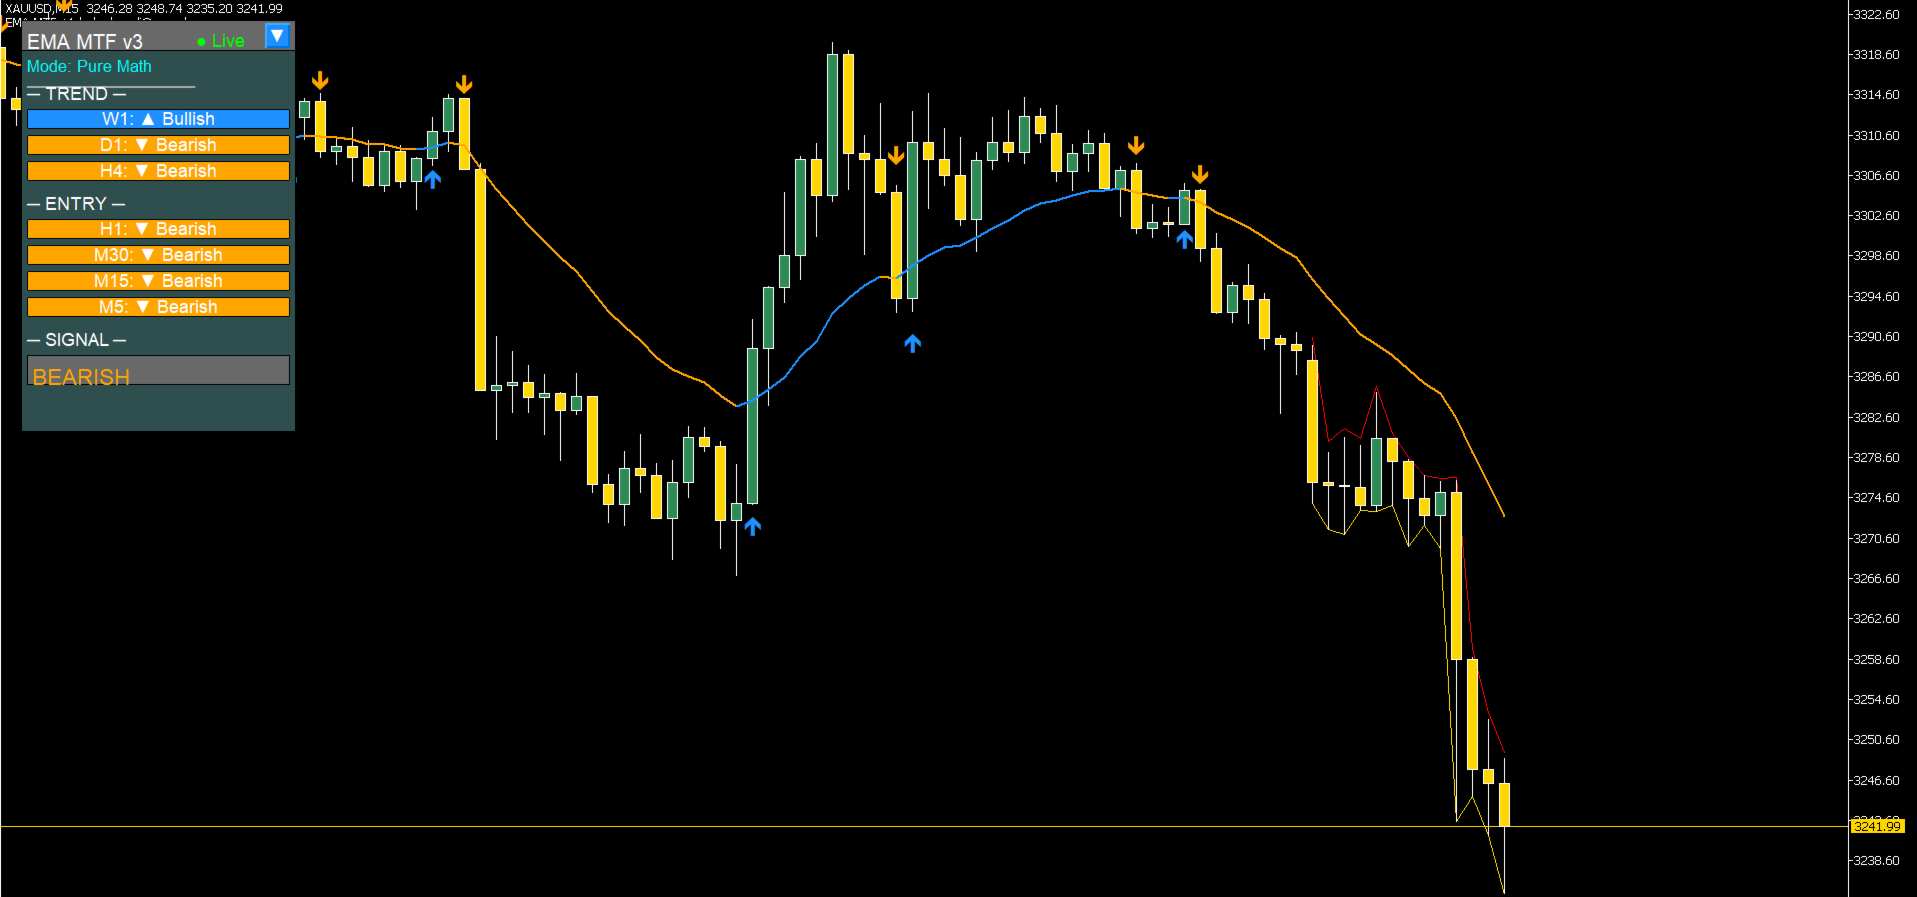
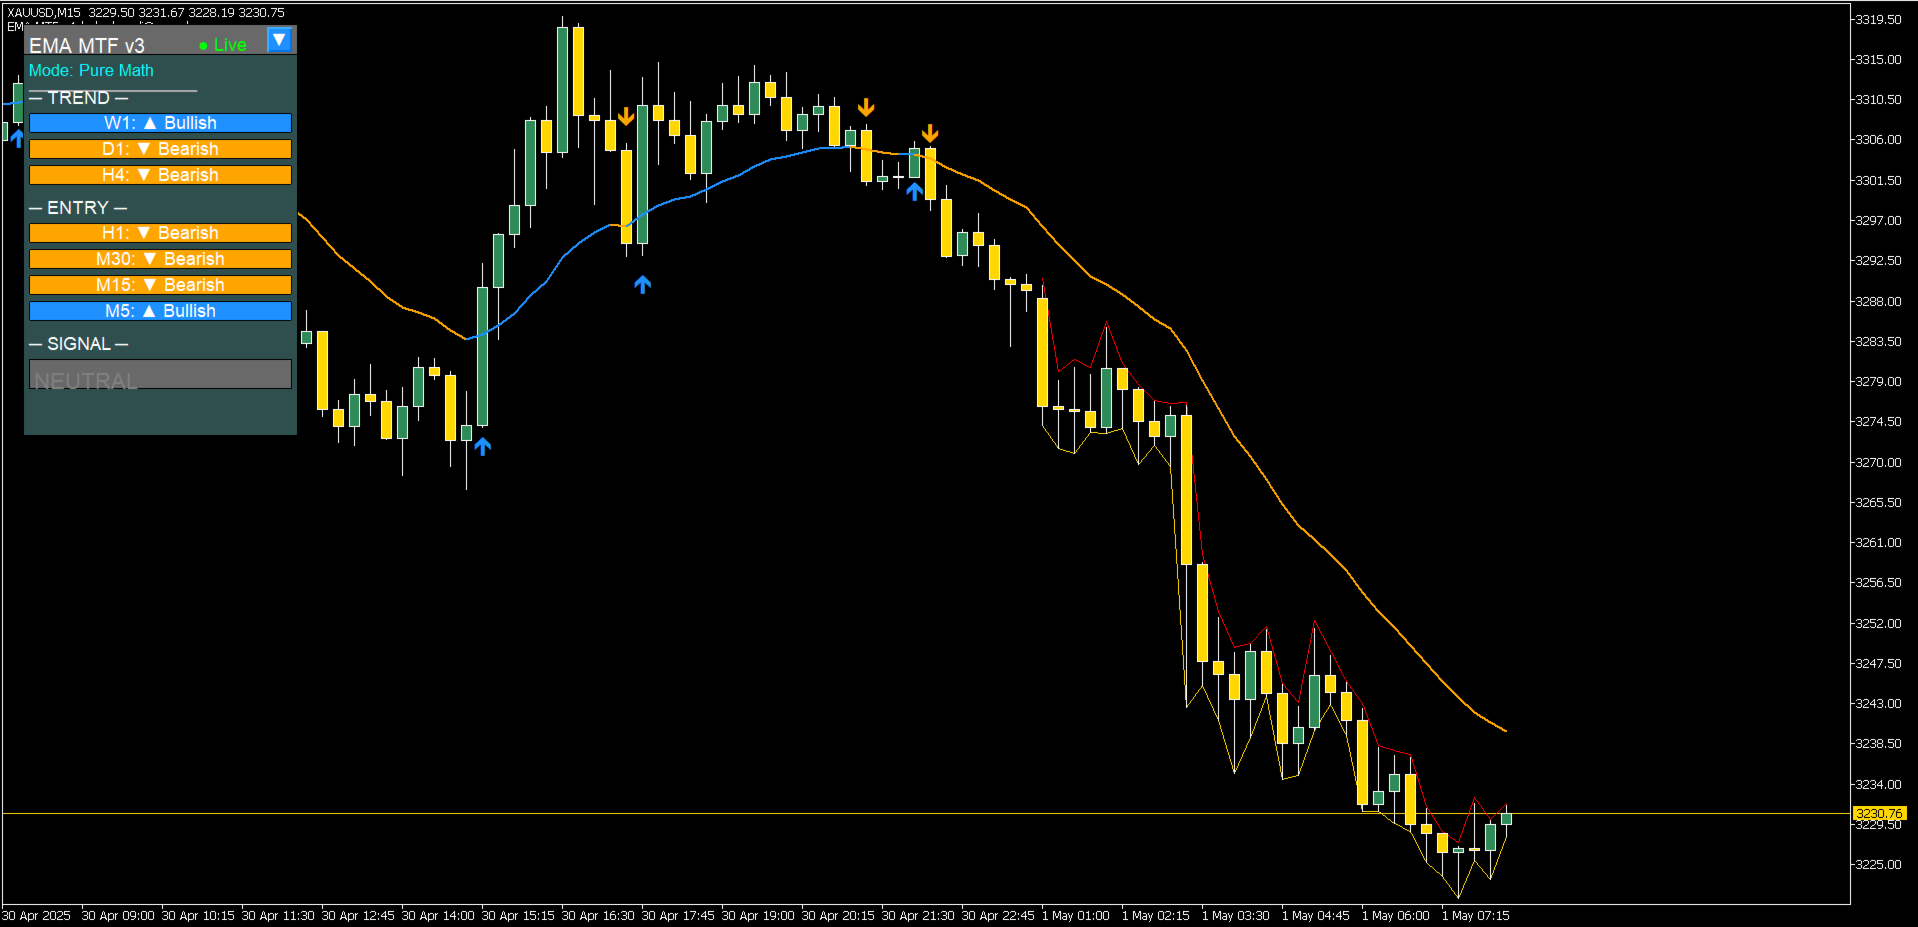
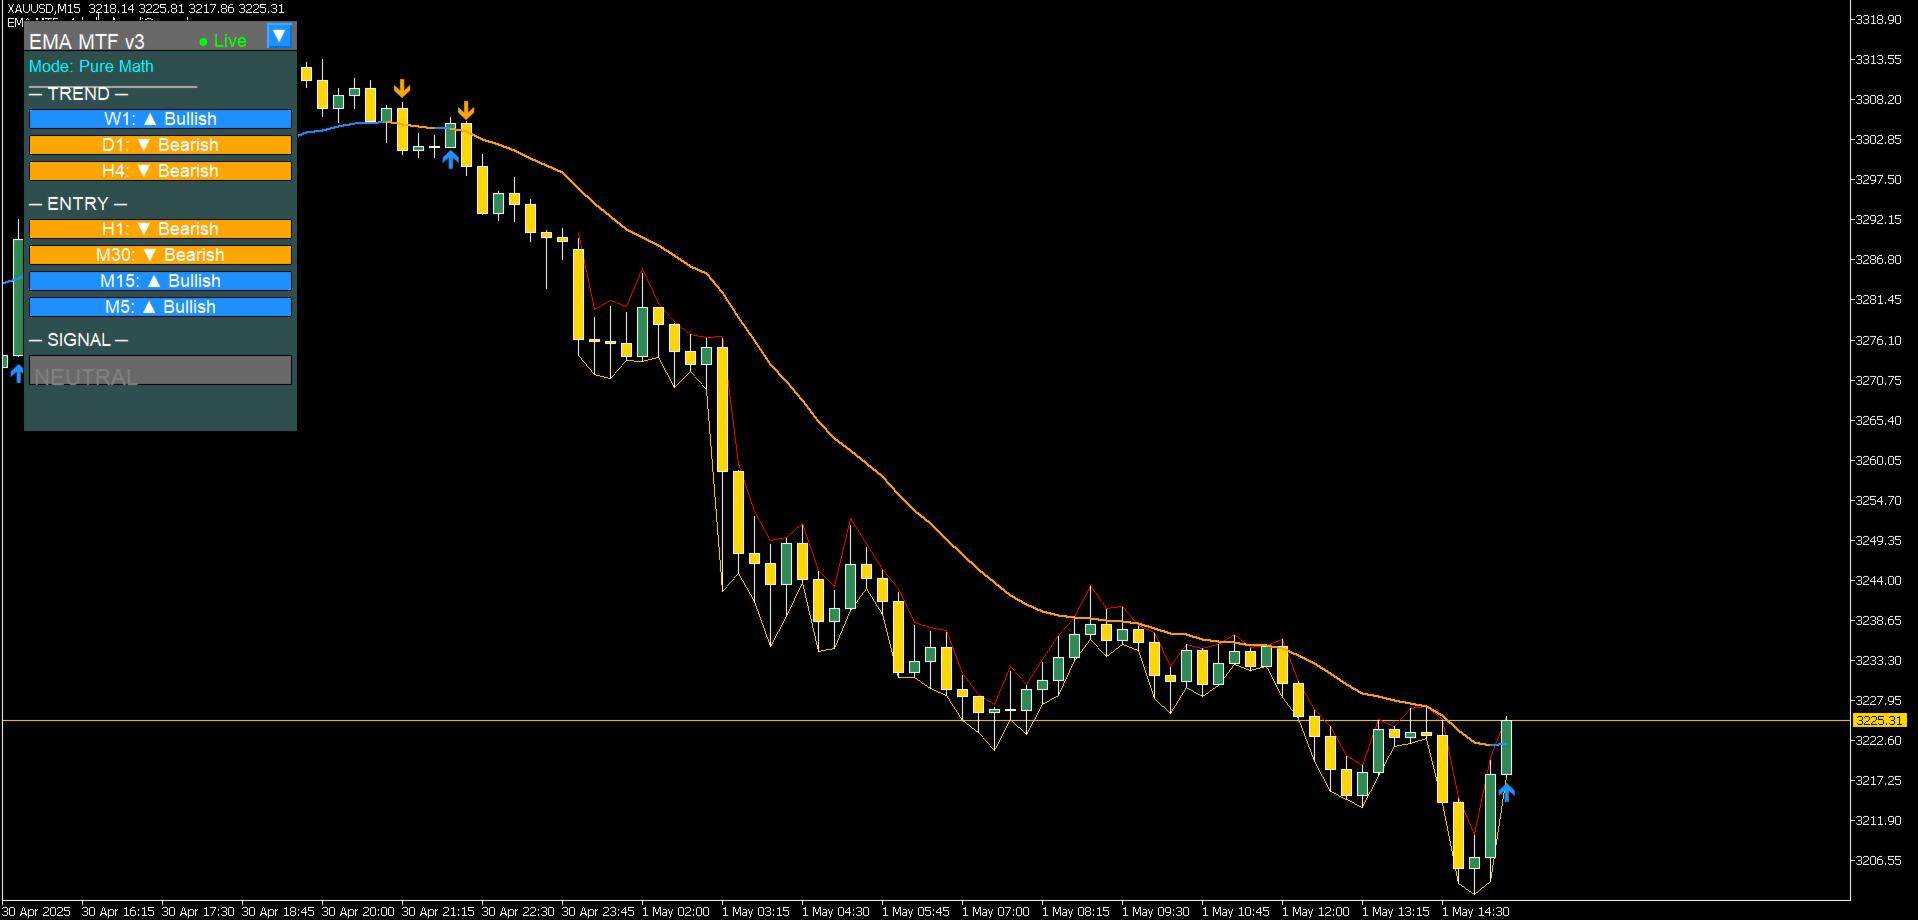
| Is W1 bullish or bearish? | Blue = Bullish ▲ / Orange = Bearish ▼ |
| Do all timeframes agree? | Dashboard shows all 7 major timeframes at once |
| When should I enter? | Graphical arrows plot when local chart EMA changes direction |
| Is this a pullback or reversal? | Entry timeframes (H1–M5) separate dynamically from macro Trend (W1–H4) |
| What's the overall bias? | Smart Weight Calculation: BULLISH / BEARISH / NEUTRAL |
| Can my EA use this? | Yes – 4 signal buffers are fully exposed sequentially |
What It Does
Main Chart Features:
-
EMA line with dynamic color mapping (Blue = rising, Orange = falling)
-
Clear Buy/Sell arrows calculated automatically when the EMA changes trend direction
Dashboard Panel:
-
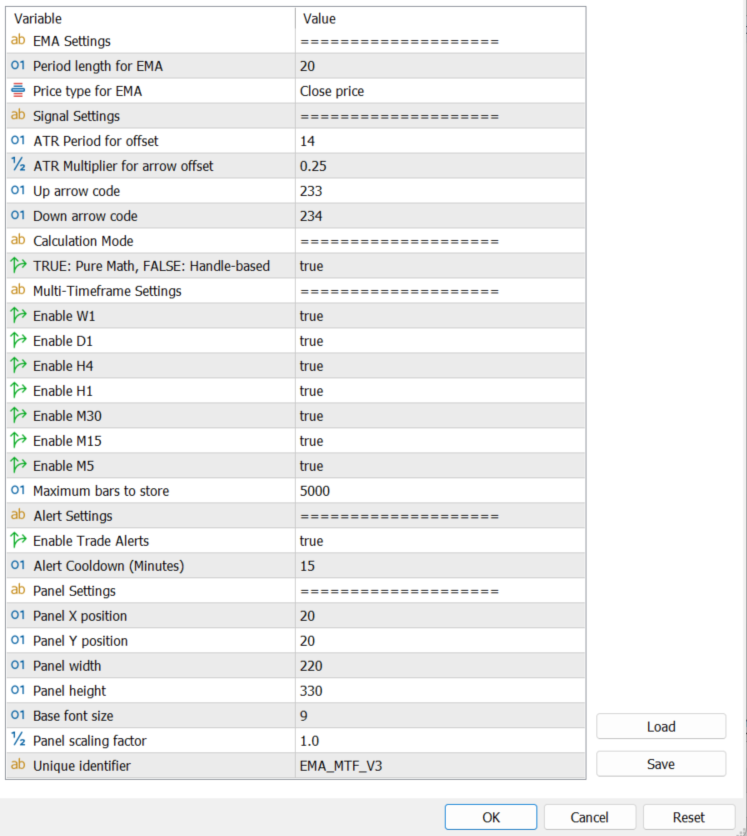
7 timeframes monitored concurrently: W1, D1, H4, H1, M30, M15, M5
-
Auto-scaling compact buttons show trend direction at a glance
-
Static positioning layout – expands and collapses right where you place it
-
Chart Interconnectivity: Click any timeframe button to switch your current chart instantly
EA-Ready Signal Buffers:
-
Buffer 0: Real-time raw EMA values
-
Buffer 1: Dynamic color trend state (0 = Bullish, 1 = Bearish)
-
Buffer 2: Buy signal trigger prices (returns EMPTY_VALUE if no setup)
-
Buffer 3: Sell signal trigger prices (returns EMPTY_VALUE if no setup)
Alert Features:
-
Custom terminal pop-up alerts when overall panel market bias flips
-
Configurable built-in cooldown timer to prevent spam indicators during choppy markets
Why Traders Use It
Engineered for MT5 Expert Advisors
Call the indicator data straight from your automated strategies using native MT5 handles and buffers. No slow parsing or complex conversions required.
// 1. Initialize indicator handle within your EA's OnInit() block int emaMtfHandle = iCustom(_Symbol, _Period, "EMA MTF v3.30", 20, true); // 2. Fetch data inside OnTick() (Example: Reading Buffer 1 for Trend Direction) double trendDirection[]; ArraySetAsSeries(trendDirection, true); CopyBuffer(emaMtfHandle, 1, 0, 1, trendDirection); // trendDirection[0] returns 0 for clear Bullish or 1 for clear Bearish
Strategy Tester Verified
Recalculates every tick cleanly. What you look at inside backtests matches live execution perfectly. No lag, no paint changes.
Hyper CPU-Efficient Design
-
Interface objects are created exactly once and updated in place—never dropped and recreated.
-
Only recalculates active bars that change state, leaving your platform responsive.
Technical Specifications
| Specification | Detail |
| Timeframes Monitored | W1, D1, H4, H1, M30, M15, M5 |
| Indicator Type | Interactive Chart Overlay + Sidebar Dashboard Panel |
| Core Engine Mode | Pure Mathematics calculation array or Handle-based |
| Safe History Bars Limit | Configurable (Default: 5,000 bars) |
| EA Integration | Exposed sequentially across Buffers 0, 1, 2, and 3 |
Questions or Support? Contact: ebrah.ssali@nnanda.com or message here directly
Quick Reference Card
                DASHBOARD VALUES:
▲ Bullish  (Blue)   = EMA slope trending upwards
▼ Bearish  (Orange) = EMA slope trending downwards
● Neutral  (Gray)   = EMA flat or calculation parsing

NATIVE EA BUFFERS:
Buffer 0 = Real-time EMA line value
Buffer 1 = Current direction state (0 = BULLISH / 1 = BEARISH)
Buffer 2 = Buy arrow trigger price (or EMPTY_VALUE)
Buffer 3 = Sell arrow trigger price (or EMPTY_VALUE)

SMART BIAS RECOMMENDATION ENGINE:
Calculated dynamically using weighted multi-timeframe correlation.
Trend-defining timeframes (W1, D1, H4) carry double weight.
BULLISH  = Confirmed upward market structure (Score ≥ 0.7)
BEARISH  = Confirmed downward market structure (Score ≤ -0.7)
NEUTRAL  = Mixed timeframes or direction consolidation

ON-CHART REVERSAL ARROWS:
Buy Arrow  = Prints immediately when the active EMA changes from Orange to Blue
Sell Arrow = Prints immediately when the active EMA changes from Blue to Orange