TrendSync Pro

Multi-Timeframe Trend Dashboard Indicator

Overview

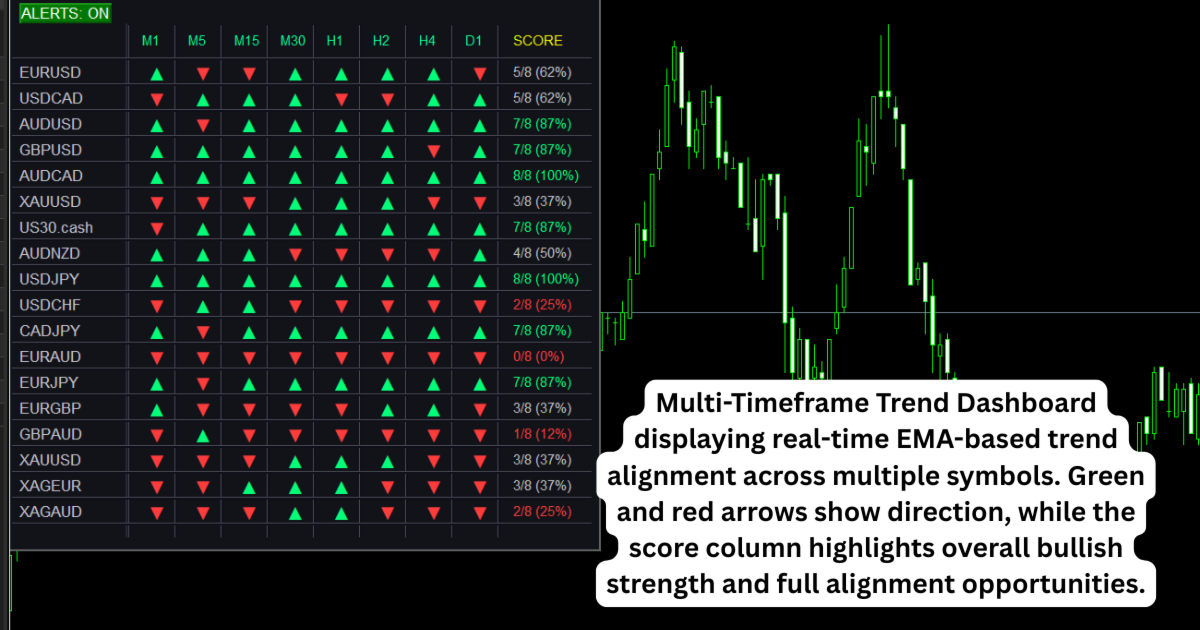
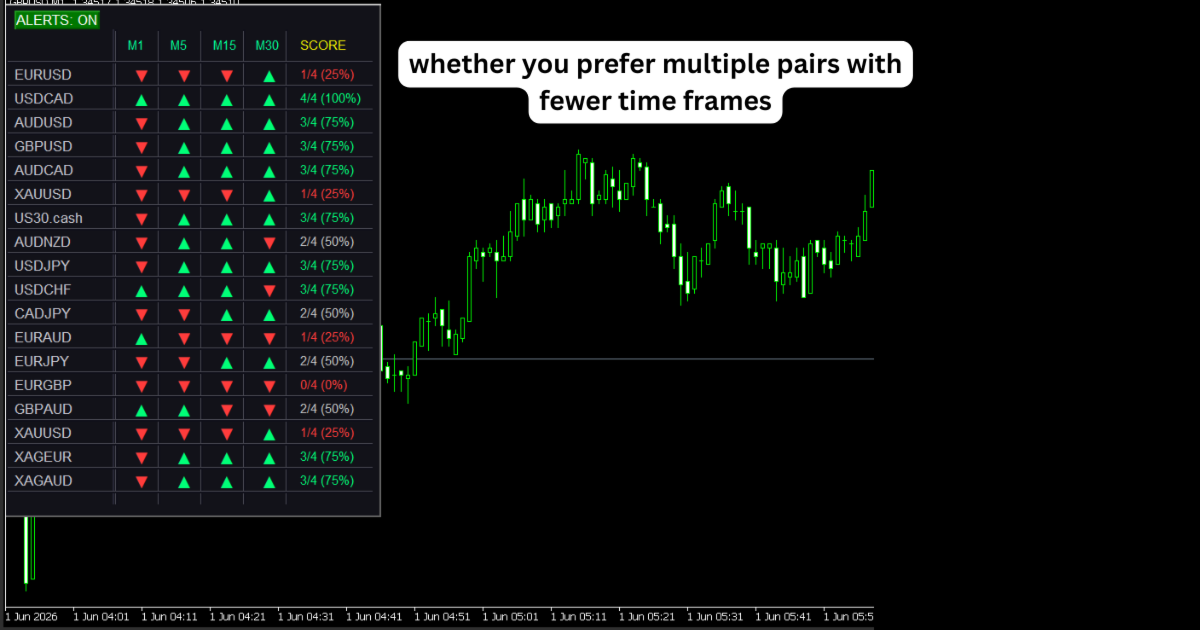
The Multi-Timeframe Trend Dashboard Indicator is specifically designed for traders who want to instantly visualize market direction across multiple timeframes and symbols within a single, structured dashboard.

Whether you trade Forex, Indices, Commodities, or Cryptocurrencies, this tool provides a fast and intuitive way to monitor trend alignment, identify high-probability opportunities, and make more informed trading decisions.

Instead of constantly switching between charts and timeframes, all essential trend information is consolidated into one professional panel, improving workflow efficiency and saving valuable analysis time.

Key Features

Multi-Timeframe Trend Monitoring

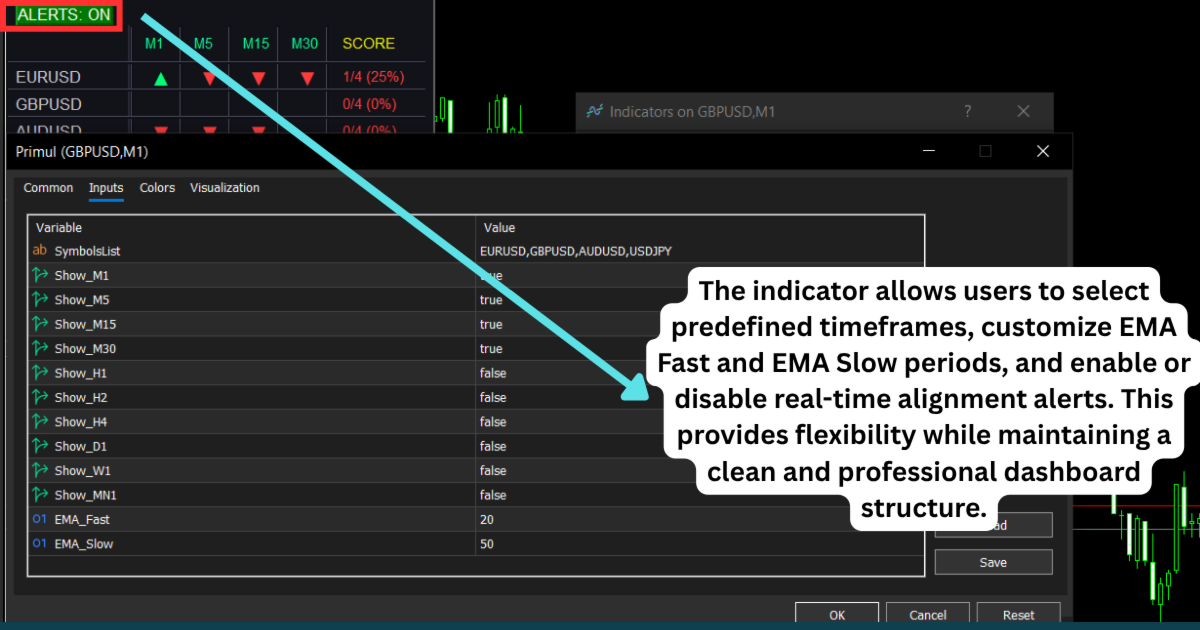
The indicator determines trend direction using a Dual EMA System (Fast EMA vs. Slow EMA) across user-selected timeframes.

Each timeframe is displayed in a clear dashboard format using directional symbols:

  • ▲ Bullish Trend

  • ▼ Bearish Trend

This allows traders to instantly evaluate market structure without manually changing charts.

Predefined Timeframe Selection

Select any combination of the following timeframes:

  • M1

  • M5

  • M15

  • M30

  • H1

  • H2

  • H4

  • D1

  • W1

  • MN1

Benefits

  • No manual timeframe input

  • Reduced configuration errors

  • Clean and intuitive workflow

  • Maximum flexibility

Trend Strength Score (Alignment Percentage)

For every monitored symbol, the indicator calculates a real-time Trend Strength Score.

Formula

  • Number of Bullish Timeframes

  • Divided by Total Selected Timeframes

  • Displayed as a Percentage

Example

4 / 5 = 80% Bullish Alignment

This score helps traders quickly determine whether market conditions are:

  • Strongly Trending

  • Weakly Trending

  • Mixed / Neutral

Visual Color Coding

  • 🟢 Green = Strong Bullish Alignment

  • 🔴 Red = Strong Bearish Alignment

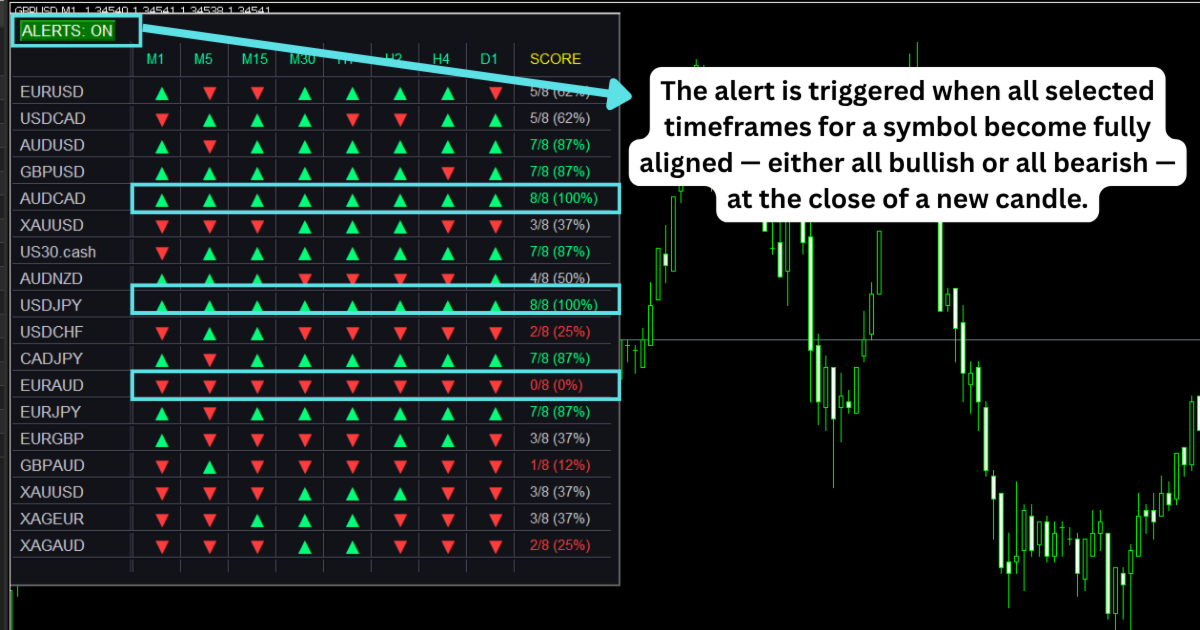
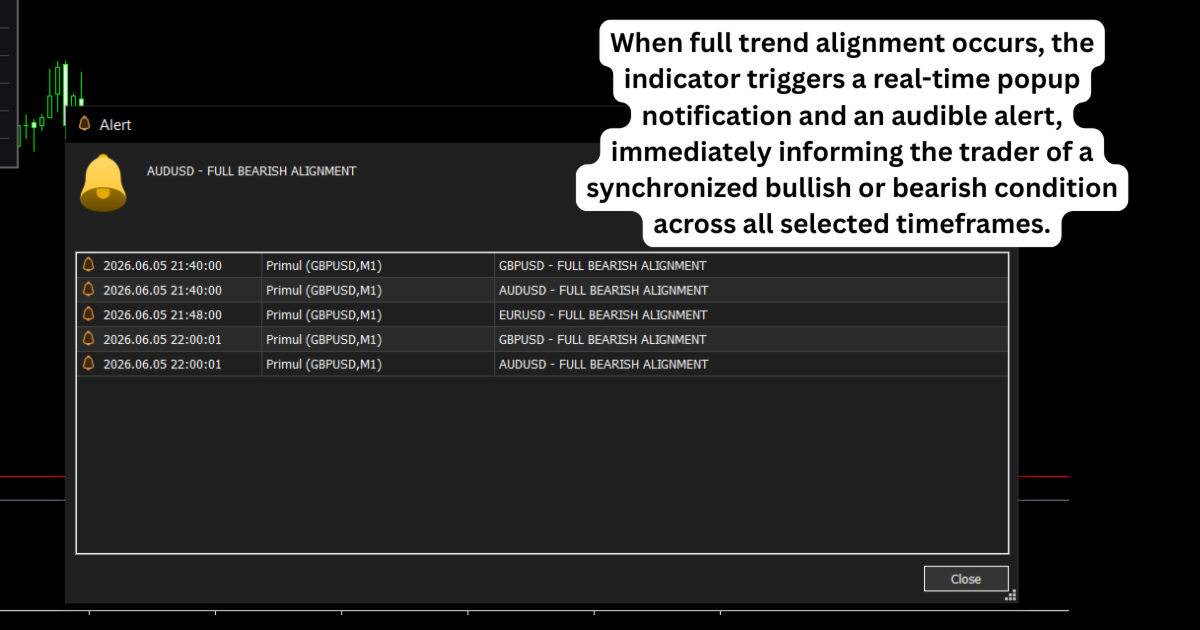
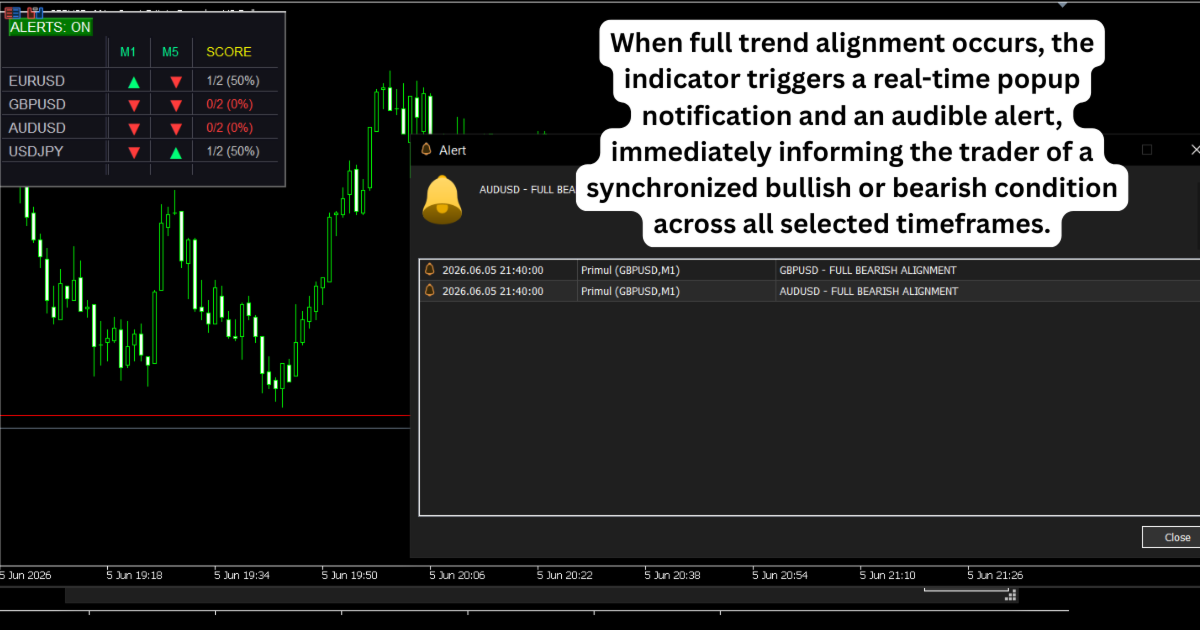
Full Alignment Alerts

The dashboard includes an advanced Full Alignment Detection System.

Alerts are generated whenever all selected timeframes become aligned in the same direction.

Alert Conditions

Full Bullish Alignment

  • All selected timeframes are bullish

Full Bearish Alignment

  • All selected timeframes are bearish

This feature helps traders identify synchronized market momentum across multiple timeframes—an important condition used by many professional trading strategies.

Alert Control Button (ON / OFF)

A built-in dashboard button allows instant alert management directly from the chart.

Available States

  • ALERTS: ON

  • ALERTS: OFF

Advantages

  • No need to open indicator settings

  • Quick adaptation to trading sessions

  • Greater workflow efficiency

Alerts are triggered only after candle close, reducing false signals and unnecessary notifications.

Real-Time Monitoring

The indicator continuously monitors all selected symbols and timeframes in real time.

Update Logic

Trend calculations are refreshed only when a new candle closes, ensuring:

  • Stable signals

  • No flickering

  • No unnecessary recalculations

  • Professional dashboard behavior

Advantages for Traders

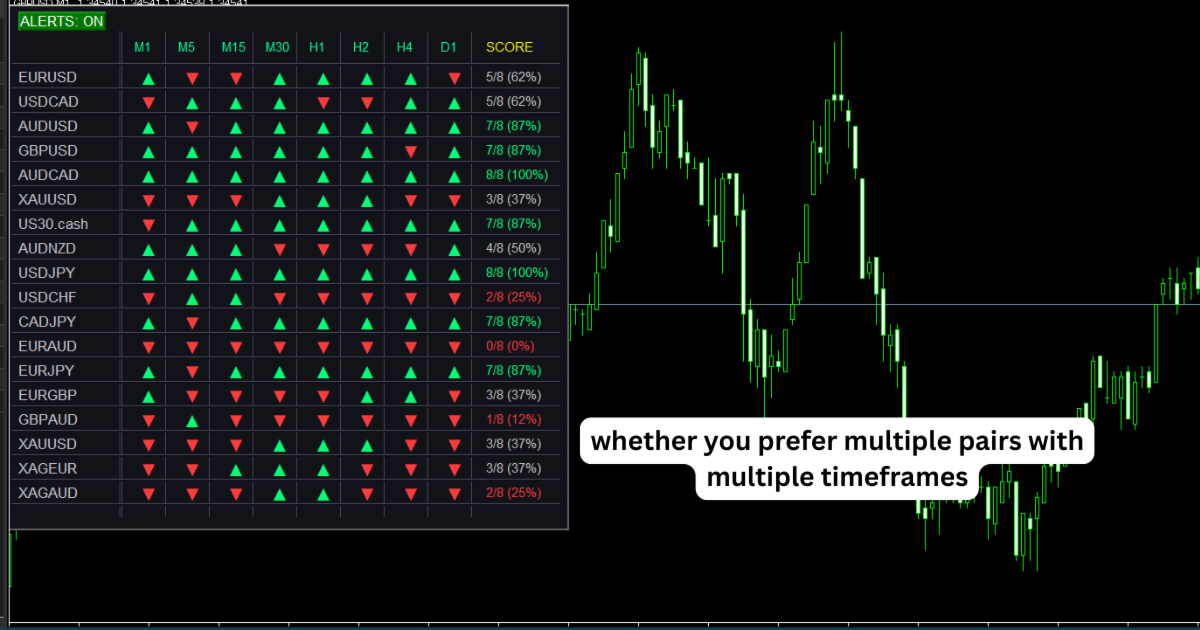
Instant Market Overview

Monitor multiple symbols and timeframes from a single dashboard.

Faster Decision-Making

Quickly identify high-probability trend opportunities through visual alignment and trend scoring.

Improved Trade Filtering

Avoid low-quality setups by focusing on markets with strong directional agreement.

Multi-Timeframe Confirmation

Perfect for traders using top-down analysis and trend confirmation techniques.

Increased Efficiency

Reduce chart clutter, save analysis time, and maintain a more systematic trading process.

How to Use

Step 1 – Attach the Indicator

Apply the indicator to any chart.

Step 2 – Select Timeframes

Enable the predefined timeframes you wish to monitor.

Step 3 – Analyze Trend Alignment

Use the directional arrows and Trend Strength Score to evaluate market conditions.

Step 4 – Enable Alerts (Optional)

Activate alerts to receive notifications whenever full bullish or bearish alignment occurs.

Conclusion

The Multi-Timeframe Trend Dashboard Indicator is an ideal solution for traders who rely on structured market analysis and trend confirmation across multiple timeframes.

By combining:

  • Clear visual trend representation

  • Alignment percentage scoring

  • Full trend synchronization alerts

the indicator transforms complex market information into a simple, actionable trading dashboard.

Whether you are a:

  • Scalper

  • Day Trader

  • Swing Trader

this tool helps improve discipline, increase efficiency, and identify synchronized market momentum with confidence.

More than just a dashboard, it is a complete multi-timeframe trend management system designed to enhance trading performance and strategic execution.


おすすめのプロダクト
RSI Currency Strength Meter is a powerful and elegant multi-currency indicator that measures the real-time relative strength of the 8 major currencies using RSI logic. By calculating the smoothed performance of each currency across its major pairs and applying the RSI formula, it delivers clean and responsive strength lines that make it easy to spot which currencies are truly strong or weak at any moment. This indicator is particularly useful for visualizing currency correlations and divergence
ティックスプレッドの不均衡に基づくインジケーター。 TF: すべての時間足(M1〜D1)に対応。 ペア: Forex、指数、ゴールド、CFD に対応(JPYペア、ゴールド、CFD向けに自動調整)。 設定: TickWindow (200) – ティック観察ウィンドウ SpreadWeight (1.5) – スプレッドの重み付け NormalizationPeriod (20) – 正規化期間(z-score) Overbought / Oversold (±3.0) – アラート閾値 AlertCooldown (300s) – アラートのクールダウン時間 結論: Proxy Order Flow – Imbalance Tick-Spread v2.4 は、OHLC の変動とスプレッドを分析して買い/売り圧力を検出し、市場の方向性と不均衡ゾーンを明確に示します。
N/B: All our product purchase comes with our free ‘’DAILY   SCALPER EA’’ -   bit.ly/4qlFLNh Whatsapp Developer for yours after successful purchase REVERSAL ENTRY PRO INDICATOR The Smart Money's Secret Weapon for Pinpointing Extreme Reversal Zones INTRODUCTION: THE TRADER'S DILEMMA Every trader knows the frustration: You see a market reaching extremes, but when do you enter? How do you distinguish between a minor pullback and a major trend reversal? Where do you place your stop loss that'
IndCorrelationTable Ind Correlation Table - 通貨ペアの相関関係に基づく方法を使用して、Forex市場でトレーダー取引を支援するように設計されています。 2つの計測器間の相関依存性は、K. PearsonとC. Spearmanの係数によって計算されます。この表の主な機能は、事前設定されたパラメータ、および戦略に従ってトランザクションの方向に従ってトランザクションの「バスケット」を開く可能性についての形式化された信号を出力することである。他のデバイスに通知する必要がある場合、プッシュ通知と電子メールを介して信号を複製することができます。 アプリケーション: 相関係数の計算(変換はキャンドルの終了時に実行されます)。 インジケータの入力パラメータで作業するには、推奨されたしきい値がすでに設定されています。 信号数を増やすには、複数の時間枠に同時にテーブルを適用することができます(M15からH1の推奨時間枠)。 指標パラメータ シンボル(1,2,3) - 通貨ペアのバスケットのリスト(1つのリスト17に入力されたバスケットの数の制限)。 Time
Magic sl NASDAQ 100
Benyamin Naser Mokhtari Karchegani
The indicator now at your disposal is undoubtedly one of the best tools for trading in the NASDAQ 100 market, especially in the 1-minute and 5-minute timeframes. This indicator is meticulously designed for high precision and can be adjusted for other timeframes as well. Simply run it and receive good exit signals. Key Features: Specialized performance in the 1-minute and 5-minute timeframes: While this indicator works in other timeframes as well, its primary focus is on these two timeframes. Co
Trading Utility for Forex Currency Pairs Only not for Gold  Functions Auto Lot Calculation based on Risk Auto stoploss  Auto TakeProfit Breakeven Auto Close Half % Close in percentage with respect to the PIPs Pending Orders BuyLimit Sell Limit with distances BuyStop Sell Stop    with distances Trading Informations Risk in percentage For Multiple trades Combine Takeprofit and Combine Stoplosses
Was: $249  Now: $99   Market Profile defines a number of day types that can help the trader to determine market behaviour. A key feature is the Value Area, representing the range of price action where 70% of trading took place. Understanding the Value Area can give traders valuable insight into market direction and establish the higher odds trade. It is an excellent addition to any system you may be using. Inspired by Jim Dalton’s book “Mind Over Markets”, this indicator is designed to suit the
Cumulative Volume Delta MA-X MTF (Gradient Momentum 搭載) このインディケーターは、MetaTrader 5向けにマルチタイムフレーム(MTF)での累積ボリューム・デルタ(CVD)分析を行います。ティックデータまたはリアルボリュームデータを分析することで、買い圧力と売り圧力の純差を計算し、オーダーフローのセンチメントを視覚的に表現します。 ロジックと機能 このインディケーターは、数学的なアプローチを用いてボリューム分析を行います: データソース : 取引所銘柄のリアルボリューム(Real Volume) と、FX/CFD向けの OHLCウィック・プロキシ(OHLC Wick Proxy)計算の両方をサポートしています。 グラデーションシステム : 4色の移動平均線がトレンドの段階を識別します: ディープスカイブルー(DeepSkyBlue) : 数値が正で、上昇中。 オレンジ(Orange) : 数値が正で、下落中。 マゼンタ(Magenta) : 数値が負で、下落中。 パープル(Purple) : 数値が負で、上昇中。 5レイヤー
Gold Venamax - これは最高の株式テクニカル指標です。 指標アルゴリズムは資産の価格変動を分析し、ボラティリティと潜在的なエントリーゾーンを反映します。 インジケーターの機能: これは、快適で収益性の高い取引のためのマジックとトレンド矢印の 2 つのブロックを備えたスーパー インジケーターです。 チャート上にブロックを切り替えるための赤いボタンが表示されます。 マジックはインジケーター設定で設定されているため、異なるブロックを表示する 2 つのチャートにインジケーターをインストールできます。 Gold Venamax は、異なる矢印バッファー (GV と SD) を備えた 2 つのチャートに配置できます。 これを行うには、設定で異なる Magic を選択する必要があります。たとえば、あるマジック = 999、別のマジック = 666 を選択します。次に、チャート上の赤いボタンで矢印バッファを選択できます。 インジケーター設定の各矢印バッファー (GV および SD) には、快適で収益性の高い取引のための個別の矢印フィルターがあります (UseFiltrGV = true;
IceFX VelocityMeter Mini is a very unique indicator on MetaTrader 4 platform which measures the speed of the Forex market . It is not a normal volume or other measurement indicator because IceFX VelocityMeter Mini is capable to understand market speed movements which are hidden in ticks and those valuable information cannot be read in an ordinary way from the candles. The software monitors the received ticks (frequency, magnitude of change) within a specified time range, analyzes these info and
This Currency Meter Calculates Strength Using a currency basket of 28 pairs? This Currency Meter uses a basket of 28 currency pair to define strength. This is very important because it gives an wholesome view of the strength of a currency by considering its reaction to all major currencies paired with it. This Currency Meter is Multi-timeframe!!! Majority of the currency strength indicators around the market today only has a single time frame view. Even with the so called multi-timeframe versio
Account Statistics – MetaTrader 5のためのトレーディング統計ダッシュボード Account StatisticsはMetaTrader 5向けの分析およびレポートツールです。取引口座の主要な指標をチャート上に直接表示し、さまざまな期間にわたるパフォーマンスを体系的に評価することができます。 本製品は、結果を体系的に分析し、明確に記録したいトレーダー向けに設計されています。 機能 統合されたダッシュボードは、主要な取引指標をリアルタイムで表示します。これには損益、勝率、プロフィットファクター、その他の統計データが含まれます。表示は日次、週次、月次、年次、および全期間の統計など、さまざまな期間に切り替えることが可能です。 さらに、このツールは自動レポート機能を備えています。レポートは指定した時刻に作成され、プラットフォームの通知機能を通じて送信されます。日次レポートと定期的なサマリーを組み合わせることも可能です。 プログラムは週次、月次、年次の切り替えなどの重要な期間を自動的に認識し、それに応じてレポートを補完します。 リスク管理のために、最大ドローダウン
TimeVolumeProfile — MQL5 Marketplace Description MetaTrader 5 · Custom Indicator Time Volume Profile Market profile analytics — POC, Value Area High and Value Area Low — computed from pure price action. No tick volume required. MetaTrader 5 Version 2.00 No Volume Feed Needed Overview TimeVolumeProfile brings institutional-grade market profile analysis to any instrument and timeframe — without depending on a broker's tick-volume feed. It identifies the price levels where the market has spent the
AI Gold Asia Signal v1.6 Professional Indicator - Asia/London Session Breakout for Gold (XAUUSD) OVERVIEW AI Gold Asia Signal automatically detects the Asian session price range on XAUUSD and generates breakout entry signals for the London and New York trading windows. All key levels are drawn directly on the chart - no manual calculation needed. HOW IT WORKS 1. During the Asian session (03:00-10:00 broker time) the indicator scans M15 candles and records the High and Low of the session. 2
Multi Pivot Indicator - Professional Trading Tool MULTI PIVOT PRO INDICATOR Professional Multi Pivot Indicator for MT4 5-in-1 Pivot Indicator Professional Trading Tool for MetaTrader 4 ENGLISH TÜRKÇE Multi Pivot Indicator PRO Classic Fibonacci Camarilla Woodie DM What is Multi Pivot Indicator? Multi Pivot Indicator is a professional trading tool that displays 5 different pivot calculation methods on your MetaTrader 4 charts. Pivot points are critical support and resistance
Overview In the evolving landscape of trading and investment, the demand for sophisticated and reliable tools is ever-growing. The AI Trend Navigator is an indicator designed to meet this demand, providing valuable insights into market trends and potential future price movements. The   AI Trend Navigator   indicator is designed to predict market trends using the k-Nearest Neighbors (KNN) classifier. By intelligently analyzing recent price actions and emphasizing similar values, it helps t
Moving Average Multicurrency Scanner MT5を紹介します。これは、さまざまな時間枠で複数の通貨ペアを監視することで、あなたのトレーディング体験を向上させるために設計された最先端のインジケーターです。このツールは、トレンドを特定し、情報に基づいたトレーディング決定を行うために移動平均に依存するトレーダーに最適です。 Moving Average Multicurrency Scanner MT5を使用すると、市場の動きを簡単に分析し、タイムリーなシグナルを受け取ることができ、リアルタイムでトレーディングの機会を活用できます。複数の時間枠と通貨ペアをシームレスに調整して、トレーディング戦略をカスタマイズする能力を想像してみてください。 MQL製品のインストールガイド | MT4/MT5で購入したMQL製品の更新 | 一般的なトラブルシューティングガイド | インジケーター設定 / ガイド 主な機能 バッファ統合: インジケーターの値をアクセス可能なバッファとして公開し、Expert Advisorがシグナルベースのトレーディング戦略を利用できるようにしま
Introducing PivotWave – your ultimate trading companion that redefines precision and market analysis. Designed with traders in mind, PivotWave is more than just an indicator; it’s a powerful tool that captures the pulse of the market, identifying key turning points and trends with pinpoint accuracy. PivotWave leverages advanced algorithms to provide clear visual signals for optimal entry and exit points, making it easier for traders to navigate volatile market conditions. Whether you are a begin
Japanese コードの利点の説明(コード自体には触れずに) 1. 市場環境の詳細な分析(3次元) 単に「上昇」「下降」を示すだけでなく、**「レンジ(横ばい)」**の勢いを分離して表示します。 買い圧力が強い時(強気) 売り圧力が強い時(弱気) 重要: 方向感がない時(レンジ相場)を可視化し、無駄なエントリーを減らせます。 2. オシレーターによる強弱測定 (0-100) 価格変動を0~100の範囲で正規化します。 極端なゾーン: 買われすぎ/売られすぎ(例:80以上、20以下)を定義。 エリアの塗りつぶし: ピーク時に色がつくため、視覚的に判断しやすいです。 3. ノイズ除去の柔軟性(スムージングと加重) だましの回避: 移動平均の種類(RMA, EMA, SMA等)を選んで、細かいノイズを除去できます。 出来高(Volume)加重: 出来高を計算に含めるオプションがあり、信頼性を高めます。 4. 明確な視覚シグナル クロスアロー(矢印): 買いと売りの勢いが逆転した時に矢印を表示します。 表示切り替え: 線や塗りつぶしをON/OFFしてチャートを整理できます。 5. パフォーマ
An indicator of patterns #24, #25, #26 and #27 ("Head and Shoulders", "Complex Head and Shoulders") from Encyclopedia of Chart Patterns by Thomas N. Bulkowski. Parameters: Alerts - show alert when an arrow appears   Push - send a push notification when an arrow appears (requires configuration in the terminal) PeriodBars - indicator period K - an additional parameter that influences the accuracy of pattern shape recognition. The smaller the value is, the smoother the row of peaks/valleys should
Automate your ICT Analysis with the Accumulation, Manipulation, and Distribution (AMD) Indicator. This advanced trading tool is designed for Smart Money Concepts (SMC) traders who want to automate the tedious process of marking up charts. It automatically identifies the Asian Range (Accumulation), detects Liquidity Sweeps (Manipulation), and signals high-probability reversals confirmed by Fair Value Gaps (Distribution). Stop staring at the charts waiting for a sweep. Let the indicator alert you
RSI / TDIアラートダッシュボードを使用すると、取引するすべての主要ペアでRSIを一度に(ユーザーが選択可能に)監視できます。 次の2つの方法で使用できます。 1.複数の時間枠を選択すると、通常の取引条件を超えて延長された複数の時間枠がある場合にダッシュが表示されます。複数の時間枠にわたって買われ過ぎまたは売られ過ぎのレベルを達成したため、価格が最近激しく押し上げられたため、引き戻しまたは逆転が間もなく行われることを示す優れた指標です。 2. 1つの時間枠(トレードするのが好き)と複数のRSIレベルを使用して、その時間枠でのRSIの延長の強さを示します。これは、価格が一方向に非常に長く押し込まれ、市場が利益を得ることになっている場合に、平均回帰取引を行うための優れた戦略です。スクリーンショットの例では、H4 RSIが25レベルを超えて2ペアで拡張されていることがわかります。これは、通常の価格アクションよりもはるかに遠いため、長く行く良い機会です。 ダッシュボードは、選択した時間枠でろうそくが閉じたときに、選択したレベルでの延長された状態(買われ過ぎと売られ過ぎ)を警告
Laguerre SuperTrend Clouds   adds an Adaptive Laguerre averaging algorithm and alerts to the widely popular SuperTrend indicator. As the name suggests,   Laguerre SuperTrend Clouds (LSC)   is a trending indicator which works best in trendy (not choppy) markets. The SuperTrend is an extremely popular indicator for intraday and daily trading, and can be used on any timeframe. Incorporating Laguerre's equation to this can facilitate more robust trend detection and smoother filters. The LSC uses the
Haven Fibonacci Volume Profiles — あなたの自動マーケットレンジアナリスト Haven Fibonacci Volume Profiles をご紹介します。これは、市場分析を次のレベルに引き上げる強力なツールです。このインジケーターは、重要なピボットポイントに基づいて構築された主要な価格レンジを自動的に特定し、それぞれに詳細な出来高プロファイルとフィボナッチレベルを重ねて表示します。これにより、トレーダーは流動性がどこに集中しているか、そして真のサポートレベルとレジスタンスレベルがどこにあるかを即座に確認できます。 その他の製品 -> こちら . どのレンジが関連性があるかを推測するのはやめましょう。インジケーターがすべての複雑な作業を代行し、過去と現在の価格レンジの両方を表示することで、市場の状況を完全に理解することができます。 インジケーターの主な機能 自動レンジ検出: インジケーターは重要な高値と安値(ピボット)を自動的に見つけ、それらの間に価格レンジを構築します。 詳細な出来高プロファイル: 各レンジに対して出来高プロファイルが計算・表示され、取
Includes almost all the concepts related to Volume Profile: POC , Value Area , Developing POC , Anchored VWAP , Volume Delta ; since the “Total” in its name. It is fast in its calculations and simple to work with. Features: 1.    Selectable calculation timeframe to find most traded levels. 2.    Capable of calculating Volume Profile based on tick data 3.    Adjustable histogram bars by their count. 4.    Adjustable histogram bars by their height (price range). 5.    Showing Value Area (VA
Daily Bias Indicator with Statistics and Dashboard Unlock the power of market bias analysis with the Multi-Timeframe Bias Indicator, a versatile tool designed for traders seeking a clear edge in the markets. This indicator provides actionable insights by displaying Daily Bias, Weekly Bias, and Custom Period Bias, enabling you to align your trades with the prevailing market direction across multiple timeframes and symbols. Key Features: Daily Bias Analysis: Identify the bullish, bearish, or neutr
プレミアムレベルは、正しい予測の精度が80%を超える独自の指標です。 この指標は、最高のトレーディングスペシャリストによって2か月以上テストされています。 あなたが他のどこにも見つけられない作者の指標! スクリーンショットから、このツールの正確さを自分で確認できます。 1は、1キャンドルの有効期限を持つバイナリーオプションの取引に最適です。 2はすべての通貨ペア、株式、商品、暗号通貨で機能します 手順: 赤い矢印が表示されたらすぐにダウントレードを開き、青い矢印が表示されたら閉じます。青い矢印の後に開くこともできます。 試してテストしてください!推奨設定はデフォルトです! 日足チャートで最高の精度を示します! インディケータは、2600 Pipsの収益性に対して、約10Pipsという非常に小さなマージンを使用します。
Session Clock Advanced
Muhammad Hassan Muhammad Ahmad Atiyah
Know exactly where you are in the trading day — at a glance. Session Clock Advanced displays two live clocks directly on your chart: your local time (auto-detected from your PC) and New York time. No manual offset needed. But it goes further than a simple clock. The indicator detects the active trading session in real time — Asia, London, New York, or any overlap — and changes color automatically so you always know the market context without reading the time. A live countdown shows exactly
Advanced Trading Chaos  The main purpose of the indicator is to help the trader detect the signals described by Bill Williams in his books to make a quick and correct trading decision. 1)Bullish/Bearish Reversal Bar(BDB) 2) Divergent Bar(DB) 3) Second Sage Signal — the third consecutive Awesome Oscillator bar  4) Working fractals (Fractals that worked above/below the red forehead  5) Three bar coloring modes 5.1) Coloring of bars according to the AO indicator (Including the squatting bar) 5.2
このインジケーターを購入すると、ICT Concept MT5 またはその他のインジケーターを無料で入手できます! 詳細はプライベートメッセージでお問い合わせください! インジケーター: Currency Strength Meter Pro 市場の全体像を可視化 (Market Breadth Visualization) 長所: 複雑なチャートを見る代わりに、整理された「ダッシュボード」形式で表示します。トレーダーは一目で最強・最弱の通貨ペアを把握できます。 メリット: 個別のチャートを確認する時間を節約し、取引する通貨ペアの選定を迅速化します。 自動ランク付けと並べ替え (Auto-Ranking & Sorting) 長所: 「水平ランキング」モードを搭載し、通貨ペアを「最強」から「最弱」へと自動的に並べ替えます。 メリット: 日次/週次/月次の勝者 (Winners) と敗者 (Losers) を即座に特定でき、相対強度戦略の核心となります。 スマート通貨ロジック (Smart Currency Logic) 長所: 垂直モードでは、ベース通貨の位置が異なるペア(例:EU
このプロダクトを購入した人は以下も購入しています
Neuro Poseidon is a new indicator by Daria Rezueva. It combines precise trading signals with adaptive TP/SL levels - creating best possible trades as a result! Message me and get  Neuro Poseidon Assistant  as a gift to automize your trading process! What makes it stand out? 1. Proven profitability on all assets and timeframes 2. Only confirmed BUY and SELL signals present on the chart 3. Adaptive TP & SL levels generated by the software for each trade 4. Easy to understand - suitable for al
PrimeScalping is a powerful trading companion designed to generate high-probability entry signals with dynamic TP/SL/DP levels based on volatility. Built-in performance tracking shows win/loss stats, PP1/PP2 hits, and success rates — all updated live. Key Features: Buy/Sell signals with adaptive volatility bands Real-time TP/SL/DP levels based on ATR Built-in MA Filter with optional ATR/StdDev volatility Performance stats panel (Success, Profit/Loss, PP1/PP2) Alerts via popup, sound, push, or e
SuperScalp Pro
Van Minh Nguyen
4.65 (26)
SuperScalp Pro – 高度なマルチフィルタースキャルピングインジケーターシステム SuperScalp Pro は、クラシックな Supertrend と複数のインテリジェント確認フィルターを組み合わせた高度なスキャルピングインジケーターです。M1 から H4 まで複数の時間足で効率的に動作し、XAUUSD、BTCUSD、主要 Forex 通貨ペア向けに最適化されています。 このインジケーターは明確な Buy / Sell シグナルを提供し、ATR に基づいてエントリー価格、Stop Loss、Take Profit を自動計算します。Fibonacci Take Profit 機能により、重要な価格帯で早期決済し、到達時に通知を送信します。 初期設定では Fibonacci Take Profit が有効化されており、より安定した取引体験を重視しています。チャートに適用するだけですぐ利用可能です。上級者向けに、すべてのパラメータは自由にカスタマイズできます。 完全なドキュメントは製品ブログにあります: [User Guide] SuperScalp Pro Auto T
このインジケーターを購入された方には、以下の特典を 無料 で提供しています: 各トレードを自動で管理し、ストップロスとテイクプロフィットを設定し、戦略ルールに基づいてポジションを決済する補助ツール 「Bomber Utility」 様々な銘柄に合わせたインジケーターの設定ファイル(セットファイル) 「最小リスク」、「バランスリスク」、「待機戦略」 の3つのモードで使用できる Bomber Utility 用の設定ファイル このトレーディング戦略をすぐに導入・設定・開始できる ステップバイステップのビデオマニュアル ご注意: 上記の特典を受け取るには、MQL5のプライベートメッセージシステムを通じて販売者にご連絡ください。 オリジナルのカスタムインジケーター 「Divergence Bomber(ダイバージェンス・ボンバー)」 をご紹介します。これは、MACDのダイバージェンス(乖離)戦略に基づいた 「オールインワン」型のトレーディングシステム です。 このテクニカルインジケーターの主な目的は、価格とMACDインジケーターの間に発生するダイバージェンスを検出 し、将来の価格の動きを示す
Entry In The Zone and SMC Multi Timeframe is a real-time 2-in-1 market analysis tool that combines market structure analysis and a No Repaint BUY / SELL signal system into a single indicator, built on Smart Money Concepts (SMC) — a widely adopted framework used by professional traders to understand market structure. This indicator helps you see the market more clearly, make decisions based on structure rather than guesswork, and focus on high-probability zones where price is more likely to react
まず正直に言いましょう。 どんなインジケーターも、それ単体であなたを利益化させることはできません。もしそう言う人がいるなら、それは夢を売っているだけです。完璧な売買シグナル(矢印)を表示するインジケーターは、いくらでも“完璧に見せる”ことができます。正しい過去の区間を拡大して、勝ちトレードだけを切り取ればいいだけです。私たちはそれをしません。 SMC Intraday Formula はツールです。 市場構造を読み取り、最も高い確率の価格ゾーンを特定し、今この瞬間のスマートマネーの痕跡をシンプルな言葉で正確に示します。最終判断はあなたが行います。トレードを実行するのもあなたです。しかし今は「希望」ではなく「精度」でエントリーできます。 私たちはこのインジケーターを、ゴールド(XAUUSD)および主要FX通貨ペアで約3年間、日々のスキャルピングに使用してきました。M1、M5、M15、M30の主要ツールです。これは未来を予測しようとするのではなく、今まさに形成されている高確率セットアップを示し、その理由を説明します。 他のすべてのインジケーターと何が違うのか? ほとんどのトレーディングイ
SmartScalping is a powerful trading companion designed to generate high-probability entry signals with dynamic TP/SL/DP levels based on volatility. Built-in performance tracking shows win/loss stats, PP1/PP2 hits, and success rates — all updated live. Key Features: Buy/Sell signals with adaptive volatility bands Real-time TP/SL/DP levels based on ATR Built-in MA Filter with optional ATR/StdDev volatility Performance stats panel (Success, Profit/Loss, PP1/PP2) Alerts via popup, sound, push, or e
ScalpPoint is a powerful trading companion designed to generate high-probability entry signals with dynamic TP/SL/DP levels based on volatility. Built-in performance tracking shows win/loss stats, PP1/PP2 hits, and success rates — all updated live. Key Features: Buy/Sell signals with adaptive volatility bands Real-time TP/SL/DP levels based on ATR Built-in MA Filter with optional ATR/StdDev volatility Performance stats panel (Success, Profit/Loss, PP1/PP2) Alerts via popup, sound, push, or emai
SignalTech MT5 is an unique fully rule based trading system for EURUSD, USDCHF, USDJPY, AUDUSD, NZDUSD, EURJPY, AUDJPY, NZDJPY, CADJPY.  All the winning trades with chart setups are published on the comments page. 2026-05 4107 Pips (Until 05-29 NY Closed) 2026-04 2243 Pips 2026-03 2165 Pips 2026-02 2937 Pips 2026-01 2624 Pips 2025-12 1174 Pips It can generate signals with Buy/Sell Arrows and Pop-Up/Sound Alerts. Each signal has clear Entry and Stop Loss levels, which should be automatically flag
MasterTrend Indicator for MT5 A powerful trend-following and signal-evaluation tool MasterTrend   is a custom MT5 indicator that combines Moving Averages and ATR-based risk/reward logic to generate clear buy/sell signals. It visualizes dynamic SL/TP levels, evaluates past trade outcomes, and displays win/loss statistics in a clean on-chart panel. Key features include: Buy/Sell signals based on MA crossovers ATR-based SL/TP1/TP2/TP3 levels with visual lines and labels Signal outcome tracking wit
この製品は 2026 年の市場向けに更新され、最新の MT5 ビルドに最適化されています。 価格更新のお知らせ: Smart Trend Trading System は現在 $99 で提供されています。 次の 30 件の購入 後、価格は $199 に上がります。 特別オファー: Smart Trend Trading System を購入後、私にプライベートメッセージを送ることで、 Smart Universal EA を無料 で受け取り、Smart Trend のシグナルを自動売買に変えることができます。 Smart Trend Trading System は、リペイントなし、再描画なし、遅延なしの完全なトレーディングシステムです。よりクリーンなシグナル、より明確なトレンド方向、そしてより整理された取引方法を求めるトレーダー向けに作られています。 Online course , manual and download presets . このシステムは、トレンド検出、反転ゾーン、Smart Cloud、トレーリングストップロジック、サポートとレジスタンス、ローソク足の色分け、ア
Power Candles V3 - 自己最適化型強弱インジケーター Power Candles V3は 、通貨や銘柄の強さを、適用されたすべてのチャート上で実行可能なトレードプランに変換します。単にローソク足を色分けするだけでなく、バックグラウンドでリアルタイムの自動最適化を実行し、目の前の銘柄に対して最適なストップロス、テイクプロフィット、およびシグナルの閾値を提示します。ワンクリックで実取引に適用でき、エントリーポイント、ストップロス、テイクプロフィットのラインが正確な価格位置にチャート上に表示され、方向性を示すアラートがリアルタイムで発動します。 このツールは、Stein Investmentsのエコシステムの一部です。  18種類以上のツールをすべて閲覧し、AIを活用したセットアップの推奨事項を入手し、  https://stein.investments でコミュニティに参加しましょう クローズしたバーごとに3,000回以上のトレードシミュレーション。9つの強さの状態。2つの戦略を並行してテスト。勝率の高い設定をワンクリックで適用。 なぜこれが必要なのか ほとんどの強
MasterTrend Indicator for MT5 A powerful trend-following and signal-evaluation tool MasterTrend   is a custom MT5 indicator that combines Moving Averages and ATR-based risk/reward logic to generate clear buy/sell signals. It visualizes dynamic SL/TP levels, evaluates past trade outcomes, and displays win/loss statistics in a clean on-chart panel. Key features include: Buy/Sell signals based on MA crossovers ATR-based SL/TP1/TP2/TP3 levels with visual lines and labels Signal outcome tracking wit
Quantum TrendPulse を ご紹介します。これは、   SuperTrend   、   RSI   、および Stochastic のパワーを 1 つの包括的なインジケーターに組み合わせて、取引の可能性を最大限に引き出す究極の取引ツールです。精度と効率を求めるトレーダー向けに設計されたこのインジケーターは、市場のトレンド、勢いの変化、最適なエントリー ポイントとエグジット ポイントを自信を持って特定するのに役立ちます。 主な特徴: SuperTrend 統合: 現在の市場動向に簡単に追従し、収益性の波に乗ることができます。 RSI精度: 買われすぎと売られすぎのレベルを検出し、市場の反転のタイミングに最適で、SuperTrendのフィルターとして使用されます。 確率的精度: 確率的振動を活用して、変動の激しい市場で隠れたチャンスを見つけます。SuperTrend のフィルターとして使用されます。 マルチタイムフレーム分析:   M5 から H1 または H4 まで、さまざまなタイムフレームで市場を常に把握します。 カスタマイズ可能なアラート: カスタム取引条件が満たされ
ご紹介     Quantum Breakout PRO は 、ブレイクアウト ゾーンの取引方法を変革する画期的な MQL5 インジケーターです。 13年以上の取引経験を持つ経験豊富なトレーダーのチームによって開発されました。     クォンタム ブレイクアウト プロ   は、革新的でダイナミックなブレイクアウト ゾーン戦略により、あなたのトレーディングの旅を新たな高みに押し上げるように設計されています。 クォンタム ブレイクアウト インジケーターは、5 つの利益ターゲット ゾーンを備えたブレイクアウト ゾーン上のシグナル矢印と、ブレイクアウト ボックスに基づいたストップロスの提案を提供します。 初心者トレーダーにもプロのトレーダーにも適しています。 量子EAチャネル:       ここをクリック 重要!購入後、インストールマニュアルを受け取るためにプライベートメッセージを送ってください。 推奨事項: 時間枠: M15 通貨ペア: GBPJPY、EURJPY、USDJPY、NZDUSD、XAUUSD アカウントの種類: ECN、Raw、またはスプレッドが非常に低い R
Azimuth Pro
Ottaviano De Cicco
5 (7)
Azimuth Pro V2:MT5向けシンセティック・フラクタル構造分析と確認済みエントリー 概要 Azimuth Pro は Merkava Labs によるマルチレベルスイング構造インジケーターです。4つのネストされたスイングレイヤー、スイングアンカーVWAP、ABCパターン検出、3タイムフレーム構造フィルタリング、そして確定バーでの確認済みエントリー — 1つのチャートで、ミクロスイングからマクロサイクルまでを網羅するワークフロー。 これはブラインドシグナル製品ではありません。ロケーション、コンテキスト、タイミングを重視するトレーダーのための構造ファーストワークフローです。 V2発売記念オファー — Azimuth Pro V2をUSD 399で(次の100本)。最終価格:USD 499。 1. V2での変更点 シンセティック・マルチタイムフレームエンジン 上位タイムフレーム分析をMeridian Proと同じ独自のシンセティックアーキテクチャで一から再構築。よりクリーンなHTFコンテキスト、安定したライブ動作、従来のMTF同期問題なし。シンセティックエンジンは 固定比率タ
トレンドキャッチャーインジケーター トレンドキャッチャーインジケーターは、開発者独自の適応型トレンド分析指標を組み合わせることで、市場価格の動きを分析します。短期的なノイズを除去し、根底にあるモメンタムの強さ、ボラティリティの拡大、価格構造の挙動に焦点を当てることで、真の市場方向性を特定します。また、移動平均線、RSI、ボラティリティフィルターなどの平滑化およびトレンドフィルタリング機能を備えたカスタマイズ指標も使用します。 実際の運用状況のモニタリングやその他の製品については、こちらをご覧ください: https://www.mql5.com/en/users/mechanic/seller ご注意ください。私はTelegramでEAや設定を販売していません。詐欺です。すべての設定はブログで無料で公開しています。 重要!ご購入後すぐにご連絡ください。手順とボーナスをお送りします!
GoldenX Entryは、MT5向けのインジケーターであり、適応型Smart Entry Trendアルゴリズム、シグナルスコアリングシステム、マーケットレジーム検出機能、およびボラティリティフィルターを備えています。各シグナルには、計算されたエントリーレベル、3つのテイクプロフィット(TP1、TP2、TP3)、およびストップロスレベルが含まれます。本インジケーターは、異なる市場環境に適応するために設計された複数の分析レイヤー上に構築されており、マルチレイヤー分析システムと内蔵オプティマイザーおよび統計トラッキングシステムを組み合わせています。リスク・リワード(RR)指標および過去のトレード履歴に基づく定量分析を提供します。 使い始めは簡単です — 選択した時間足でオプティマイザーを実行し、そのままチャート上でインジケーターを使用します。 コア機能 GoldenX Entryは、シグナルエンジンとトレード管理機能、そして過去統計トラッキングを1つのチャートに統合しています: - 内蔵オプティマイザー: オプティマイザーはチャート上でワンクリックで実行できます。200通りのパラメー
Reversion King Indicator
Eugen-alexandru Zibileanu
5 (4)
新たな王者が登場 - インジケーター + 注文管理表示(TP1 + TP2 + TP3)+ オプションのTelegramシグナル送信機能付き(無料) (完全なトレード&シグナルシステム) ゴールド向け最高のEA: Gold Slayer このインジケーターには、高度な戦略、カスタマイズ可能な注文管理システム、そしてエンベロープ拡張を組み合わせた平均回帰システムが搭載されています。さらに、RSIなど複数のインテリジェントな確認フィルターによって、高確率の反転エントリーをBUY・SELLシグナルとして検出します。 単にトレードを学ぶだけでなく、複数ポジションを効果的に管理し、過去に利益を出しているオープンポジションで損失トレードをカバーする方法も学べます。 M5向けに構築・最適化されており、流動性が高くシグナルの精度が安定しているBTCUSDとXAUUSDで優れたパフォーマンスを発揮します。 このインジケーターは、ATRを基に自動計算されたエントリー、ストップロス、テイクプロフィットレベルを備えた明確なLong・Shortシグナルを提供するため、リスク管理が最初から組み込まれています。 マ
FX Trend NG:次世代マルチマーケット・トレンドインテリジェンス 概要 FX Trend NG は、複数の時間足に対応したプロフェッショナル向けトレンド分析およびマーケット監視ツールです。 市場全体の構造を数秒で把握することができます。 複数のチャートを切り替える必要はありません。どの銘柄がトレンド中なのか、どこでモメンタムが弱まっているのか、そしてどの時間足で強い整合性があるのかを瞬時に確認できます。 ローンチ特別オファー – FX Trend NG を $30(6ヶ月) または $80 永久ライセンス でご利用いただけます。 すでに Stein Investments のユーザーですか? -> メッセージを送信 して、プライベートグループへアクセスしてください。 セットアップや詳細情報が必要ですか? -> Stein Investments 公式ページ をご覧ください。 1. FX Trend NG が他と異なる理由 3ステート・トレンドロジック ― Buy と Sell だけではない • 多くのインジケーターは Buy または Sell の2状態のみを表示します。
Gann Made Easy   は、ミスター・ギャンの理論を使用した取引の最良の原則に基づいた、プロフェッショナルで使いやすい外国為替取引システムです。 W・D・ガン。このインジケーターは、ストップロスとテイクプロフィットレベルを含む正確な買いと売りのシグナルを提供します。 PUSH通知を利用して外出先でも取引可能です。 ご購入後、取引方法の説明と優れた追加インジケーターを無料で入手するには、私にご連絡ください! おそらく、ギャンの取引手法についてはすでに何度も聞いたことがあるでしょう。通常、ギャンの理論は初心者のトレーダーだけでなく、すでにある程度の取引経験がある人にとっても非常に複雑なものです。なぜなら、ギャンの取引手法は理論的にはそれほど簡単に適用できるものではないからです。私はその知識を磨き、最良の原則を私の外国為替インジケーターに組み込むために数年を費やしました。 このインジケーターは非常に簡単に適用できます。必要なのは、それをチャートに添付し、簡単な取引推奨事項に従うだけです。このインジケーターは常に市場分析の仕事を行い、取引の機会を探します。適切なエントリーポイントを検
この製品は 2026 年の市場向けに更新され、最新の MT5 ビルドに最適化されています。 価格更新のお知らせ: Smart Price Action Concepts は現在 $200 で提供されています。 次の 30 件の購入 後、価格は $299 に上がります。 特別オファー: 購入後、私にプライベートメッセージを送ることで、 無料ボーナス + ギフト を受け取ることができます。 まず、このトレーディングツールはリペイントなし、再描画なし、遅延なしのインジケーターであり、プロフェッショナルな取引に最適であることを強調しておきます。 Online course , and manual Smart Price Action Concepts Indicator は、初心者から経験豊富なトレーダーまで使える非常に強力なツールです。20 種類以上の便利なインジケーターを 1 つにまとめ、Inner Circle Trader Analysis や Smart Money Concepts Trading Strategies などの高度な取引アイデアを組み合わせています。このインジケ
RelicusRoad Pro: 定量的市場オペレーティングシステム 【期間限定】無制限アクセス 70% OFF - 2,000人超のトレーダーと共に なぜ多くのトレーダーは「完璧な」インジケーターを使っても失敗するのでしょうか? それは、文脈を無視して 単一の概念 だけでトレードしているからです。文脈のないシグナルは単なるギャンブルです。勝ち続けるには、 根拠の重なり(コンフルエンス) が必要です。 RelicusRoad Proは単なる矢印インジケーターではありません。完全な 定量的市場エコシステム です。独自のボラティリティモデリングを用いて、価格が推移する「適正価値の道(Fair Value Road)」をマッピングし、ノイズと真の構造的ブレイクを判別します。 推測はやめましょう。機関投資家レベルの「ロード・ロジック」でトレードを。 コアエンジン:「Road」アルゴリズム システムの中心となる Road Algo は、市場環境にリアルタイムで適応するダイナミックなボラティリティチャネルです。 安全ライン(平衡点) と、価格が数学的に反転しやすい 拡張レベル を投影します。 Si
ARIPoint
Temirlan Kdyrkhan
1 (1)
ARIPoint is a powerful trading companion designed to generate high-probability entry signals with dynamic TP/SL/DP levels based on volatility. Built-in performance tracking shows win/loss stats, PP1/PP2 hits, and success rates all updated live. Key Features: Buy/Sell signals with adaptive volatility bands Real-time TP/SL/DP levels based on ATR Built-in MA Filter with optional ATR/StdDev volatility Performance stats panel (Success, Profit/Loss, PP1/PP2) Alerts via popup, sound, push, or email Cu
メタトレンドプロ   これは、トレードにおける推測を排除し、市場が既に決定を下したポイントを示すトレンドフォローツールです。この指標は、トレンド、動向、構造が変化する重要なポイントを特定し、主要プレーヤーがポジションを取るべき価格の戻り領域を強調表示します。 単に値動きを見るだけでなく、その背後にある論理を理解できます。すべてのシグナルはローソク足が確定した後に記録され、再描画されることなくチャートに保存されるため、自信を持って状況を分析し、意思決定を行うことができます。トレード目標(利益確定)も表示されます。 この指標の有効性について完全に確信を持っていただくために、自動統計機能をご利用いただけます。 方向転換のたびに、インジケーターはストップロスレベルとそのインテリジェントな段階的移動(Move SL)も表示します。これは非常に重要です。     削減   リスク   ポジション別。 損切り/利益確定/リスクリワード 右側の内蔵パネルには、現在の世界的なトレンドの方向における市場参入ポイントが表示され、過去のデータからもこれらのシグナルが確認できます。 任意の時間枠/ツール この指
M30/H1/H4スイング版もあります M5/M15では取りきれない大きな波を狙いたい方へ。 Gold Signal Swing Pro(M30/H1/H4対応)を販売中。 1トレードで$20〜$80+の値幅を狙う。 https://www.mql5.com/en/market/product/177643 KURAMA GOLD SIGNAL PRO(MT5版)— 7層フィルター搭載 XAUUSD完全トレードシステム リペイントなし。リドローなし。ラグなし。すべてのサインは確定後に変わりません。 購入者限定特典:買い切りライセンスをご購入いただいた方に、AI Zone Radar($59相当)+PDFマニュアルを無料プレゼント。購入後にMQL5でメッセージをお送りください。 AI Zone Radar: https://www.mql5.com/en/market/product/175834 ゴールドトレーダーのコミュニティで実際に使用され、精度と使いやすさで高評価。 あなたの問題
この製品は 2026 年の市場向けに更新され、最新の MT5 ビルドに最適化されています。 価格更新のお知らせ: Atomic Analyst は現在 $99 で提供されています。 次の 30 件の購入 後、価格は $199 に上がります。 特別オファー: Atomic Analyst を購入後、私にプライベートメッセージを送ることで、 Smart Universal EA を無料 で受け取り、Atomic Analyst のシグナルを自動売買に変えることができます。 Atomic Analyst は、リペイントなし、再描画なし、遅延なしの Price Action トレーディングインジケーターで、手動取引、シグナルの明確化、EA 自動化のために設計されています。 User manual: settings, inputs and strategy. 価格行動、強さ、モメンタム、マルチタイムフレーム方向、高度なフィルターを分析し、トレーダーがノイズを減らし、弱いセットアップを避け、より構造化された取引判断を行えるようにします。 このインジケーターは、複雑な市場計算をシンプルな視覚シ
FX Power: 通貨の強弱を分析して、より賢い取引を実現 概要 FX Power は主要通貨と金の実際の強弱をあらゆる市場状況で理解するための必須ツールです。強い通貨を買い、弱い通貨を売ることで、 FX Power は取引の意思決定を簡素化し、高い確率の取引機会を見出します。トレンドを追従する場合でも、極端なデルタ値を使用して反転を予測する場合でも、このツールはあなたの取引スタイルに完全に適応します。ただ取引するだけではなく、 FX Power で賢く取引をしましょう。 1. なぜ FX Power がトレーダーにとって非常に有益なのか 通貨と金のリアルタイム強弱分析 • FX Power は主要通貨と金の相対的な強弱を計算し、マーケットダイナミクスに関する明確な洞察を提供します。 • どの資産がリードしているか、または後れを取っているかを監視して、取引するペアを賢く選びましょう。 マルチタイムフレームの包括的なビュー • 短期、中期、長期のタイムフレームで通貨と金の強弱を追跡し、マーケットトレンドに基づいて取引戦略を調整できます。 • スキャルピングからスイングトレード
Market Structure Order Block Dashboard MT5 は、市場構造と主要な価格反応ゾーンをチャート上で直接読み取りたいトレーダー向けに設計された MT5 インジケーターです。BOS、ChoCH、オーダーブロック、Fair Value Gap (FVG)、流動性、Kill Zones、Volume Profile、そして素早い分析のためのコンパクトなダッシュボードを組み合わせています。 本インジケーターは、市場構造、ICT、Smart Money の概念を意思決定の枠組みとして使用するトレーダーを対象としています。トレンド継続、反転の可能性、価格の不均衡、流動性ターゲット、注目ゾーンをより構造的に特定する助けとなります。 購入者向けの付属リソース 購入後、MQL5 のプライベートメッセージにてご依頼いただくと、完全な PDF ユーザーガイドとパラメータ設定のヒントを提供いたします。MQL5 のプライベートメッセージによる直接的な技術サポート。 バージョン 1.20 では 2 つの重要な追加機能があります: Pending BOS / Pending Cho
Smart Structure Concepts MT5
Cristhian Alexander Gaibor Cuasquer
5 (1)
これは、ゾーンを描いてあなたに推測させる、もう一つの構造インジケーターではありません。 Smart Structure Concepts はあなたのために市場を読み取ります — XAUUSD(ゴールド)、外国為替、株価指数、暗号通貨、その他あらゆる市場 で Smart Money Concepts (SMC / ICT) 構造をリアルタイムでマーキングします。各ゾーンを設定するためにインプットに入る必要はもうありません: チャート上のインタラクティブなダッシュボードパネル で、ワンクリックで何を表示、非表示、調整するかを決定できます — プロパティを開く必要も、インジケーターを再起動する必要もありません。 このツールは MetaTrader 5 用の成長中のインジケーターとパネルのセットの一部です — すべて 11 言語の教育的なツールチップと、すべてのチャートに組み込まれたビジュアルメンターを備えています。 各ツールはあなたがトレードする間に教えます:任意のゾーン、シグナル、レベルにマウスを置くと、説明がチャートに直接表示されます。ブラックボックスなし、盲目的な注文なし。あなたはトレ
作者のその他のプロダクト
Expert Advisor Overview: This Expert Advisor (EA) is specifically crafted for traders who want to efficiently manage their open trades on a specific symbol by ensuring that all positions are closed once a predefined profit target is achieved. Whether you are trading forex, stocks, or commodities, this tool offers a streamlined and automated way to lock in profits, minimizing risk and maximizing control. Key Features: Profit Target Control: The EA monitors the total net profit of all open positio
フィルタ:
レビューなし
レビューに返信