Precision trading tool
- インディケータ
- Bala Israel Aji
- バージョン: 1.0
- アクティベーション: 7
Stop overtrading. Start taking high-quality setups.
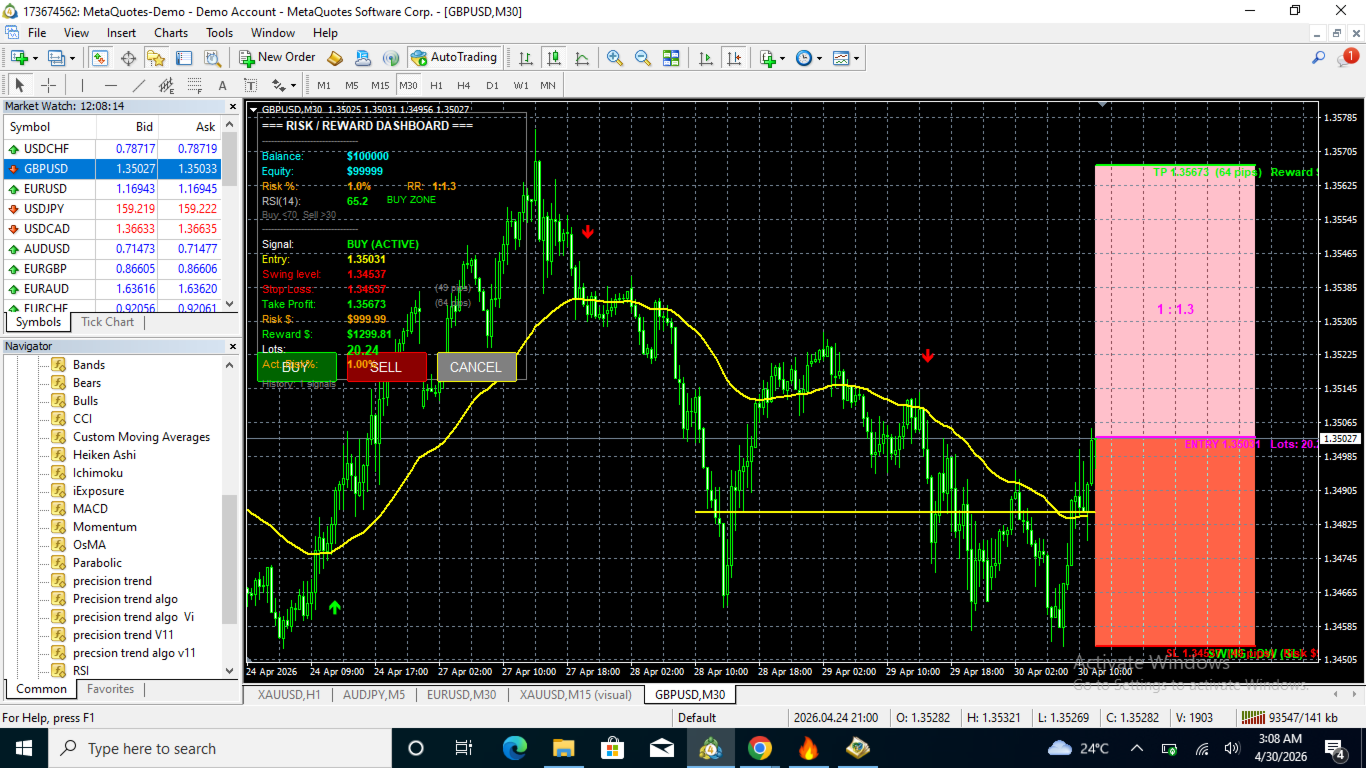
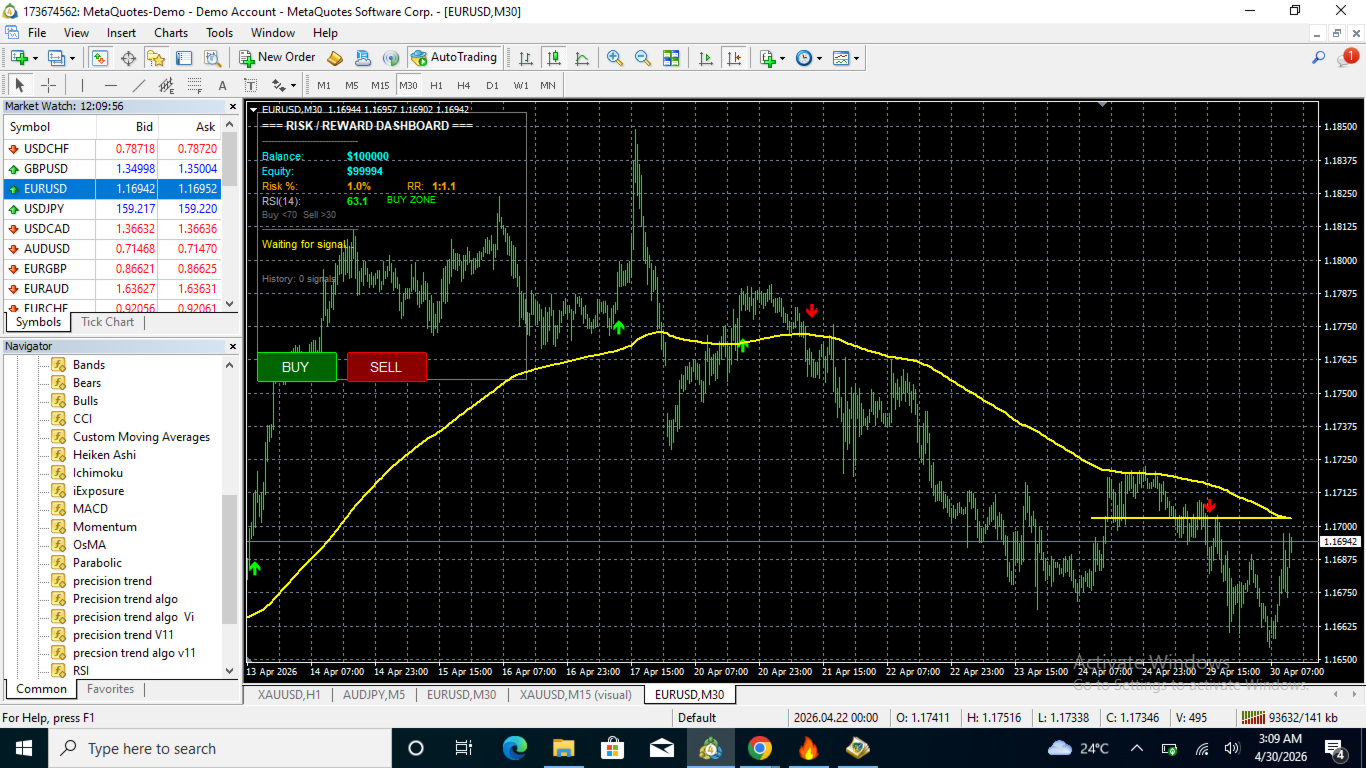
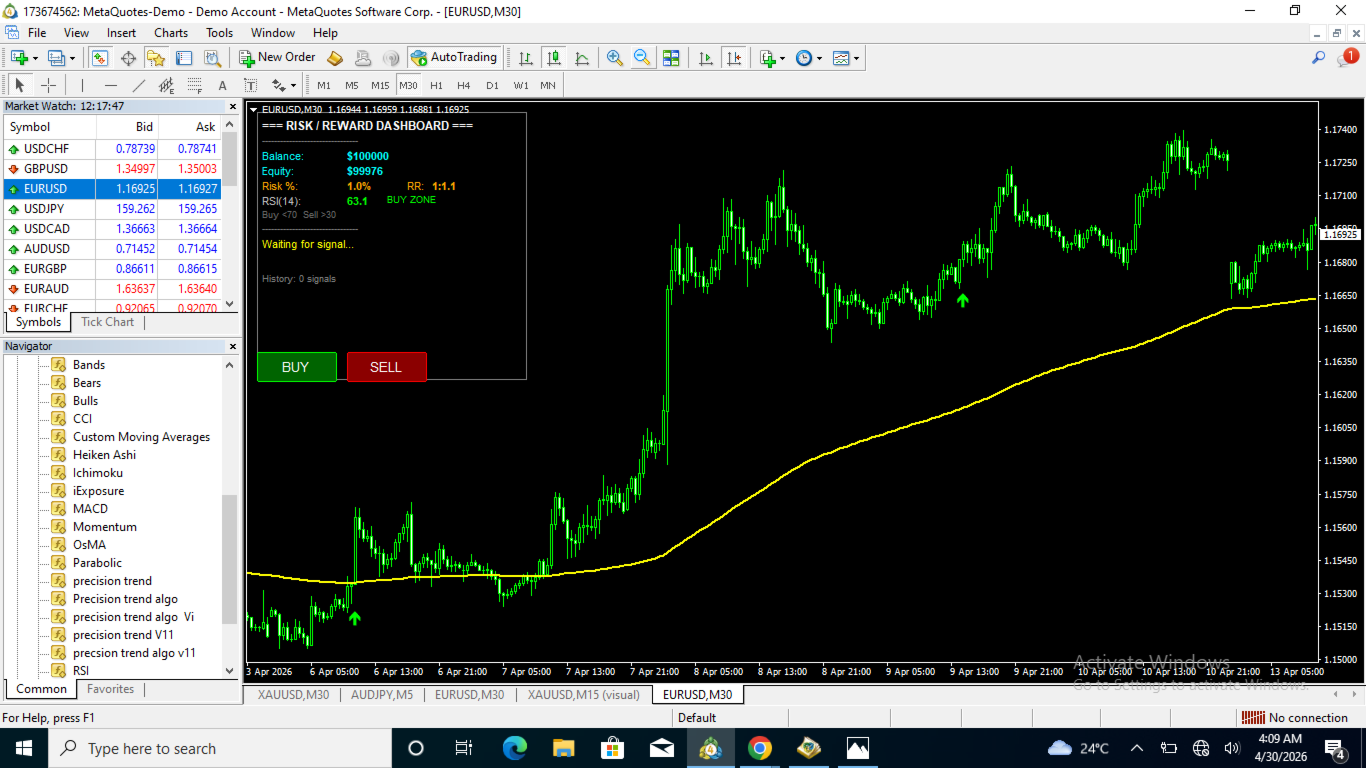
The Precision Trend Trading Tool is built for traders who want clean, confident entries and structured trade management—without noise or guesswork.
Designed as a high-timeframe trend sniper, it helps you focus only on the best opportunities in the market.
🔥 What Makes It Powerful:
- ✅ Built-in RR (Risk-to-Reward) Box for disciplined execution
- ✅ EMA Trend Filter to stay aligned with market direction
- ✅ RSI Confirmation for momentum precision
- ✅ Clear Entry & Exit Signals (no clutter, no confusion)
- ✅ Clean visual layout for fast decision-making
- ✅ Optimized for higher timeframes (H1, H4, D1)
💡 Built For Traders Who:
- Prefer quality over quantity
- Want to avoid emotional and impulsive trades
- Trade Forex pairs like EURUSD and metals like XAUUSD
- Focus on structured, trend-based strategies
⚠️ Important Notes:
- Avoid trading during high-impact news events
- Best suited for higher timeframes
- Lower timeframe (scalping) use is more aggressive and carries higher risk
- Not a holy grail. risk management and discipline are essential