EMA Toggle
- インディケータ
- バージョン: 1.0
- アクティベーション: 5
EMA Toggle is a lightweight MetaTrader 5 indicator that displays up to 5 customizable Exponential Moving Averages (EMAs) with instant keyboard-toggle visibility. Each EMA can be independently configured with its own period, color, line width, and style, and toggled on/off using dedicated keyboard shortcuts for rapid chart customization during analysis.
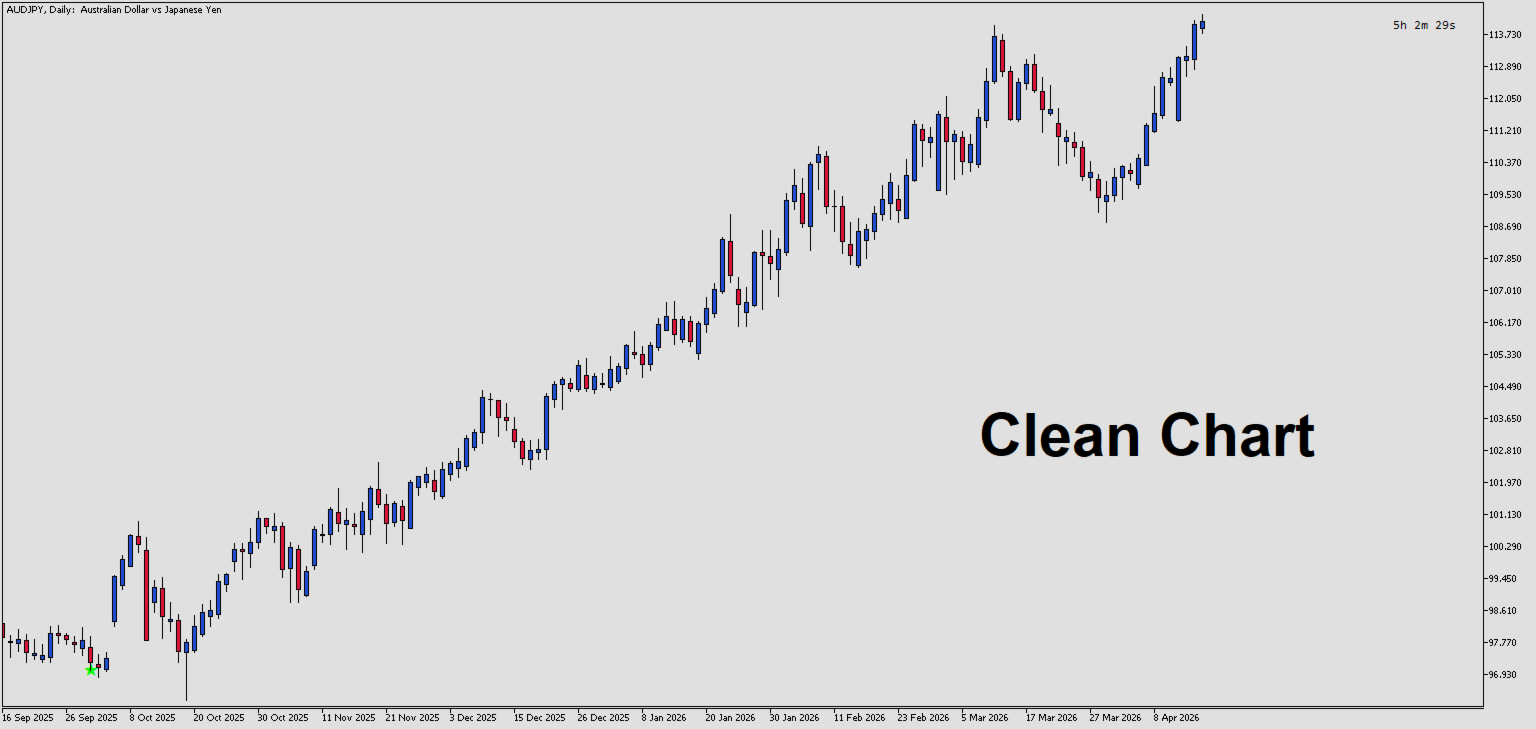
if you value a clean chart but still benefit from using EMAs, then this indicator is for you. Toggle on each EMA easily via the keyboard shortcut and after use toggle off with the same keyboard key.
Key Features:
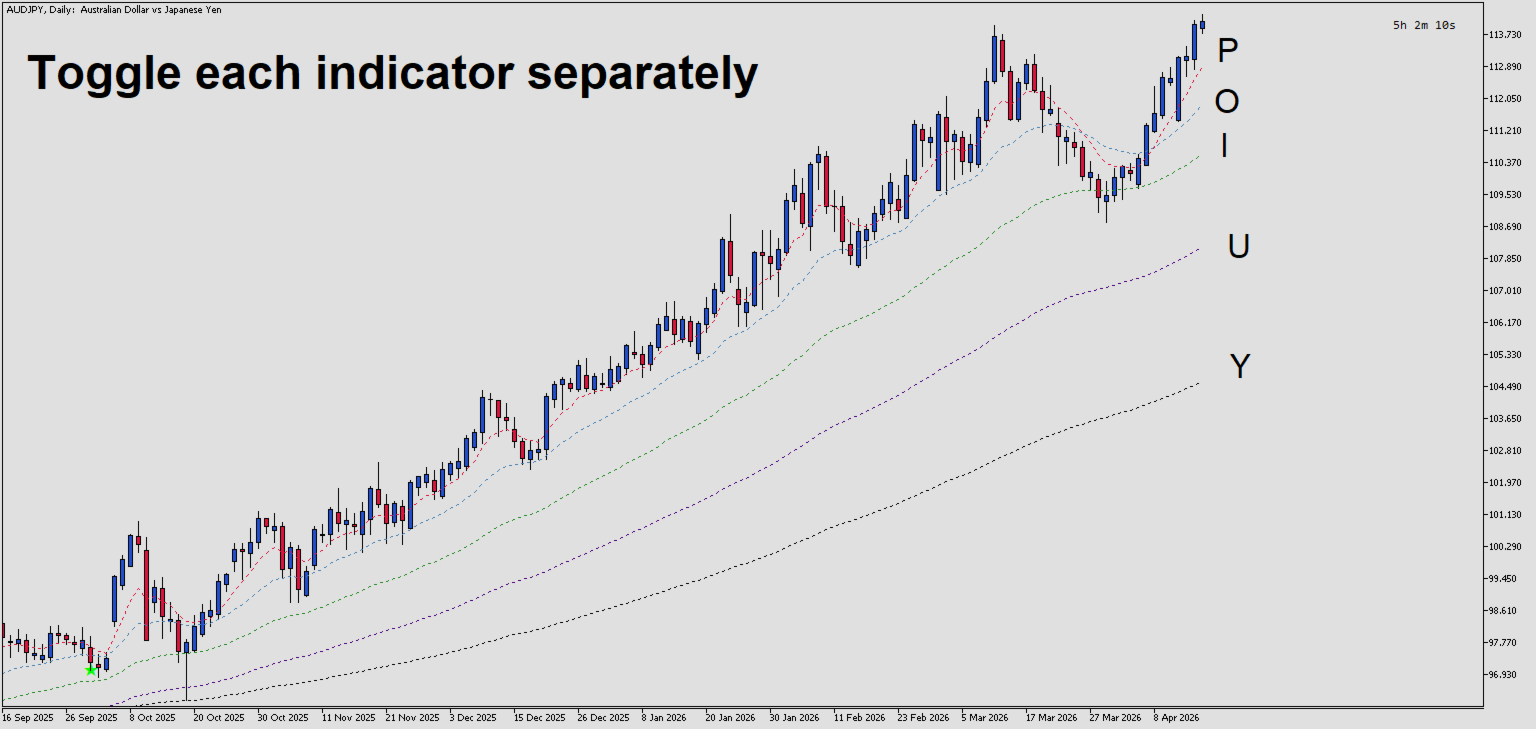
- Up to 5 independent EMAs displayed simultaneously
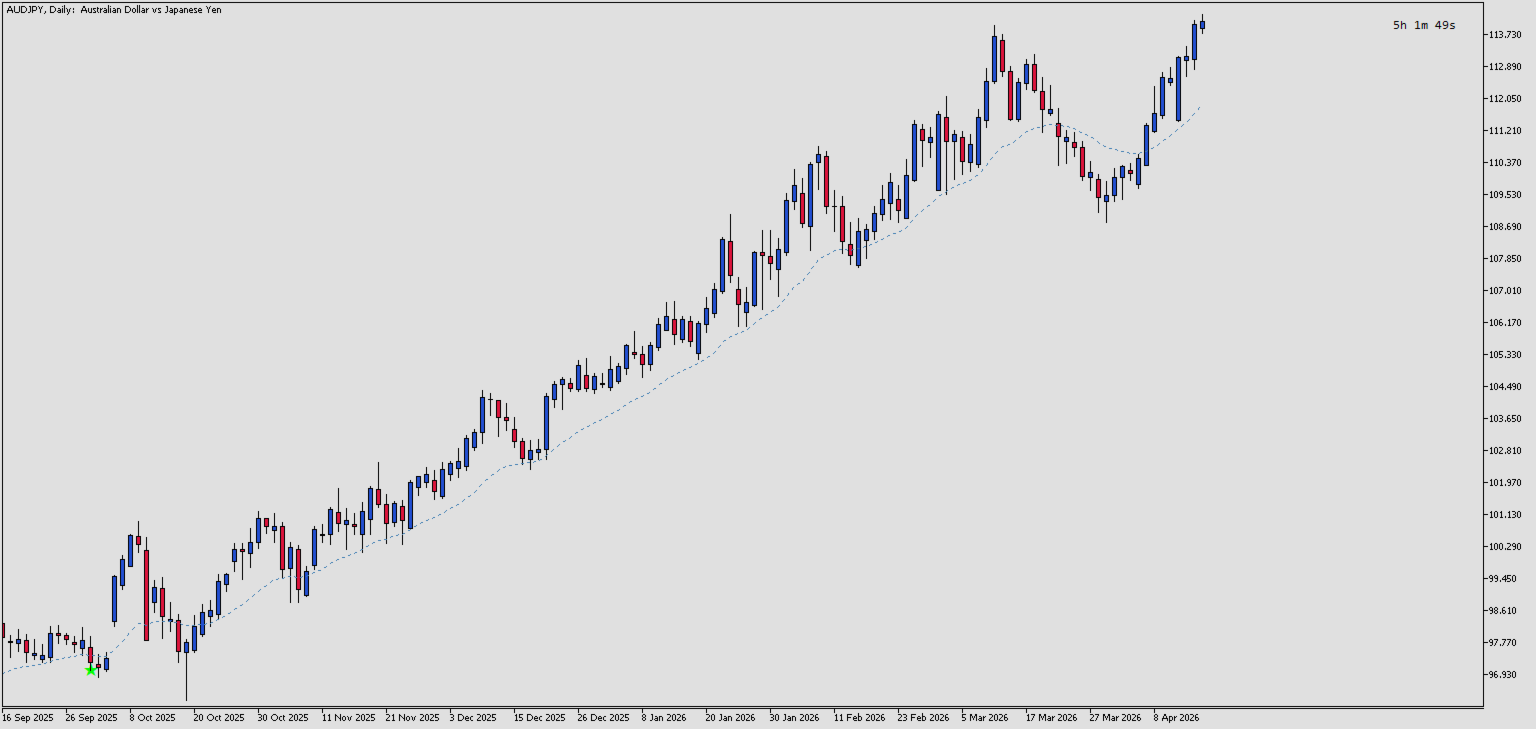
- Keyboard shortcut toggles for each EMA (configurable keys: 'P', 'O', etc.)
- Full customization: key, period, color, width, and line style for each EMA
- All EMAs disabled by default for a clean chart - enable only what you need
- Lightweight implementation with efficient buffer management
- Real-time toggle refresh without indicator reload
Input Parameters
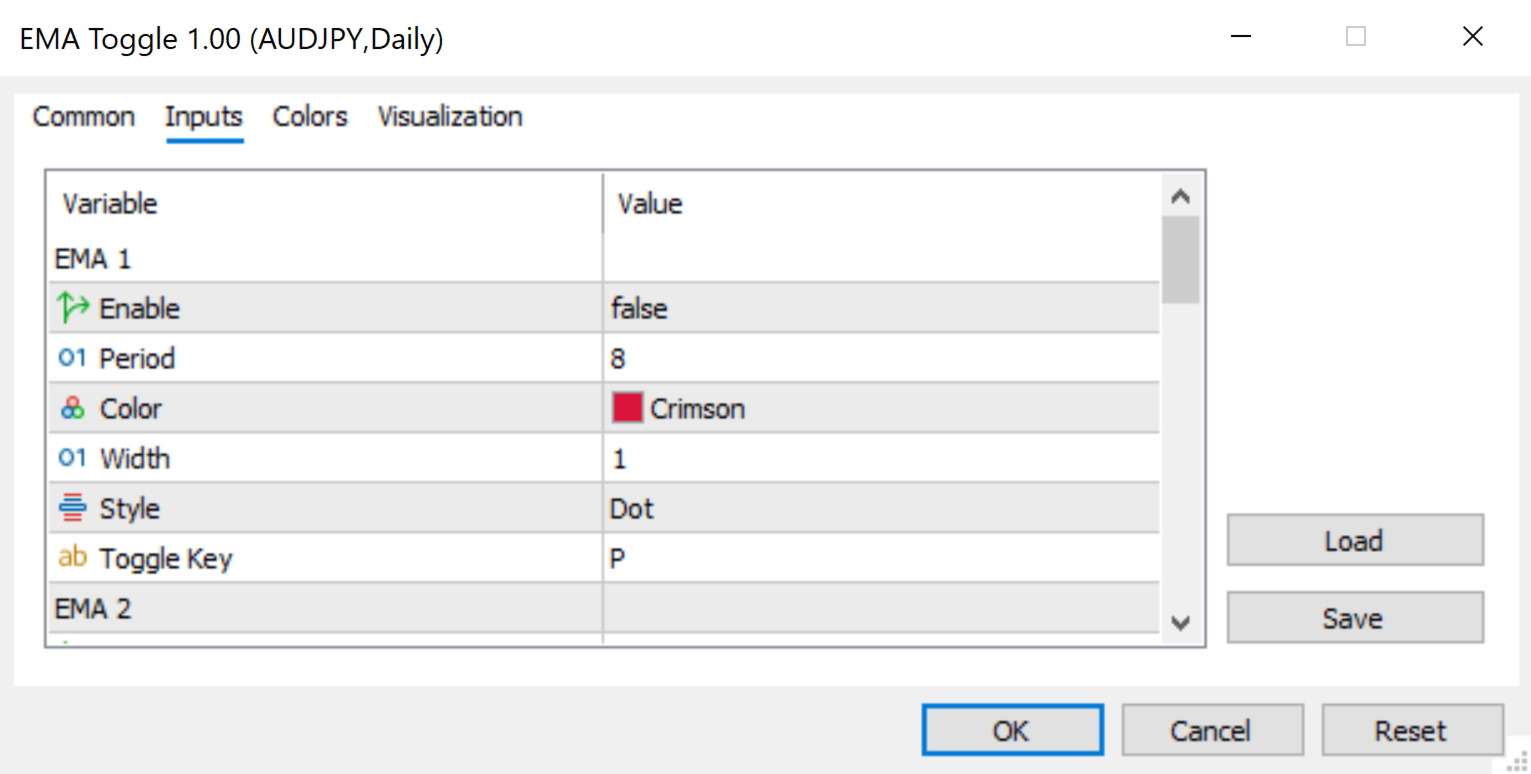
EMA 1 Group
- EMA1_Enable - Enable or disable EMA 1 display on the chart (default: false)
- EMA1_Period - Number of periods for EMA 1 calculation (default: 8)
- EMA1_Color - Color of the EMA 1 line (default: Crimson)
- EMA1_Width - Line width in pixels for EMA 1 (default: 1)
- EMA1_Style - Line style for EMA 1: Solid, Dash, Dot, etc. (default: STYLE_DOT)
- EMA1_Key - Keyboard key to toggle EMA 1 visibility (default: "P")
EMA 2 Group
- EMA2_Enable - Enable or disable EMA 2 display on the chart (default: false)
- EMA2_Period - Number of periods for EMA 2 calculation (default: 21)
- EMA2_Color - Color of the EMA 2 line (default: SteelBlue)
- EMA2_Width - Line width in pixels for EMA 2 (default: 1)
- EMA2_Style - Line style for EMA 2 (default: STYLE_DOT)
- EMA2_Key - Keyboard key to toggle EMA 2 visibility (default: "O")
EMA 3 Group
- EMA3_Enable - Enable or disable EMA 3 display on the chart (default: false)
- EMA3_Period - Number of periods for EMA 3 calculation (default: 50)
- EMA3_Color - Color of the EMA 3 line (default: ForestGreen)
- EMA3_Width - Line width in pixels for EMA 3 (default: 1)
- EMA3_Style - Line style for EMA 3 (default: STYLE_DOT)
- EMA3_Key - Keyboard key to toggle EMA 3 visibility (default: "I")
EMA 4 Group
- EMA4_Enable - Enable or disable EMA 4 display on the chart (default: false)
- EMA4_Period - Number of periods for EMA 4 calculation (default: 100)
- EMA4_Color - Color of the EMA 4 line (default: Indigo)
- EMA4_Width - Line width in pixels for EMA 4 (default: 1)
- EMA4_Style - Line style for EMA 4 (default: STYLE_DOT)
- EMA4_Key - Keyboard key to toggle EMA 4 visibility (default: "U")
EMA 5 Group
- EMA5_Enable - Enable or disable EMA 5 display on the chart (default: false)
- EMA5_Period - Number of periods for EMA 5 calculation (default: 200)
- EMA5_Color - Color of the EMA 5 line (default: Black)
- EMA5_Width - Line width in pixels for EMA 5 (default: 1)
- EMA5_Style - Line style for EMA 5 (default: STYLE_DOT)
- EMA5_Key - Keyboard key to toggle EMA 5 visibility (default: "Y")