Visual Trade Info
- ユーティリティ
-
Lie Tony Candra
 As a full-time trader, my world is driven by the pulse of the markets and the logic of clean code. I don’t just execute trades; I build the systems that power them. My obsession lies in translating complex market theories into automated trading robots and high-performance tools that turn volatility
 - バージョン: 2.2
- アップデート済み: 28 4月 2026
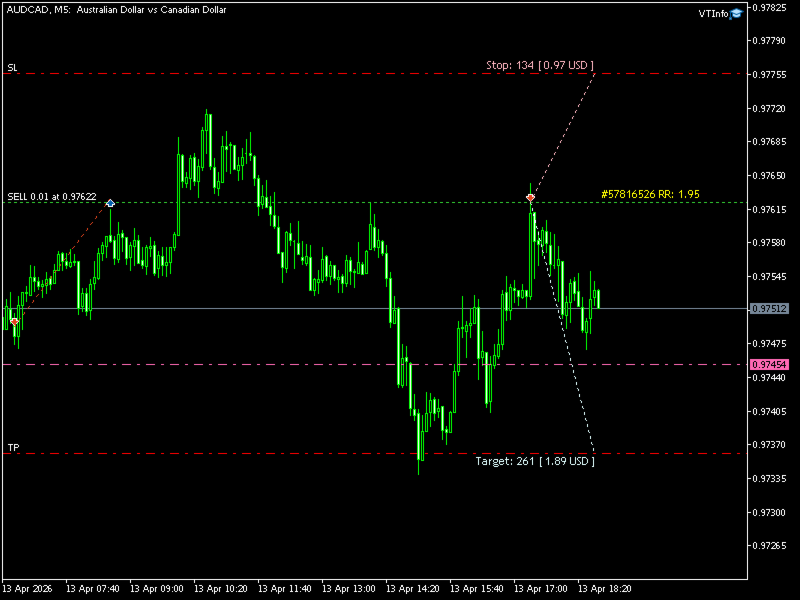
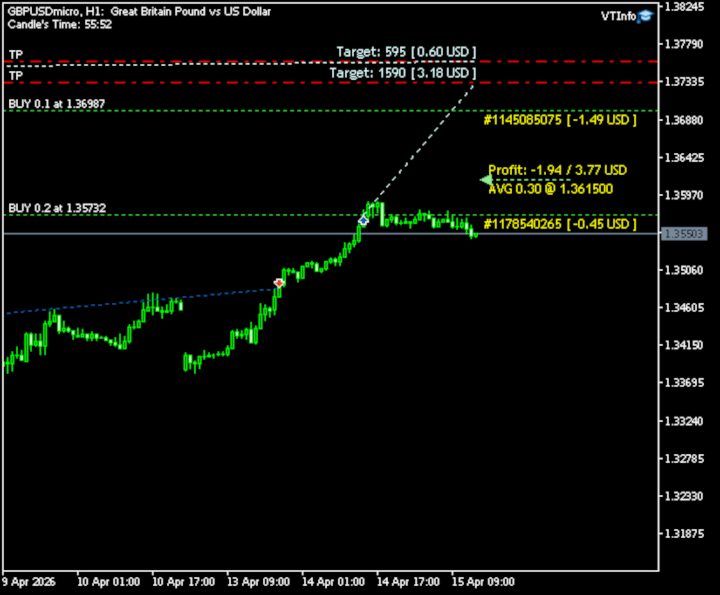
Visual Trade Info is designed to give traders a clear, visual understanding of their trading activity in real time. Instead of relying on scattered data or manually calculating key metrics, the tool presents all essential information directly on the chart in a clean and intuitive format.
It enables traders to monitor every transaction with precision, including entry and exit points, active positions, and overall trade performance. Profit and loss are displayed dynamically, allowing users to instantly evaluate how each position is performing without switching between multiple panels or tools.
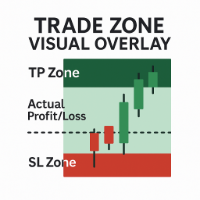
One of its key strengths is the ability to visualize the full structure of a trade. Traders can easily identify where a position starts and where it is set to stop, along with clearly marked take-profit and stop-loss levels. This visual approach reduces confusion and helps maintain discipline during fast-moving market conditions.
Additionally, Visual Trade Info automatically calculates and displays the risk-to-reward ratio for each trade. This feature helps traders make more informed decisions by ensuring that every position aligns with their risk management strategy.