Visual Assistant Indicator Board
- インディケータ
- バージョン: 1.1
- アップデート済み: 4 4月 2026
- アクティベーション: 5

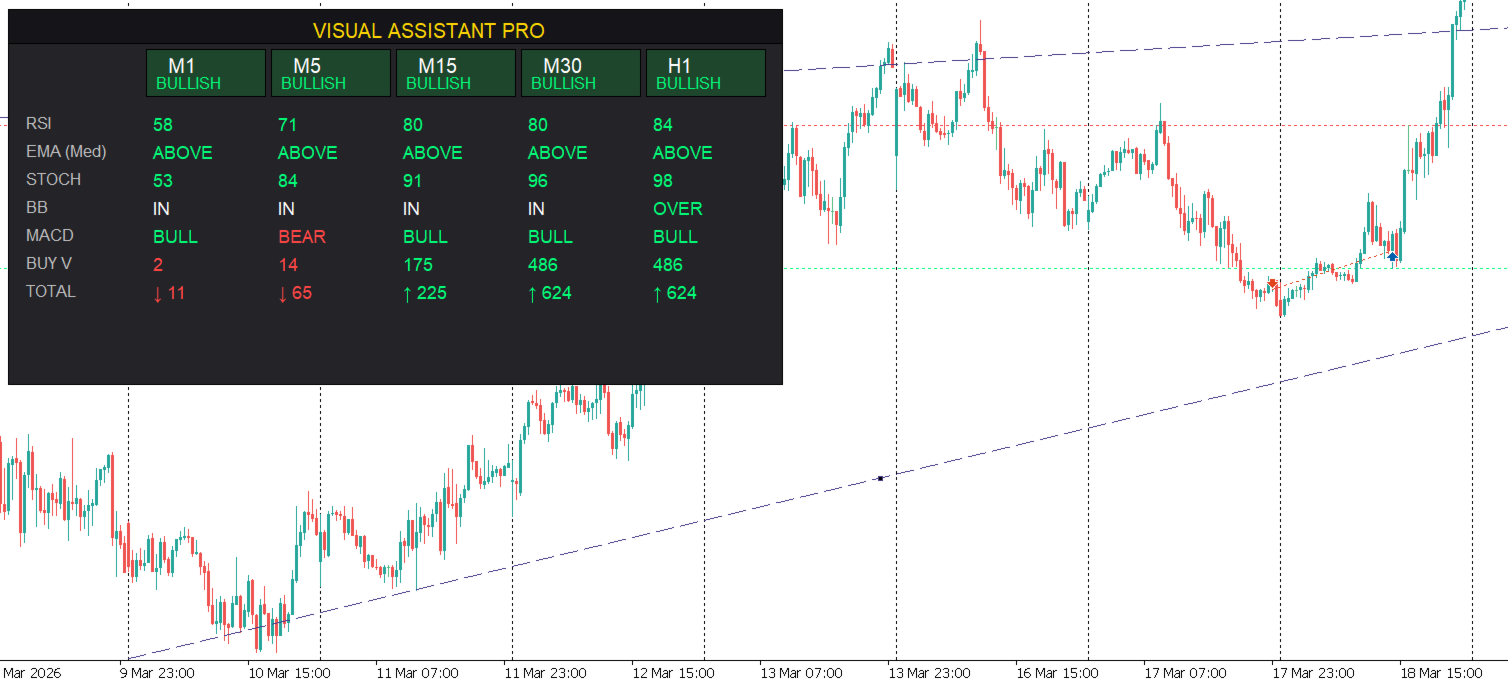
📈Instead of a trader clicking between M1, M5, M15, M30, and H1 to check if their indicators match, Visual Assistant does the work in 1 second.
The "Magic" of the Dashboard: When all 5 columns turn Green (BULLISH), the trader has 100% confluence. This reduces "fear of missing out" (FOMO) and "revenge trading" because they only move when the dashboard confirms the setup.
1. Interface Settings
These control the "UX" (User Experience) for traders care about how their workspace looks.
-
InpX / InpY is precision placement and allows users to move the dashboard so it doesn't cover their favorite price action areas.
-
InpWidth is the daptability , if a trader uses a 4K monitor or a small laptop, they can scale the columns to fit.
-
InpBotPad is the aesthetic control , and adjusts the "margin" at the bottom to ensure the UI feels balanced and professional.
2. Core Indicators ( "Trend" Engine)
-
InpEMA_Len (50) is the industry standard for "Institutional Trend"
-
InpRSI_Len (14) is the momentum tracking and tells the trader if the move is overextended (Overbought/Oversold) or has room to run.
3. Stochastic Setup
-
K, D, & Slowing (5,3,3) is a "Fast Stoch" setup.
4. MACD Setup
-
Fast/Slow/Signal (12, 26, 9) is the standard settings for detecting trend shifts
5. Bollinger Bands
-
Dev (2.0) ttracks the "Standard Deviation."
-
OVER: Price is at the ceiling (potential reversal).
-
UNDR: Price is at the floor (potential bounce).
-
IN: Normal volatility.
-
6. S/R Calculation
-
Pivot Left/Rightdefines a "Swing High/Low."
-
InpLookback (150): This is the memory of the EA. It looks back 150 bars to find the most significant Support and Resistance levels.
⚠️ Risk Disclaimer
Trading foreign exchange (Forex) and other financial instruments on margin carries a high level of risk and may not be suitable for all investors. The high degree of leverage can work against you as well as for you.
No Financial Advice: The "Visual Assistant " is a technical analysis tool designed to assist in market visualization. All information, signals, or data provided by this software are for educational and informational purposes only and do not constitute financial, investment, or trading advice.
Past Performance: Past performance is not indicative of future results. No representation is being made that any account will or is likely to achieve profits or losses similar to those shown in any screenshots or backtests.
User Responsibility: You are solely responsible for your own trading decisions. The developer ("Ea") shall not be held liable for any loss or damage, including without limitation, any loss of profit, which may arise directly or indirectly from the use of this software. Always test on a demo account before trading with real capital.