Vertical Time Lines Custom
- インディケータ
-
Timos Van Dam
 Forged out of the pain from the past, resurected myself into a new life.
Making Trading a pursuit of pleasure!
1% better every single day.
Cheers - バージョン: 1.20
- アップデート済み: 11 3月 2026
Overview
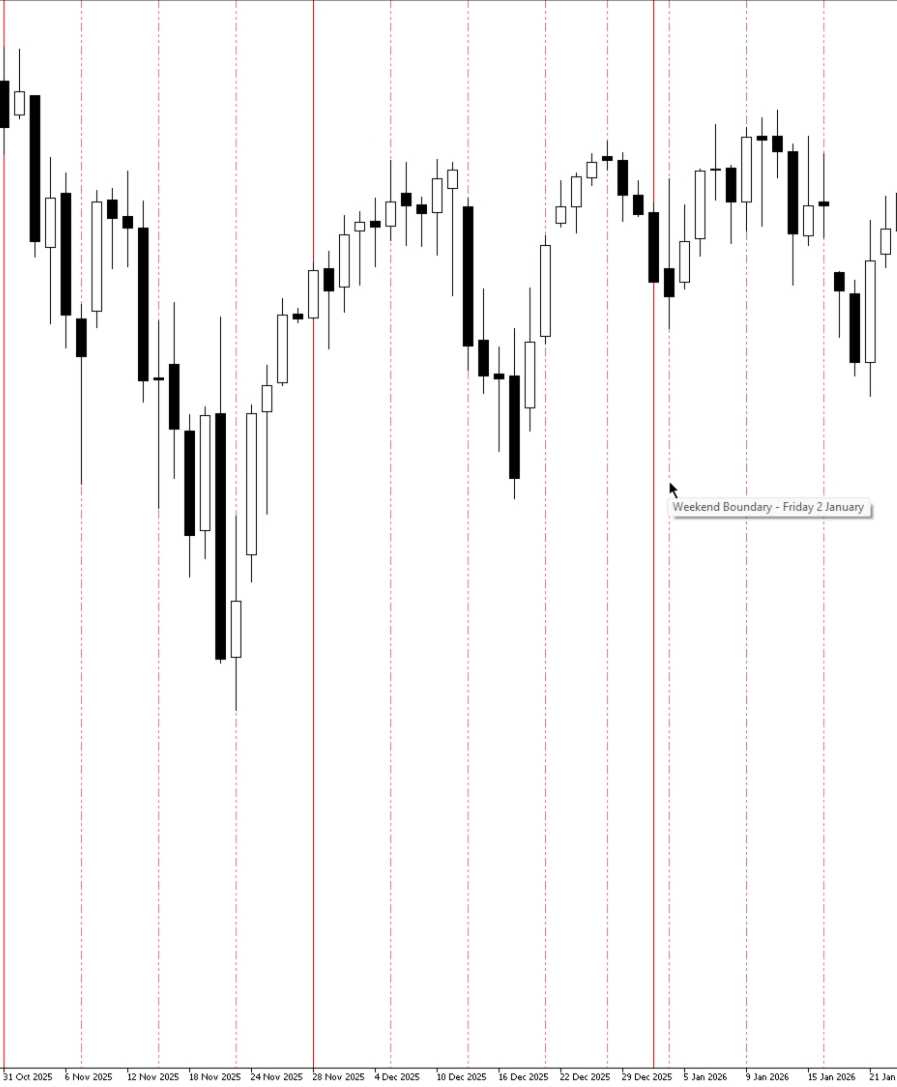
Vertical Time-Lines Auto is a professional MT5 indicator that automatically draws vertical lines at key market boundaries. No more manual line drawing or guessing when new trading periods begin – just look at your chart and see.
What it does
-
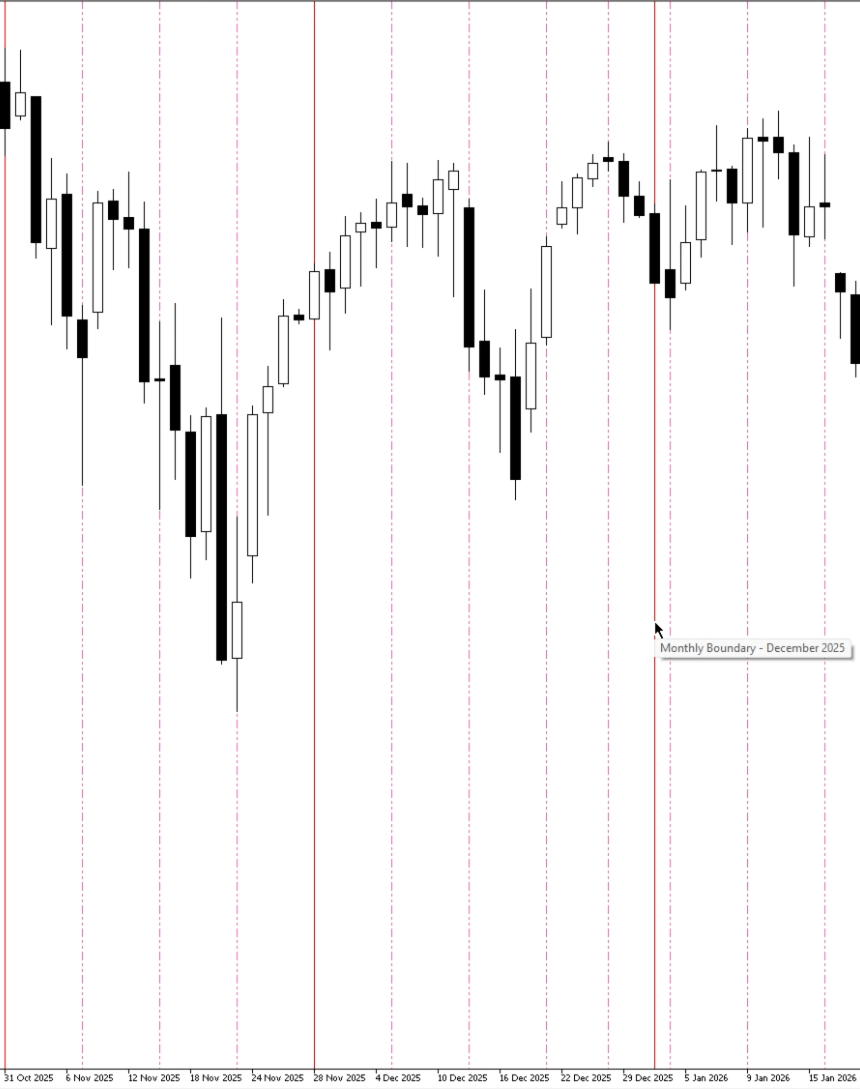
Draws three types of vertical lines on your chart
-
Lines are placed behind candles by default for clean visibility
-
Tooltips show exact date and boundary information when hovering
-
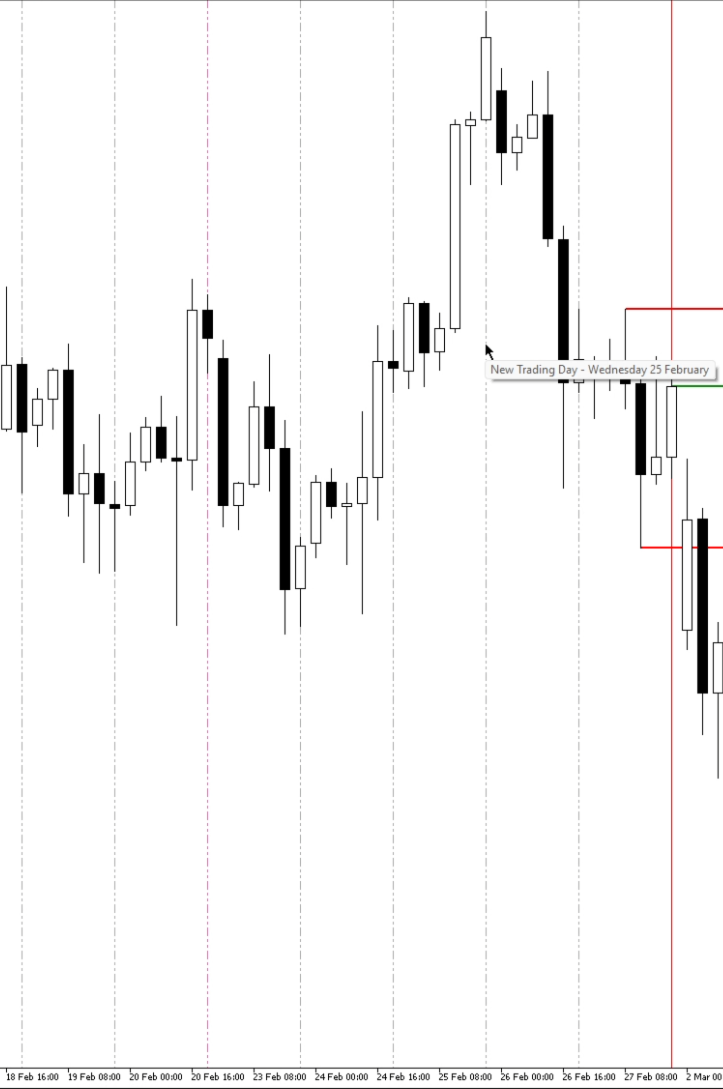
Works on all timeframes (M1 to Monthly)
Line Types & Colors
| Line Type | Color | Meaning |
|---|---|---|
| Month lines | 🔴 Red | Last trading day of each month |
| Friday lines | Pink | Weekend boundary (every Friday) |
| Weekday lines | ⚫ Dark Gray | New trading day (Monday–Thursday, lower timeframes only) |
Key Features
🎨 Fully Customizable
-
Choose separate colors for each line type
-
Set different line styles (solid, dash, dot) per line type
-
Adjust line thickness individually
-
Enable/disable lines per timeframe
⚡ Ultra-Lightweight
-
Uses less than 0.1MB for 10 charts simultaneously
-
Only redraws when necessary (new day, new week)
-
No lag, no flicker, no performance issues
🖱️ Smart Tooltips
Hover over any vertical line to see:
-
Month lines: "Monthly Boundary – February 2026"
-
Friday lines: "Weekend Boundary – Friday 27 February 2026"
-
Weekday lines: "New Trading Day – Monday 23 February 2026"
🌍 Universal Compatibility
-
Works on Forex (EURUSD, GBPUSD, JPY pairs, etc.)
-
Works on Indices (US30, US100, SP500, etc.)
-
Works on Commodities (Gold, Silver, Oil)
-
Works on all timeframes (M1 to Monthly)
🔄 Smart Display Options
-
Background mode – lines behind candles (candle wicks fully visible)
-
Foreground mode – lines on top of candles
-
Timeframe-specific visibility – show/hide weekday lines on Daily charts
-
Max lines limit – control how many historical lines are shown
Installation
-
Copy the .ex5 file to: MetaTrader 5 → MQL5 → Indicators
-
Restart MT5 or refresh Navigator
-
Drag & drop onto any chart
-
Adjust settings in the Inputs tab if desired
Requirements
-
MetaTrader 5 build 2000 or higher
-
Any Windows PC (10/11)
-
Works on all symbols (Forex, Indices, Commodities)
Performance
-
Memory: <0.1MB for 10 charts
-
CPU: <0.01% when idle
-
Objects: MaxLinesPerChart (default 500 = <0.05MB)
Compatibility
Works perfectly alongside:
-
Friday & OR Auto Levels
-
Session Highlighter
-
Any other MT5 indicator (no conflicts)

¡Excelente herramienta, muchísimas gracias!