• 概要
  • レビュー (3)
  • コメント (5)
  • 最新情報

FxSProMT

4

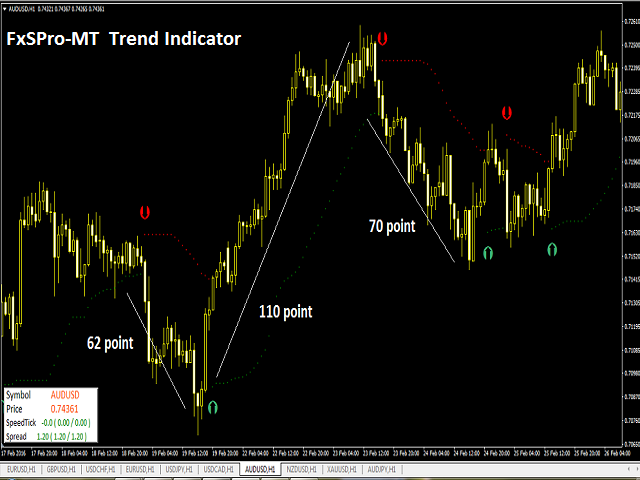
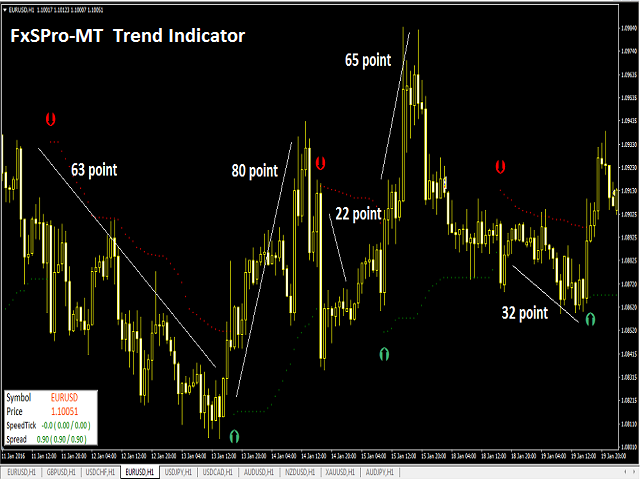
The FxSProMT indicator shows the current market trend and trend change.


Indicator Parameters

  • Ind_Period - the number of previous bars used to calculate actual values.
  • Number_Bars - the number of bars to display the indicator.. Too many bars may significantly slow down the operation of the trading terminal.
  • Signal_Sound - sound alert to notify of trend change. The sound can be played multiple times until the signal is confirmed (the bar closes). Default is disabled.
  • Signal_Alert - an alert to notify of trend change.
  • ShowCommen - show data window.
  • X_coord - the X coordinate of the data window.
  • Y_coord - the Y coordinate of the data window.

The trend direction id displayed by corresponding arrows on the symbol chart:

  • Green arrow - uptrend.
  • Red arrow - downtrend.

Data window (white):

  • Symbol AUDUSD - trading symbol.
  • Price 0.74361 - symbol price.
  • SpeedTick 0.0 (0.00 / 0.00) - the rate of price change: current ( max / average ). The values ​​will appear after a certain time since the indicator start. SpeedTick - if the rate of price change is above 3.0, there is a price movement (not true for 4-digit quotes).
  • Spread 1.2 (1.2 / 1.2) - spread value: current (min / max).


Trading Rules

  • Timeframe - H1 (main).
  • Currency pairs - any.
  • Entry to BUY - the indicator arrow must be green.
  • Entry to SELL - the indicator arrow must be red.

Recommended values: TakeProfit = 20 pips, StopLoss = 20 pips (for Н1). Upon reaching a profit of 10 pips, we close half of the position. In this case StopLoss should be moved to one of the levels:

  • 1 - StopLoss is moved иy the value of obtained profit.
  • 2 - StopLoss is moved to the position open price + 1 pip.

In any case, the remaining position is set to breakeven. The order lot must be at least twice as large as the minimum lot allowed by your broker.

The FxSProMT is used as the basic indicator. Also you can use an additional indicator to confirm signals (filter out false signals). To filter false signals, it is recommended to use th FxSPro-WPR indicators.

レビュー 3
Valentin Butorin
4120
Valentin Butorin 2020.10.18 12:40 
 

Not bad.

おすすめのプロダクト
This indicator uses a different approach from the previous version to get it's trendlines. This method is derived from Orchard Forex, and the process of making the indicator is demonstrated in there video   https://www.youtube.com/watch?v=mEaiurw56wY&t=1425s . The basic idea behind this indicator is it draws a   tangent line   on the highest levels and lowest levels of the bars used for calculation, while ensuring that the lines don't intersect with the bars in review (alittle confusing? I kno
FREE
A popular signal indicator marking buy/sell points. In this version, it is supplemented with optimal SL points. Recommended for use in conjunction with a trend indicator to filter signals. The indicator has only one adjustable parameter that determines its sensitivity, which greatly simplifies setting the indicator to the current market and the user's trading style. Indicator signals are given only after the full formation of the bar. The indicator can be used to trade any market. Its basic para
FREE
Do you use dynamic ranges (like Bollinger Bands or Envelopes) in your trading? A fixed period is usually used for such calculations. But is such approach relevant to the very nature of the market? In fact, the price chart consists of a series of successive processes - trends and flats. In this case, we can talk about the internal development logic inside a single process only. Therefore, the nature of the market is better described by dynamic ranges designed for the processes occurring "here and
FREE
[各指標の偏差MT4]は18個の指標の集合であり、そのうちの1つを任意に選択して計算に参加させることができます。それは各指標の偏差形を計算することができアラームを促すことができます。 パラメータ設定の説明 [指標]は、計算に参加する18の指標のうちの1つを選択することです (このパラメーターは非常に重要です) 。 [period]は各指標に共通の周期です。 [方法]はいくつかの指標のMAモードです。 [Apply_to]はいくつかの指標の適用価格です。 [Fast_EMA] [Slow_EMA] [MACD_SMA] [K_period] [D_period] [Slowing]これらはいくつかの指標に必要なパラメータですが、これらのパラメータを必要とする指標はほとんどありません。 [Forward_disparity]は、Kラインから現在のローまたはハイまでの最小距離です。 [Forward_count]は前方検索の最大数です。 [***表示形式***]下向きは矢印と線のサイズと色を設定することです。 [alert_NO_OFF]:これはア
FREE
Introduction RSI divergence is a main technique used to determine trend reversing when it’s time to sell or buy because prices are likely to drop or pick in the charts. The RSI Divergence indicator can help you locate the top and bottom of the market. This indicator finds Regular divergence for pullback the market and also finds hidden RSI Divergence to show continuing trend. This indicator shows divergence on the RSI that is a strong hint for an excellent entry point and finds immediately with
FREE
The Icarus Reversals(TM) FREE Indicator is a powerful tool to identify high-probability reversal points, across all instruments.  The Reversals Indicator provides traders and investors with a simple-to-use and highly dynamic insight into points of likely price-action reversals.  Generated by a unique proprietary code-set, the Reversals Indicator (FREE version) generates long and short trade signals, which can be customised for key inputs and colourisation. Settings of the Icarus Reversals FREE h
FREE
Советник "Parabolic SAR and Fractal" торгует по двум индикаторам: 1.Parabolic SAR, 2.Fractal Сделка на покупку: если образовался нижний фрактал и цена находится выше точек индикатора Parabolic SAR Сделка на прордажу: если образовался верхний фрактал и цена находится ниже точек индикатора Parabolic SAR    По желанию Пользователя применяется мартингейл (количество умножения лота при серии убытков ограничивается), пирамидинг, безубыток, трейлинг стоп,   возможно настроить, как скальпирующий с
FREE
Moving Average Dashboard Bars ago is a unique multi currency, multi time frame dashboard. The dashboard is very simple. You select two moving averages, the instruments and timeframes The Moving Average Dashboard Bars ago then shows how how many bars ago the moving averages made a bullish or bearish crossover. It also shows you in real time when there is a bullish or a bearish crossover. The indicator plots in a subwindow. The Moving Average Dashboard Bars ago can be beneficial if you are trading
FREE
Lisek Stochastic
Darius Hans Lischka
3 (7)
Lisek Stochastic   oscillator indicator with Alarm, Push Notifications and e-mail  Notifications. The Stochastic indicator is a momentum indicator that shows you how strong or weak the current trend is. It helps you identify overbought and oversold market conditions within a trend. The Stochastic indicator is lagging indicator, which means it don't predict where price is going, it is only providing data on where price has been !!! How to trade with Stochastic indicator: Trend following: As lon
FREE
NIGHTCrusher Lite FREE
Christian Opperskalski
4.5 (2)
NIGHTCRUSHER is a fully automated expert advisor, designed for scalping on quite market situation. The Lite - Version is limited to minimal Lot per Pair and dont has lot mulitplier and dynamic function you can also run different strategies like swing trading or grid different Trade Entry Signals different Exit Strategies included (MA Cut / Signal Change / Trailing TP) clever Risk & Money management - Balance based - Longrun trades tracking You can also use a Grid function or Lot multipier, if n
FREE
SMAconfirm
Muhammad Robith
4.5 (2)
This indicator helps you to comfirm SMAs' crossovers by draw a signal line that determines SMA movement direction. when Short SMA cross above Long SMA and Close price is above the signal several bars later, then uptrend is expected. when Short SMA cross below Long SMA and Close price is below the signal several bars later, then downtrend is expected. Input Description :  MA_Period_short: Short-term SMA's period. Used for short-term PriceX. Must be higher than 1.  MA_Period_long: Long-term SMA'
FREE
Trendy Stock is a price following indicator that uses Stochastic to show when the price is out of the oversold or overbought areas.  The algorithm allows you to stay longer in a trend where the bulls or bears are in control. The indicator changes color immediately the price exits oversold/overbought state. In short, the downtrend [red] bars start to paint when the buying pressure decreases while the uptrend [green] bars form as the buy pressure kicks in.  For MT5 version, follow ::     https://w
FREE
Ratio market
Aleksandr Krokhalev
4.33 (15)
Volatility under control. The indicator shows the optimal depth for setting goals within the day and on the average trend. It also builds pivot zones for the estimated correction depth. As an accompaniment, the key levels of the structure are displayed for several timeframes. Classical volatility indicators ATR & ADX on fixed timeframes are used for calculation. The calculation takes into account the spread, and if the market is slightly volatile, you will see a warning about the risk. You can c
FREE
EMA Separation plots 2 exponential moving averages, and a fill between them. The fill is colored differently according to an uptrend (short period EMA above long period EMA), or a downtrend (short period EMA below long period EMA). This is a small tool to help visualize the difference between long and short period averages. We hope you enjoy! EMA Separation can also be paired with our free EMA Separation Coefficient Parameters Short period (Default=10): # bars used to calculate short period EM
FREE
Free automatic Fibonacci is an indicator that automatically plots a Fibonacci retracement based on the number of bars you select on the BarsToScan setting in the indicator. The Fibonacci is automatically updated in real time as new highest and lowest values appears amongst the selected bars. You can select which level values to be displayed in the indicator settings. You can also select the color of the levels thus enabling the trader to be able to attach the indicator several times with differe
FREE
The ADX Indicator is known to be used to determine the trend direction. Not only that, but it also has deviation (+DI and -DI) that determine the direction of the trend as well. The role of the indicator is to spot the trend and its direction and generate signals accordingly. Indicator Settings: - ADX period : default is 14 periods (it works best with the timeframe H1). - Signal Width : the size of signals arrows. - Signal Distance : the distance of the signal arrow from the candle. - Signal c
FREE
This indicators automatically draws the Trend Channels for you once you've dropped it on a chart.  It reduces the hustle of drawing and redrawing these levels every time you analysis prices on a chart. With it, all you have to do is dropped it on a chart, adjust the settings to your liking and let the indicator do the rest.  Get an alternative version of this indicator here:   https://youtu.be/lt7Wn_bfjPE For more free stuff visit:  https://abctrading.xyz Parameters 1) Which trend do you want
FREE
Description: This indicator draw ZigZag Line in multiple time frame also search for Harmonic patterns before completion of the pattern. Features: Five instances of ZigZag indicators can be configured to any desired timeframe and inputs. Draw Harmonic pattern before pattern completion. Display Fibonacci retracement ratios. Configurable Fibonacci retracement ratios. Draw AB=CD based on Fibonacci retracement you define. You can define margin of error allowed in Harmonic or Fibonacci calculatio
FREE
The Hong Kong Stock Exchange Session's Hours This indicator facilitates observing the currency pair's quotations during subsequent parts of the stock exchange session live. Before the session starts, a rectangle is drawn on the chart but not filled in with color. It means the extent of the session duration. Before the first bar enters the rectangle of the session, a sound signal or pop-up window will notify us that the session will just start. When the price graph crosses the edge of the sess
FREE
Dynamic Price Volatility Indicator (DPVI) The Dynamic Price Volatility Indicator (DPVI) is designed to provide traders with valuable insights into market volatility and potential price movements. It combines elements of volatility analysis and trend identification to assist traders in making informed trading decisions. Features: Dynamic Volatility Bands: utilizes a proprietary algorithm to calculate dynamic volatility bands that adjust in real-time based on market conditions. These bands act
FREE
The Point-Percent Price Channel (PPPC or PP Price Channel) indicator is designed to display on the chart a channel whose width is specified both as a percentage of the current price and in points. Its appearance is presented on slide 1.             When the market moves up, the upper border of the channel is built at the price of High candles. In this case, the lower boundary follows the upper one at a strictly specified distance. When the price touches the lower border of the channe
FREE
MATrend
Michiel Pieter Christiaan Willem Van Brouwershaven
MATrend indicator makes the directional trend of the current market easily recognizable. Settings: MA Period : The amount of candles taken into consideration for the calculation of the moving average; MA Method : The method used for the calculation of the moving average. Selectable methods are:  Simple averaging; Exponential averaging; Smoothed averaging; Linear-weighed averaging; Usage: The color of the indcator will change based on the slope of the MA. Green : The indicator has a bullish
FREE
Voorloper MT4
Pradana Novan Rianto
4.14 (7)
Voorloper Expert Advisor: Revolutionizing Trading with DDR System Introducing Voorloper, an innovative Expert Advisor that blends Moving Average (MA) and Relative Strength Index (RSI) indicators to redefine your trading experience. Voorloper stands out from the crowd with its unique feature: the Drawdown Reduction (DDR) System. Key Features: MA and RSI Integration:   Voorloper utilizes a powerful combination of Moving Average and Relative Strength Index indicators to identify optimal entry and
FREE
It is a custom non-repaint indicator to identify trade opportunities in swing action as prices move within an upper and lower band. Inspired by the Keltner Channel, the most popular channel Indicator introduced by Chester Keltner. It is different with a Bollinger Bands. It represents volatility using the high and low prices, while Bollinger's studies rely on the standard deviation. The algorithm for this indicator is also available in the EntryMaximator EA. Including the option to use it or not.
FREE
R Scalper Arrows インジケーターは、通貨ペアの読みやすい売買シグナルの矢印を提供します。 短期的な傾向を予測するのに適しています。 上向きの矢印は、ペアが短期的な上昇トレンドにあることを示します。 下向きの矢印は、ペアが短期的な下降トレンドにあることを示します。 ロングトレードの場合は、ストップロスをピップの下に置きます。 ショート トレードの場合は、ピップの上にストップ ロスを設定します。 一緒に行く このインジケーターは、単純移動平均や指数移動平均などの外国為替インジケーターに続く長期トレンドと共に使用できます。 トレンド フォロー インジケーターが示すトレンドの方向にのみトレードします。 基本的な取引シグナル R Scalper Arrowsインジケーターシグナルは解釈が簡単で、次のようになります。 買い取引 – 紫色の上向き矢印がチャートに表示されたら、買い取引を開始します。 売り取引 – 紫色の下向き矢印がチャートに表示されると、売り取引が開始されます。 取引終了 – 反対のシグナルに基づいて取引を終了するか、独自の取引終了方
FREE
Just INDY
Pankom Sriboonlue
4.5 (2)
Just INDY is a simple, and easy to use trend and reversal indicator. It will continuously monitor the movement of the price actions searching for new trends establishing or strong reversals at extreme overbought, and oversold levels. Parameters Signal Perios Sent Notification Please Test it with Strategy Tester and see how it work. Happy Trading...
FREE
The  RSI Basket Currency Strenght  brings the RSI indicator to a new level.  Expanding the boundaries of TimeFrames and mono-currency analysis, the RSI Multi Time Frame Currency Strenght take the movements of each currency that composes the cross and confront them in the whole basket of 7 crosses.  The indicator works with any combination of  AUD, CAD, CHF, EUR, GBP, JPY, NZD, USD  pairs and with full automation takes in account every RSI value for the selected Time Frame.  After that, the indic
FREE
The product combines the best features of the standard CCI oscillator with the adaptive digital filter. The indicator allows entering and exiting the market at the very beginning and end of a trend. The indicator generates high-probability signals while retaining high sensitivity. The indicator does not repaint on fully formed bars. Options: Ind_Price - price used for the indicator calculation; Ind_Period - indicator period. Application rules: A big red dot - a strong bearish trend, if the price
FREE
このインジケーターは、トレードチャート上でドンチャンチャネルを視覚的に表現するためのものです。ドンチャンチャネルは、特定の期間における最高値と最低値の間の範囲を描画するためのシンプルなテクニカルツールです。このインジケーターは、価格動向の視覚的な分析を向上させ、潜在的なブレイクアウトとトレンドの継続ポイントに関する洞察を提供します。ドンチャンチャネルは、現在の時間枠とより高い時間枠の両方に適用できるため、このオプションを有効にすることができます。 インジケーターの主な特徴: Use_System_Visuals: このパラメータを有効にすると、システムの視覚スタイルとインジケーターの外観を切り替えることができます。有効にすると、インジケーターの視覚的要素はトレードプラットフォーム全体のテーマに合わせられます。 Signal_from_HT_Timeframe: このオプションを有効にすると、より高い時間枠からのシグナルを受信できます。言い換えれば、現在の時間枠でのトレーディングの決定に影響を与えるために、より長い時間枠でのドンチャンチャネルの動作を考慮できます。 HT_Timefram
FREE
Follow The Line
Oliver Gideon Amofa Appiah
4 (13)
FOLLOW THE LINE GET THE FULL VERSION HERE: https://www.mql5.com/en/market/product/36024 This indicator obeys the popular maxim that: "THE TREND IS YOUR FRIEND" It paints a GREEN line for BUY and also paints a RED line for SELL.  It gives alarms and alerts of all kinds. IT DOES NOT REPAINT and can be used for all currency pairs and timeframes. Yes, as easy and simple as that. Even a newbie can use it to make great and reliable trades. NB: For best results, get my other premium indicators for more
FREE
このプロダクトを購入した人は以下も購入しています
Gann Made Easy は、ミスター・ギャンの理論を使用した取引の最良の原則に基づいた、プロフェッショナルで使いやすい外国為替取引システムです。 W・D・ガン。このインジケーターは、ストップロスとテイクプロフィットレベルを含む正確な買いと売りのシグナルを提供します。 PUSH通知を利用して外出先でも取引可能です。 購入後はご連絡ください!私の取引のヒントと素晴らしいボーナスインジケーターを無料で共有します! おそらく、ギャンの取引手法についてはすでに何度も聞いたことがあるでしょう。通常、ギャンの理論は初心者のトレーダーだけでなく、すでにある程度の取引経験がある人にとっても非常に複雑なものです。なぜなら、ギャンの取引手法は理論的にはそれほど簡単に適用できるものではないからです。私はその知識を磨き、最良の原則を私の外国為替インジケーターに組み込むために数年を費やしました。 このインジケーターは非常に簡単に適用できます。必要なのは、それをチャートに添付し、簡単な取引推奨事項に従うだけです。このインジケーターは常に市場分析の仕事を行い、取引の機会を探します。適切なエントリーポイントを検出
まず第一に、この取引インジケーターは再描画されず、再描画されず、遅延しないことを強調する価値があります。これにより、手動取引とロボット取引の両方に理想的なものになります。 アトミックアナリストは、価格の強さとモメンタムを利用して市場でより良いエッジを見つけるためのPA価格アクションインジケーターです。ノイズや誤ったシグナルを除去し、取引ポテンシャルを高めるための高度なフィルターを備えています。複雑なインジケーターの複数のレイヤーを使用して、アトミックアナリストはチャートをスキャンし、複雑な数学的計算をシンプルなシグナルと色に変換します。これにより、どのような初心者トレーダーでも理解して使用し、一貫した取引の決定を行うことができます。 「アトミックアナリスト」は、新規および経験豊富なトレーダー向けにカスタマイズされた包括的な取引ソリューションです。プレミアムインジケーターとトップノッチの機能を1つの取引戦略に組み合わせ、すべてのタイプのトレーダーにとって汎用性のある選択肢にします。 デイリートレーディングとスキャルピング戦略:高速で正確なデイトレーディングおよび短期トレード
Gold Stuff
Vasiliy Strukov
4.89 (250)
Gold Stuff は、金専用に設計されたトレンド指標であり、あらゆる金融商品にも使用できます。 インジケーターは再描画せず、遅れません。 推奨時間枠 H1. それインディケータでフルオートExpert Advisor EA Gold Stuffが動作します。 あなたは私のプロフィールでそれを見つけることができます. 設定と個人的なボーナスを得るために、購入後すぐに私に連絡してください!   設定 矢印を描く - オンオフ。 チャートに矢印を描く。 アラート - 可聴アラートのオンオフ。 メール通知 - オンオフ。 電子メール通知。 プチ通知 - オンオフ。 プッシュ通知。 次に、色域を調整します。 Gold Stuff は、金専用に設計されたトレンド指標であり、あらゆる金融商品にも使用できます。 インジケーターは再描画せず、遅れません。 推奨時間枠 H1. それインディケータでフルオートExpert Advisor EA Gold Stuffが動作します。 あなたは私のプロフィールでそれを見つけることができます. 設定と個人的なボーナスを得るために、購入後
Scalper Vault は、スキャルピングを成功させるために必要なすべてを提供するプロフェッショナルなスキャルピング システムです。このインジケーターは、外国為替およびバイナリー オプションのトレーダーが使用できる完全な取引システムです。推奨される時間枠は M5 です。 システムは、トレンドの方向に正確な矢印シグナルを提供します。また、トップとボトムのシグナルとギャン マーケット レベルも提供します。 インジケーターは、プッシュ通知を含むすべてのタイプのアラートを提供します。 インジケータの購入後にご連絡ください。私の個人的な取引の推奨事項と素晴らしいボーナス指標を無料で共有します! 幸せで有益な取引をお祈りします!
TPSpro TRENDPRO  - is a trend indicator that automatically analyzes the market and provides information about the trend and each of its changes, as well as giving signals for entering trades without redrawing! The indicator uses each candle, analyzing them separately. referring to different impulses - up or down impulse. Exact entry points into transactions for currencies, crypto, metals, stocks, indices!  -  Version MT5               DETAILED DESCRIPTION        /       TRADING SETUPS           
Trend Screener
STE S.S.COMPANY
4.83 (86)
トレンドインジケーター、1つのツールに組み込まれたすべての重要なトレンド機能を備えたトレンドトレーディングとフィルタリングのための画期的なユニークなソリューション! これは、すべてのシンボル/商品(外国為替、商品、暗号通貨、インデックス、株式)で使用できる100%再描画されていないマルチタイムフレームおよびマルチ通貨インジケーターです。 トレンドスクリーナーは、チャート内のドットで矢印トレンドシグナルを提供するインジケーターに続く効率的なインジケーターです。 トレンド分析インジケーターで使用できる機能: 1.トレンドスキャナー。 2.最大利益分析を備えたトレンドライン。 3.トレンド通貨強度メーター。 4.アラート付きのトレンド反転ドット。 5.アラート付きの強いトレンドドット。 6.トレンド矢印 毎日の分析例、毎日のシグナルパフォーマンス...など、トレンドスクリーナーインジケーターを使用して、ここで見つけることができます: ここをクリックしてください 期間限定オファー:トレンドスクリーナーインジケーターは、50ドルと生涯でのみご利用いただけます。 (元の価格125 $) MQ
ご紹介   クォンタム トレンド スナイパー インジケーターは 、トレンド反転を特定して取引する方法を変革する画期的な MQL5 インジケーターです。 13年以上の取引経験を持つ経験豊富なトレーダーのチームによって開発されました。     クォンタムトレンドスナイパーインジケーター   は、非常に高い精度でトレンドの反転を識別する革新的な方法で、あなたのトレーディングの旅を新たな高みに押し上げるように設計されています。 ***Quantum Trend Sniper Indicatorを購入すると、Quantum Breakout Indicatorを無料で入手できます!*** クォンタム ブレイクアウト インジケーターは、トレンドの反転を特定するとアラートを発し、矢印を示し、3 つのテイクプロフィットレベルを提案します。 初心者トレーダーにもプロのトレーダーにも適しています。 量子EAチャネル:       ここをクリック MT5のバージョン:       ここをクリック 推奨事項: 期間: すべての時間枠。最良の結果を得るには、
まず第一に、この取引ツールはノンリペイント、ノンリドロー、ノンラグの指標であり、プロの取引に理想的ですことを強調する価値があります。 スマートプライスアクションコンセプトインジケーターは、新米から経験豊富なトレーダーまで、非常 に強力なツールです。Inner Circle Trader AnalysisやSmart Money Concepts Trading Strategiesなど、20以上の有用な指標を1つに組み合わせています。このインジケーターはスマートマネーコンセプトに焦点を当て、大手機関の取引方法を提供し、彼らの動きを予測するのに役立ちます。 特に、流動性分析に優れており、機関がどのように取引しているかを理解しやすくしています。市場のトレンドを予測し、価格の動きを慎重に分析するのに優れています。機関の戦略とトレードを合わせることで、市場の動向についてより正確な予測ができます。このインジケーターは多目的であり、市場構造を分析し、重要な注文ブロックを特定し、さまざまなパターンを認識するのに優れています。 このインジケーターはBOSやCHoCHなどのパターンの識
現在26%オフ 初心者やエキスパートトレーダーに最適なソリューション! このインジケーターは、独自の機能と新しい計算式を取り入れた、ユニークで高品質、かつ手頃な価格のトレーディングツールです。たった1枚のチャートで28の為替ペアの通貨強度を読み取ることができます。新しいトレンドやスキャルピングチャンスの引き金となるポイントを正確に特定することができるので、あなたのトレードがどのように改善されるか想像してみてください。 ユーザーマニュアルはこちら  https://www.mql5.com/en/blogs/post/697384 これが最初の1本、オリジナルだ! 価値のないクローンを買わないでください。 特別な サブウィンドウの矢印で強い通貨の勢いを表示 GAPがあなたのトレードを導く! 基準通貨や気配値が売られすぎ・買われすぎのゾーン(外相フィボナッチレベル)にあるとき、個別チャートのメインウィンドウに警告表示。 通貨がレンジの外側から反落した場合、プルバック/リバーサルのアラート。 クロスパターンの特別なアラート 複数の時間枠を選択可能で、トレンドを素早く
A key element in trading is zones or levels from which decisions to buy or sell a trading instrument are made. Despite attempts by major players to conceal their presence in the market, they inevitably leave traces. Our task was to learn how to identify these traces and interpret them correctly. Reversal First Impulse levels (RFI)   -  Version MT5                INSTRUCTIONS                 RUS                 ENG                                       R ecommended to use with an indicator   -  
Advanced Supply Demand
Bernhard Schweigert
4.92 (310)
現在33%オフ 初心者にもエキスパートトレーダーにも最適なソリューション このインジケーターは独自の機能と新しい公式を多数内蔵しており、ユニークで高品質かつ手頃な取引ツールです。このアップデートでは、2つの時間枠ゾーンを表示できるようになります。より長いTFだけでなく、チャートTFとより長いTF(ネストゾーンを表示)の両方を表示できます。すべてのSupply Demandトレーダーの皆さんのお気に召すはずです。:) 重要情報の公開 Advanced Supply Demandの可能性を最大化するには、 https://www.mql5.com/ja/blogs/post/720245 にアクセスしてください。   エントリーまたはターゲットの正確なトリガーポイントを正確に特定できれば取引がどのように改善されるか想像してみてください。新しい基盤となるアルゴリズムに基づいて構築されているため、買い手と売り手の間の潜在的な不均衡をさらに簡単に特定できます。これは、最も強い需要と供給のゾーンと、過去のパフォーマンス(古いゾーンを表示)がグラフィカルに表現されるためです。これらの機能は、最適
これはMT4のインジケーターで、再描画なしで取引に参入するための正確なシグナルを提供します。 外国為替、暗号通貨、金属、株式、インデックスなど、あらゆる金融資産に適用できます。かなり正確な見積もりを提供し、取引を開始して終了するのに最適な時期を教えてくれます。1つのシグナルを処理しただけでインジケーターの元が取れた例の 動画 (6:22)をご覧ください。Entry PointsPro インジケーターの助けを借りたほとんどのトレーダーの最初の1週間の結果が改善しています。 Telegramグループ に登録してください。Entry Points Proインジケーターのメリットは次の通りです。 再描画のないエントリーシグナル 再描画されるインジケーターでは一度表示されたシグナルが削除されて大きな金銭的損失につながることがありますが、これと異なり、表示されて確認されたシグナルは消えることがありません。 エラーなしの取引開始 インジケーターアルゴリズムによって取引を開始する(資産を売買する)理想的な瞬間を見つけることができます。それを使用するすべてのトレーダーの成功率が向上します。
SALE NOW! Limited Time Offer! An exclusive indicator that utilizes an innovative algorithm to swiftly and accurately determine the market trend. The indicator automatically calculates opening, closing, and profit levels, providing detailed trading statistics. With these features, you can choose the most appropriate trading instrument for the current market conditions. Additionally, you can easily integrate your own arrow indicators into Scalper Inside Pro to quickly evaluate their statistics and
カスタムMT4インジケーターで外国為替取引を成功させるための秘密を発見してください! 外国為替市場で成功を達成し、リスクを最小限に抑えながら一貫して利益を得る方法を疑問に思ったことはありますか? これがあなたが探している答えです! 取引へのアプローチに革命をもたらす独自のMT4インジケーターを導入できるようにします。 ユニークな汎用性 私たちのインジケータは、RenkoとRangeBarのろうそくのフォーメーションを好むユーザー向けに特別に設計されています。 これらのチャートタイプは多くの経験豊富なトレーダーに好まれていることを理解しています。そのため、私たちのインジケーターはそれらとシームレスに統合され、比類のない市場分析を提供します。 クリアトレンドシグナル 複雑な分析を忘れてください! 私たちのインジケーターは、鮮やかな色と明確なドット構造を利用して、市場の動向を明確に示しています。 赤と青の点は、価格の動きの方向性について疑いの余地がなく、取引の迅速な意思決定を可能にします。 HH/HL HL/LL戦略とのアライメント HH/HLおよびHL/LL構
TrendMaestro
Stefano Frisetti
5 (2)
note: this indicator is for METATRADER4, if you want the version for METATRADER5 this is the link: TRENDMAESTRO recognizes a new TREND in the bud, he never makes mistakes. The certainty of identifying a new TREND is priceless. DESCRIPTION TRENDMAESTRO identifies a new TREND in the bud, this indicator examines the volatility, volumes and momentum to identify the moment in which there is an explosion of one or more of these data and therefore the moment in which prices have strong probability of f
現在20%OFF! 初心者やエキスパートトレーダーのためのベストソリューション! このダッシュボードソフトウェアは、28の通貨ペアで動作しています。それは私達の主要な指標(高度な通貨の強さ28と高度な通貨インパルス)の2に基づいています。それは全体の外国為替市場の大きい概観を与えます。それは、すべての(9)時間枠で28の外国為替ペアのための高度な通貨の強さの値、通貨の動きの速度と信号を示しています。チャート上で1つのインディケータを使用して市場全体を観察し、トレンドやスキャルピングの機会をピンポイントで見つけることができたら、あなたのトレードがどのように改善されるか想像してみてください。 このインディケータには、強い通貨と弱い通貨の識別、潜在的な取引の識別と確認がより簡単になるような機能が搭載されています。このインディケータは、通貨の強さや弱さが増加しているか減少しているか、また、すべての時間枠でどのように機能しているかをグラフィカルに表示します。 新機能として、現在の市場環境の変化に適応するダイナミックなマーケットフィボナッチレベルが追加され、すでに当社のAdvan
驚異的なFXインジケーター「Miraculous」をご紹介します。完璧な結果を得るための1時間足を含むすべてのタイムフレームで効果的に機能する、最強の強力な特殊MT4フォレックスインジケーターです。 すべてのタイムフレームで優れた結果を提供する最高のFXインジケーターを探し続けるのに疲れましたか?これ以上探す必要はありません!「Miraculous」フォレックスインジケーターをご紹介します。このインジケーターは、トレーディングの経験を変革し、収益を新たなレベルに引き上げるために設計されました。 先進のテクノロジーと長年にわたる緻密な開発に基づいて構築された「Miraculous」フォレックスインジケーターは、FX市場における力と正確さの頂点となります。この素晴らしいツールは、すべてのレベルのトレーダーのニーズを満たすように設計されており、一貫した収益性を追求する上で比類のない優位性を提供します。 「Miraculous」フォレックスインジケーターの他との違いは、その非常に適応性にあります。デイトレーダー、スウィングトレーダーであろうと、長期ポジションを好む方であろうと、このインジケータ
ブレーカートレーダーになり、価格が反転すると市場構造からの利益が変化します。 注文ブロックブレーカーインジケーターは、トレンドまたは価格の動きが枯渇に近づいており、逆転の準備ができていることを識別します。通常、反転または大規模なプルバックが発生しようとしているときに発生する市場構造の変化について警告します。 この指標は、ブレイクアウトと価格の勢いを識別する独自の計算を使用します。使い果たされる可能性のあるポイントの近くで新しい高値が形成されるたびに、インディケーターはその高値の作成を担当する最後の注文ブロックを描きます。次に、移動する価格とともに注文ブロックを追跡します。その後、価格が反対方向にシフトし、その注文ブロックを突破すると、新しい市場構造を作成し、トレンドまたは大きな後退の可能性のある反転の開始を警告します。 注文ブロックは、高値/安値が作成される前の最後の反対色のろうそくであり、価格がこれらの重要な領域を下抜けすると、トレンドの短期的ま​​たは長期的な反転の兆候です。 特徴 重要な枯渇点での市場構造の変化を警告します 価格が使い果たされるレベルに近づくと、
mql5と Telegramの モーニング・ブリーフィングで、詳細とスクリーンショットを含む毎日のマーケット・アップデートをご覧 ください! FX Power MT4 NGは 、長年の人気を誇る通貨強度計FX Powerの次世代モデルです。 この次世代ストレングスメーターは何を提供するのでしょうか?初代FXパワーの魅力すべて プラス GOLD/XAUの強さ分析 より正確な計算結果 個別に設定可能な分析期間 カスタマイズ可能な計算上限値により、さらに優れたパフォーマンスを実現 もっと見たい人のための特別なマルチインスタンス設定 すべてのチャートでお好みの色を無限に設定可能 数え切れないほどの通知オプションにより、重要なことを見逃すことはありません。 Windows 11とmacOSのスタイルで角を丸くした新しいデザイン 魔法のように動くインジケーターパネル FXパワーの主な機能 すべての主要通貨の強さの完全な履歴 すべての時間枠における通貨の強さの履歴 すべてのブローカーとチャートで同一の計算結果 100%信頼できるリアルタイム計算 -> リペイントなし ドロップダウン・リストから
複数通貨と複数フレームの売買に関するアラート。 自動トレーリングストップとリスク報酬で利益を獲得! インジケーターが市場をスキャンして分析するため、何もする必要はありません。 1 つのチャートですべての通貨を取引しましょう!   購入後、コメントを残して私に連絡してください。トレードアシスタントEAをお送りします。 このインジケーターはいくつかのオシレーターと付属のフィルターを使用して、最良の確認されたエントリーポイントを見つけますので、それについて心配する必要はありません。 警告が表示され、監視することを選択したすべての時間枠と通貨のボタンが描画されます。 ボタンを押すだけでチャートに移動し、取引を開始できます。 このインジケーターは、すべての基本通貨と市場監視通貨の強さパネルも描画します (設定で調整可能)。これにより、すべてのペアの通貨と選択されたより高い時間枠が表示されます。 インジケーターウィンドウ: チャート通貨のトレンドフィルターとマルチタイムフレームトレンドパネルを備えた特別なMACDヒストグラム! すべての通貨と時間枠の取引アラートを提供し、
ご紹介     Quantum Breakout PRO は 、ブレイクアウト ゾーンの取引方法を変革する画期的な MQL5 インジケーターです。 13年以上の取引経験を持つ経験豊富なトレーダーのチームによって開発された Quantum Breakout PROは 、革新的でダイナミックなブレイクアウトゾーン戦略により、あなたの取引の旅を新たな高みに押し上げるように設計されています。 クォンタム ブレイクアウト インジケーターは、5 つの利益ターゲット ゾーンを備えたブレイクアウト ゾーン上のシグナル矢印と、ブレイクアウト ボックスに基づいたストップロスの提案を提供します。 初心者トレーダーにもプロのトレーダーにも適しています。 量子EAチャネル:       ここをクリック MT5バージョン:   ここをクリック 重要!購入後、インストールマニュアルを受け取るためにプライベートメッセージを送ってください。 推奨事項: 時間枠: M15 通貨ペア: GBPJPY、EURJPY、USDJPY、NZDUSD、XAUUSD アカウントの種類: ECN、Raw、また
PRO Renko Systemは、特別にRENKOチャートを取引するために設計された高精度の取引システムです。 これは、様々な取引商品に適用することができる普遍的なシステムです。 システムは効果的に正確な逆転信号へのアクセスを与えるいわゆる市場の騒音を中和する。 表示器は非常に使いやすく、信号の生成に責任がある1つの変数だけがあります。 あなたは簡単にお好みの任意の取引ツールとレンコバーのサイズにツールを適応させることができます。 私はいつもあなたが私のソフトウェアで収益性の高い取引を支援するために余分なサポートを提供する準備ができています! 私はあなたに幸せで収益性の高い取引をしたいです! ご購入後にご連絡ください! 私はあなたに私のレンコチャートジェネレータを送信します。 私はまた、私の個人的な推奨事項やシステムの他のモジュールを無料で共有します!
TrendDecoder Premium
Christophe, Pa Trouillas
5 (3)
レンジと次の動きを特定    |  トレンドの最も早いシグナルと強さを得る   |  反転の前に明確な出口を得る   |  価格がテストするフィボ・レベルを見つける。 非リペイント、非遅延インディケータ - マニュアルおよび自動売買に最適 - すべての資産、すべての時間単位に対応 期間限定キャンペーン   >> 50%OFF 購入後、 推奨セッティングについては、このチャンネルで私に連絡してください。 MT5 バージョン: ここをクリック BladeSCALPER   と   PowerZONES   を使った完全な方法を入手する どのようなものですか? TrendDECODERは、トレンド監視をシンプルかつ簡単にするための複数のイノベーションを集約したものです。 Projective TrendLine (投影トレンドライン) - 今後のトレンドのスピードリファレンス。 RealTime TrendLine vs. Projective TrendLine (リアルタイムトレンドライン vs. Projective TrendLine) - 市場が同じ方
通貨強さウィザードは、取引を成功させるためのオールインワン ソリューションを提供する非常に強力な指標です。このインジケーターは、複数の時間枠のすべての通貨のデータを使用して、このまたはその外国為替ペアのパワーを計算します。このデータは、使いやすい通貨インデックスと通貨パワーラインの形式で表され、特定の通貨のパワーを確認するために使用できます。 必要なのは、取引したいチャートにインジケーターを接続することだけです。インジケーターは、取引する通貨の実際の強さを示します。このインジケーターは、トレンドに合わせて取引するときに有利に利用できる売買高の圧力の極値も示します。このインジケーターには、フィボナッチに基づく可能なターゲットも表示されます。 このインジケーターは、PUSH 通知を含むあらゆるタイプのアラートを提供します。 購入後ご連絡下さい。私の取引のヒントをあなたと共有し、素晴らしいボーナスインジケーターを無料で提供します! 幸せで有益な取引をお祈りします。
This indicator is unstoppable when combined with our other indicator called Katana. After purchase, send us a message and you could get Katana for FREE as a BONUS After purchase, send us a private message for your instructions.  MT5 version: click here 40 copies available at $55. There are 3 copies left before the next price of $105. Don't miss this great deal!  The Trend Forecasting indicator is a very unique & easy tool that is able to make prediction about future price movement
現在31%オフ! 初心者やエキスパートトレーダーに最適なソリューション! このインジケータは、独自の機能と秘密の数式を組み込んだ、ユニークで高品質かつ手頃な価格のトレーディングツールです。たった1枚のチャートで28の通貨ペアのアラートを表示します。新しいトレンドやスキャルピングチャンスの引き金となるポイントを正確に把握することができるので、あなたのトレードがどのように改善されるか想像してみてください! 新しい基本的なアルゴリズムに基づいて構築されているため、潜在的な取引の特定と確認がより簡単になります。これは、通貨の強さや弱さが加速しているかどうかをグラフィカルに表示し、その加速のスピードを測定するためです。加速すると物事は明らかに速く進みますが、これはFX市場でも同じです。つまり、反対方向に加速している通貨をペアにすれば、利益を生む可能性のある取引を特定することができるのです。 通貨の勢いを示す縦の線と矢印は、あなたの取引の指針となるでしょう。 ダイナミックマーケットフィボナッチ23レベルはアラートトリガーとして使用され、市場の動きに適応します。もしインパルスが黄色
FX Volume
Daniel Stein
4.6 (35)
mql5と Telegramの モーニング・ブリーフィングで、詳細とスクリーンショットを含む毎日のマーケット・アップデートをご覧 ください! FX Volumeは、ブローカーの視点から市場のセンチメントをリアルに洞察する、最初で唯一の出来高インジケーターです。 ブローカーのような機関投資家が外国為替市場でどのようなポジションをとっているか、COTレポートよりもはるかに速く、素晴らしい洞察を提供します。 この情報をチャート上で直接見ることは、あなたの取引にとって真のゲームチェンジャーであり、画期的なソリューションです。 以下のようなユニークなマーケットデータ洞察から利益を得てください。 比率は 、通貨のロングポジションとショートポジションの比率をパーセントで表示します。 比率の変化は 、選択した期間内のロング比率とその変化率を表示します。 Volumes Totalは 、通貨の取引量(ロングとショート)の合計をロット単位で表示します。 Volumes Long :全通貨のロングポジションの取引量を表示します。 Volumes(ショート )は、全通貨のショートポジションの取引量を表示
up-down indicator is no repaint and works all pairs and lower than weekly time frames charts. it is suitable also 1 m charts for all pairs. and hold long way to signal. dont gives too many signals. when red histogram cross trigger line that is up signal.and price probably will down when blue histogram cross trigger line that is down signal.and price probably will go up. when the signals not seen press + button on terminal . too see weekly chart because of low data on chart ,it needs to lower p
このインジケータは、手動および自動的な方法でチャートに描かれたハーモニックパターンを検出します。ユーザーマニュアルは、このリンクから参照できます: あなたのレビューを追加し、入手するために私たちに連絡してください。 この製品をmt4で試すための無料版があります。 GartleyおよびNenstarパターンを検出するために使用できます。 https://www.mql5.com/en/market/product/30181 完全なMT4バージョンを購入するには、次の場所から購入できます。 https://www.mql5.com/en/market/product/15212 注 インジケータにはコントロールパネルがあり、すべての(チャート&時間枠)設定が保存されます。チャート上でスペースをより多く確保するために、最小化することができ、他の分析ツールで作業する場合は、すべてのインジケータデータを非表示にするために閉じるボタンを押すことができます。 このインジケータを使用して設定を変更し、移動平均やボリンジャーバンドなどのインジケータを追加すると、編集のテンプレートが自動的に保存され、必
TakePropips Donchian Trend Pro
Eric John Pajarillaga Aldana
4.82 (17)
TakePropips Donchian Trend Pro   (MT4) は、ドンチャン チャネルを使用してトレンドの方向を自動的に検出し、エントリーとエグジットの取引シグナルを提供する強力で効果的なツールです! この多機能インジケーターには、トレンド スキャナー、取引シグナル、統計パネル、スクリーナー、取引セッション、およびアラート履歴ダッシュボードが含まれます。取引シグナルを提供し、チャートを分析する時間を節約するように設計されています! ユーザー マニュアルとインストール ガイドは、ブログ投稿 (   https://www.mql5.com/en/blogs/post/751368   ) からダウンロードできます。 今日は 50% オフ! 98ドルから49ドルに値下げ! このインジケーターは、ストラテジー テスターでテストできます (ビジュアル モードを有効にします)。ライブ チャートでテストしたい場合は、7 日間の試用版を入手するようにメッセージを送ることもできます。 詳細については、説明の下にあるビデオ チュートリアルも利用できます。 ご不明な点やサポートが必
作者のその他のプロダクト
This EA requires a broker having Market Execution (ECN, NDD, STP accounts), low spread, zero StopLevel (or close to such level), no commission if possible (as it influences on the profit amount). Order executin time should be measured in milliseconds, not minutes, requotes and slippage should not happen too often. Deposit: Minimum deposit is $50 (MinLot = 0.01) or $500 (MinLot = 0.1) Recommended currency pairs: EURUSD, GBPUSD, AUDUSD, NZDUSD, USDJPY, USDCHF, USDCAD No Martingale / No grid / No a
FREE
The e-FastCHF EA is developed for GBPCHF. The EA has no trading limitations only on GBPCHF. 16.01.2015. The Swiss National Bank decided not to support the EUR/CHF course on the level of (1.20). Now it is pegged not to EUR but to USD. Our strategy is based on this fact. Tests have been performed from 02.01.2015. Timeframe – М15 Currency pair – GBPCHF No Martingale Calculation of lot basing on the balance (risk per trade). Supporting ECN accounts. This option operates as follows: first a position
FREE
Trade Space PRO   Профессиональная торговая панель для MT4. Главное  ПРЕИМУЩЕСТВО - все настройки выведены на график символа. Запоминаются автоматически для каждого символа отдельно.  Трейдинг/риски/блок контроля новостей и тайминга/панель сигналов .  Вся важная информация отображается на панелях.  Вам нужно только открыть позицию одним щелчком мыши. Управление открытой позицией так же просто,  насколько это возможно:  вы можете легко настроить уровни Стоп Лосса (S/L) и Тейк Профита (T/P).  В о
FREE
The FxSProWPR oscillator generates signals for trend confirmation, which can also nbe used to confirm the emergence of new trends. Indicator Parameters NumberBars - the number of bars to display the indicator. Too many bars may significantly slow down the operation of the trading terminal. SignalAlert - an Alert notifying of a trend. SignalSound - sound alert to notify of a trend. The sound will be played once the histogram exceeds the level of 15. Rules to confirm position entry Green histo
FREE
PARTIAL CLOSE & VIRTUAL TRAILING Virtual trailing with partial position closing. ea-PartTrailing&Close is a fully automated Expert Advisor for tracking trades. Version =Simple= provides tracking of one BUY or SELL orders (or 1 Buy+1 Sell simultaneously). The EA is almost perfect at averaging profit and loss. StopLoss without TakeProfit is recommended since the latter may limit your profit in case of sharp price spikes. The trailing is virtual since every movement of the levels responsible for a
The Fx-PIOT indicator determines the movement direction of a financial instrument using a combined signal: the main signal + 2 filters. The screenshots were taken in real-time mode (/ Date=2017.01.24 / Symbol=NZDJPY / TF=H1 /). The main signal is displayed as arrows (Up / Down) + possible reversal zones. Calculation is made using the Open, Close, High and Low prices. Filter #1 is a trend filter determining trend on the D1 time-frame; it outputs a message: "Buy Signal" / "Wait for Signal" / "Sell
Virtual Trailing and Closing Profit by parts U Trail and Close Part is a fully automated Expert Advisor for managing trades. The following functions are used in the Expert Advisor: Calculation of risk in a position StopLoss - used for calculation of risk in a trade. LotFixedUse - only a fixed lot is used. LotFixed - fixed lot size. RiskMM - percentage of risk in the position. The function is active if the fixed lot is disabled. Partial profit taking PartialOn - enable partial closure (true
DIFF-2Pairs   detects divergences of correlated pairs considering lots balancing  (+ built-in strategy tester ). The indicator has a system for measuring the divergence of correlated pairs by various methods to estimate the value of the differential curve: the system can measure performance. statistical analysis to determine the optimal SL and TP. exporting data to a CSV file. Currently, the indicator supports the following deviations of the correlated pairs: The standard deviation is the measur
フィルタ:
Valentin Butorin
4120
Valentin Butorin 2020.10.18 12:40 
 

Not bad.

Tim Eubanks
5733
Tim Eubanks 2018.03.19 01:55 
 

The signals are not so good on the H1 timeframe. But gives a better indication on the lower timeframes.

Mohammed Abdulwadud Soubra
37106
Mohammed Abdulwadud Soubra 2017.11.30 19:38 
 

ユーザーは評価に対して何もコメントを残しませんでした

レビューに返信
バージョン 1.30 2021.11.21
Скомпилирована под последний билд