MT4 CCI Dashboard Scanner

MT4 CCIダッシュボードスキャナーは、さまざまな時間枠と商品にわたるコモディティチャネル指数(CCI)レベルを追跡し、新しいシグナルが検出されるとリアルタイムでアラートを提供します。ユーザーフレンドリーで、コンピュータの処理能力に優しく、どのコンピュータでもスムーズに動作します。

主な機能:

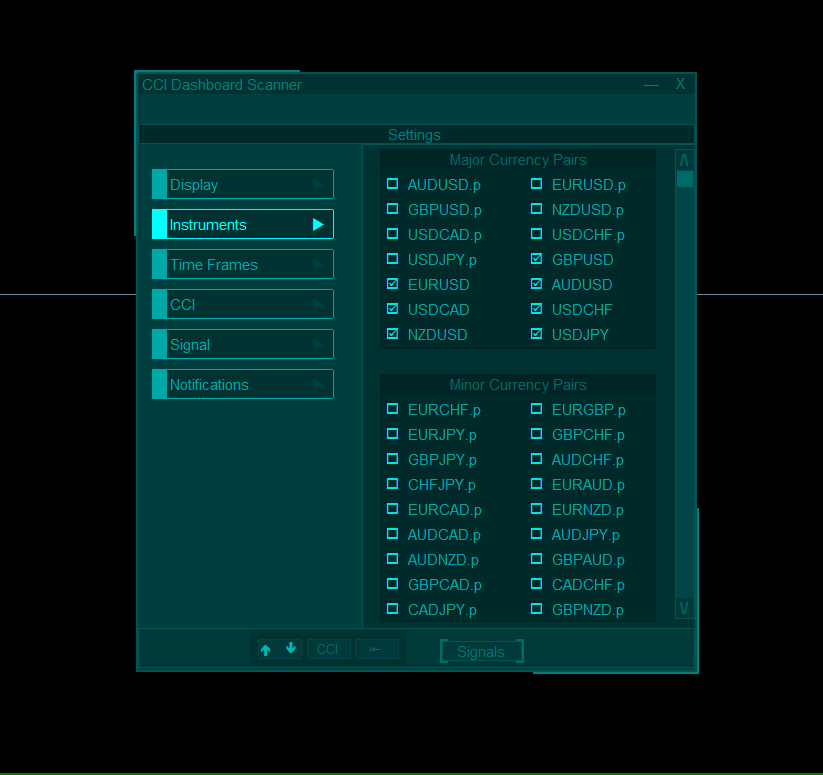
  • 自動インスツルメントグルーピング: スキャナーは、マーケットウォッチリストからすべてのインスツルメントを収集し、カテゴリ(メジャー、マイナー、エキゾチック、その他)に整理します。設定の簡単なチェックボックスインターフェースを使用して、スキャンするインスツルメントを簡単に選択できます。
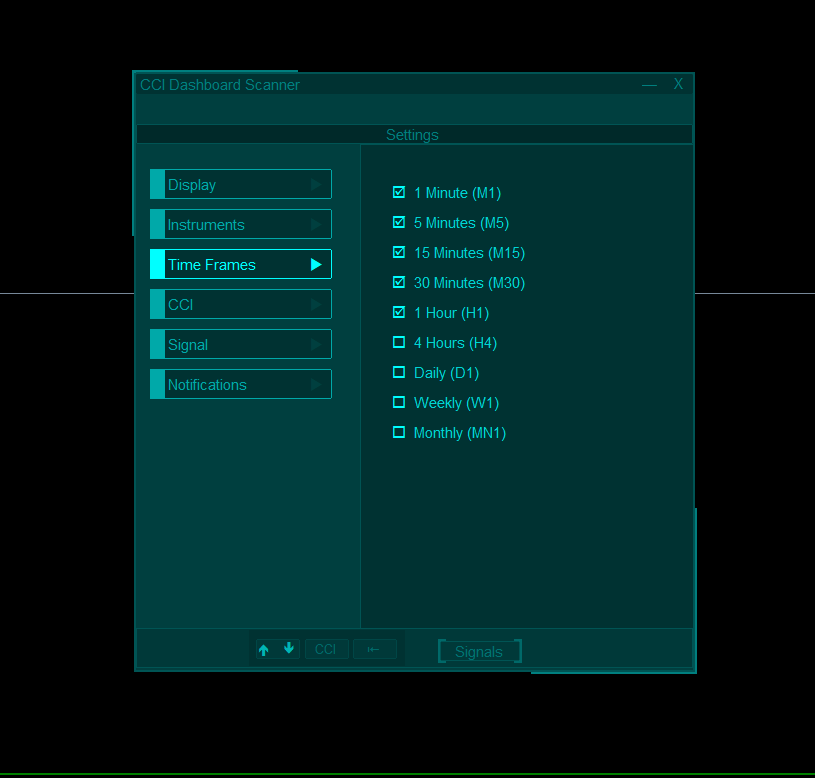
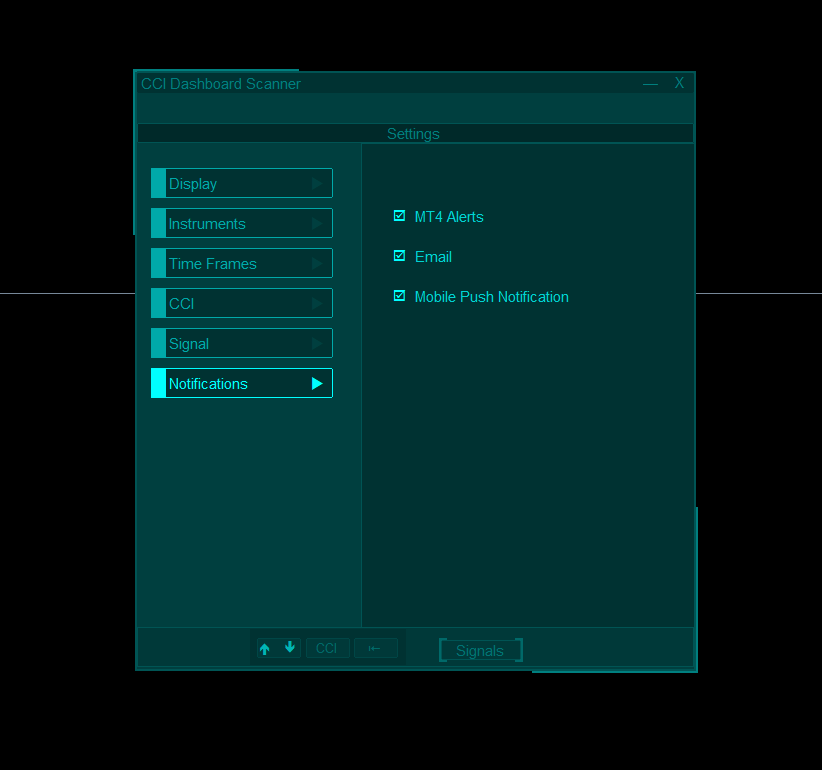
  • カスタマイズ可能な時間枠選択: 設定ページから、9つの異なる時間枠のいずれかを選択してスキャンできます。選択されたすべての時間枠はダッシュボードに表示され、新しいシグナル通知が各時間枠ごとに送信されます。
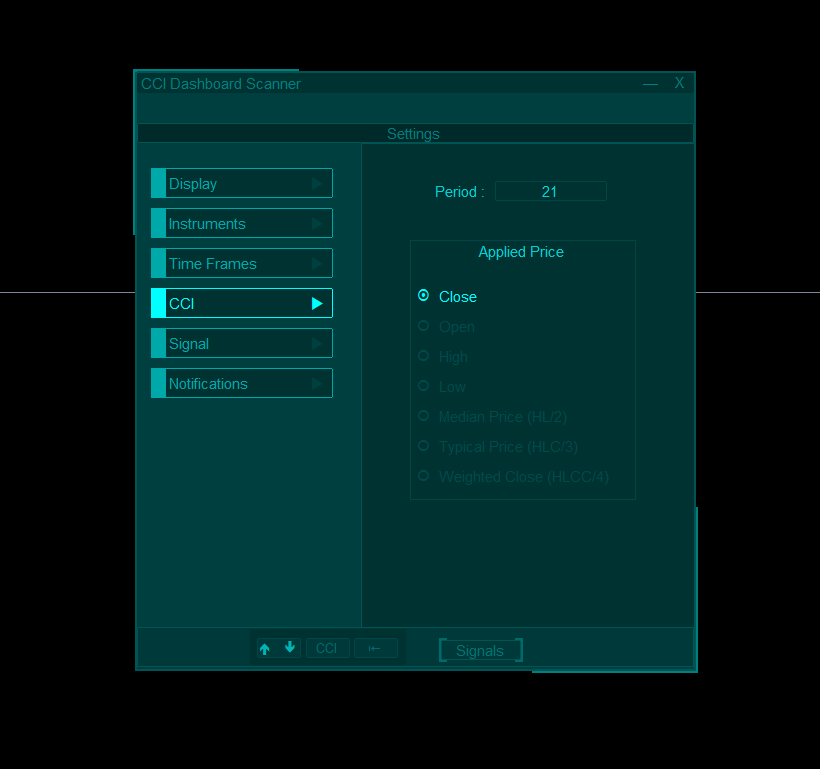
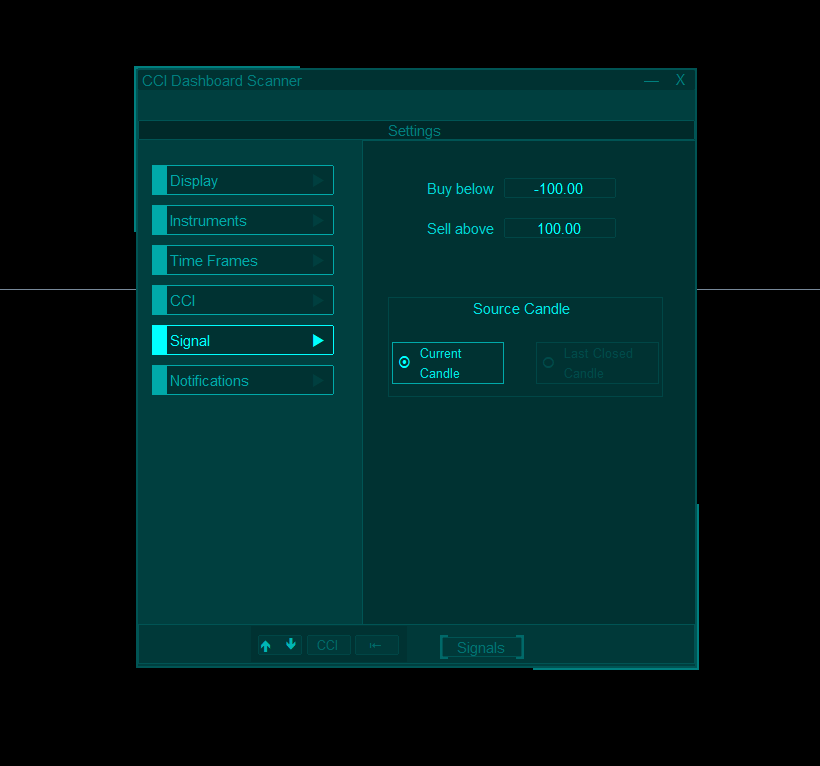
  • 簡単なCCI設定: CCIの設定(期間や適用価格)を調整し、買い/売りレベルを設定できます。現在のキャンドルまたは最近のクローズドキャンドルに基づいてスキャンするかを選択することも可能です。
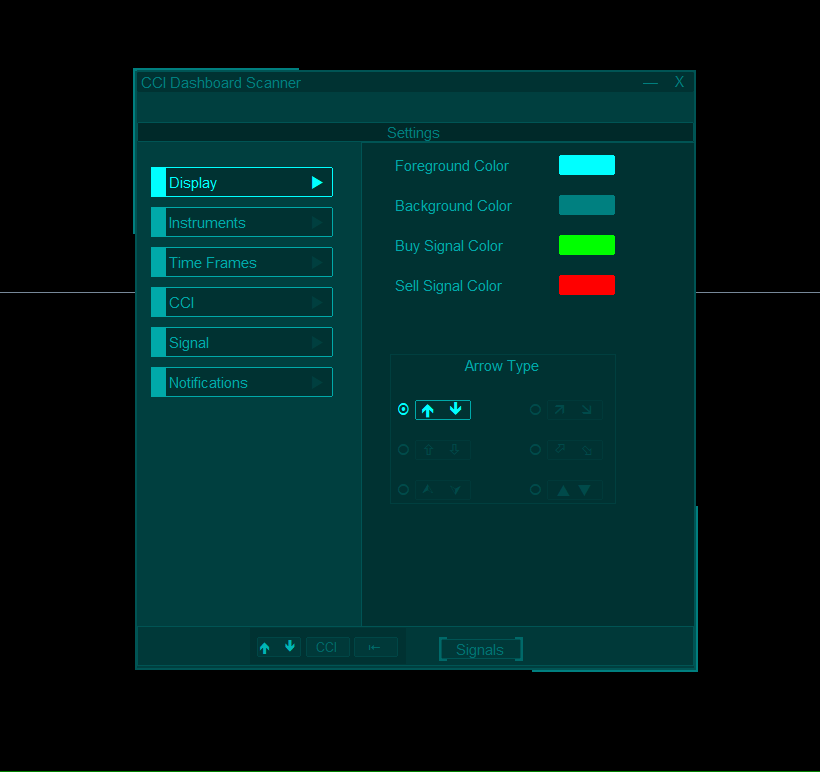
  • 色のカスタマイズ: ダッシュボードの主要な背景、前景、およびシグナル矢印の色を個別に設定できます。スキャナーは、見た目が整い、目に優しいようにすべてを調整します。
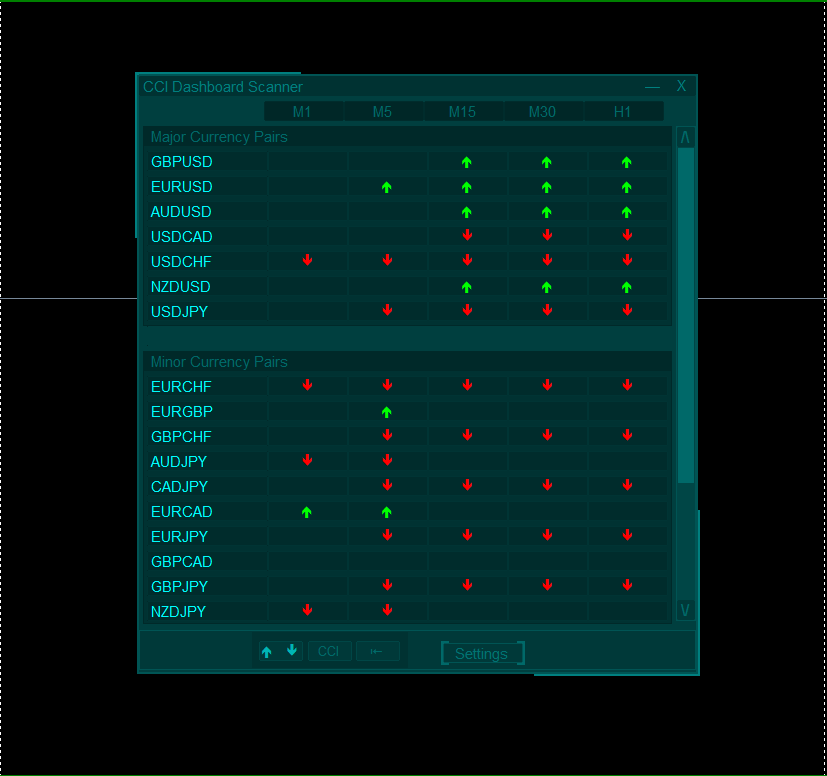
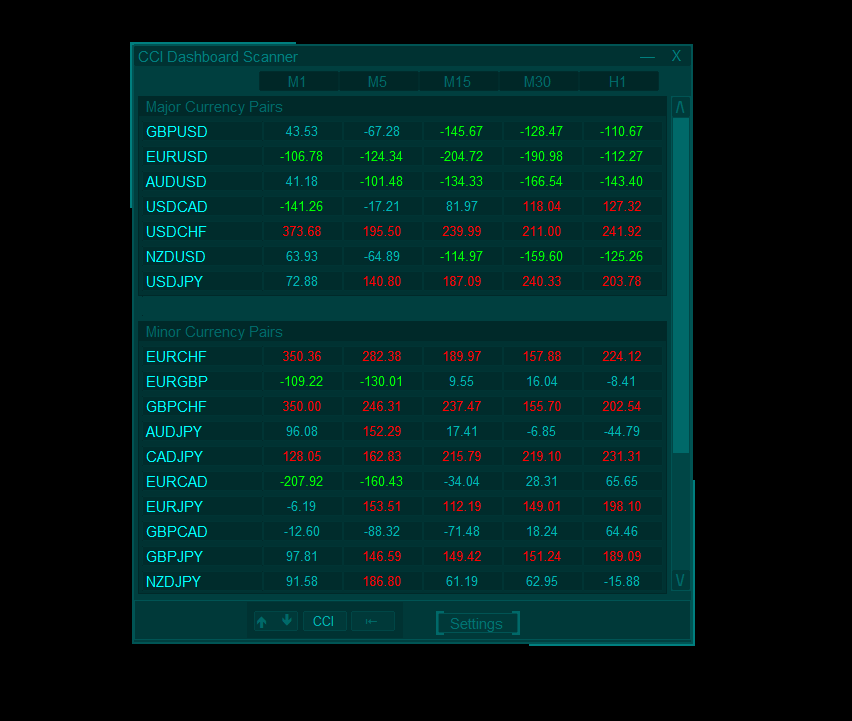
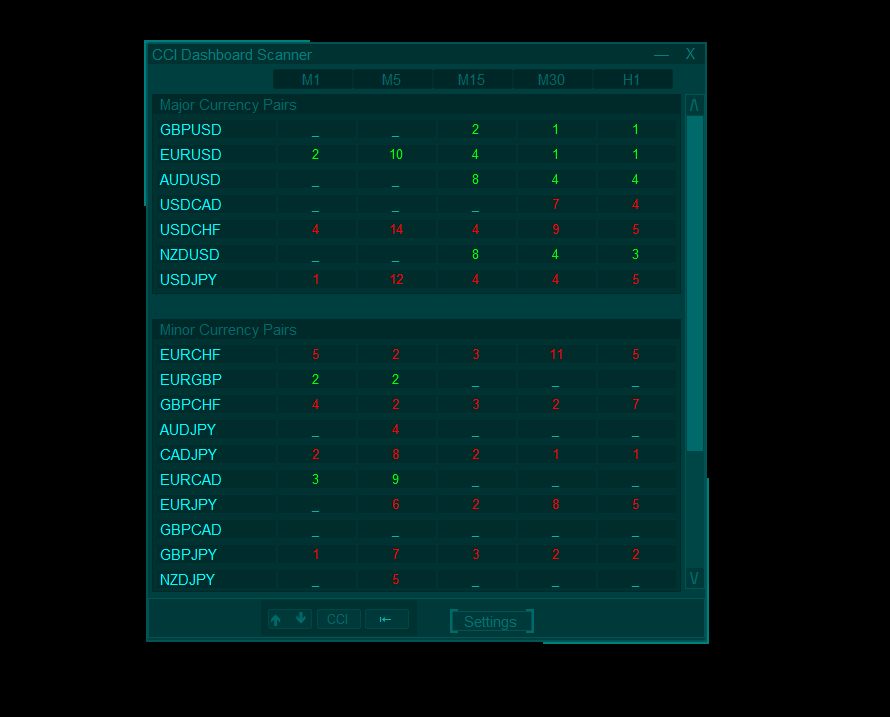
  • 柔軟なシグナル表示: ダッシュボードにCCI値、シグナルの年齢、または異なるデザインの方向矢印を表示するかを選択できます。
  • チャート切り替えウィンドウ: インスツルメントと時間枠をクリックすると、チャート切り替えウィンドウが開き、現在のチャートを切り替えたり、新しいチャートを開いたりできます。
  • ダッシュボードの配置: ダッシュボードはチャート上の任意の位置にドラッグでき、チャートの整理が柔軟に行えます。また、チャート上のスペースを広くしたいときには最小化も可能です。


📌 スキャナーがお役に立った場合、簡単な評価やコメントをいただけると大変ありがたいです!もし他のインディケーター用に似たようなスキャナーが必要であれば、気軽にご連絡ください。喜んでお手伝いさせていただきます❤️


おすすめのプロダクト
Bitcoin 999
Ahmed Ragab Ramadan Abdelfattah
Bitcoin 999  - is a trend indicator that automatically analyzes the market and provides information about the trend and each of its changes, as well as giving signals for entering trades without redrawing! The indicator uses each candle, analyzing them separately. referring to different impulses - up or down impulse. Exact entry points into transactions for currencies, crypto, metals, stocks, indices!  Main functions: Accurate entry signals WITHOUT REPAINTING! Once a signal appears, it remains
FREE
IMA Finder MT4
Mubashir Mohamed Quraish Albarakat
This indicator is designed based on the Moving Origin indicator When the moving origin indicator breaks the price, this indicator gives a signal It is useful for better viewing of signals and analysis on them Attributes: Can be used in all symbols Can be used in all time frames Too many signals Simple and quick settings Easy way to work Settings: period: like moving average settings alarmShow: If you want to receive an alert in Metatrader after receiving the signal, enable this setting alarmS
FREE
Stoch RSI MT4を紹介します。これは、Stochasticオシレーターの強みと相対力指数(RSI)を組み合わせて、あなたのトレーディング戦略を向上させるために設計された革新的なトレーディングインジケーターです。初心者と経験豊富なトレーダーの両方に最適で、このツールは市場のモメンタムとトレンドの反転に関する重要な洞察を提供します。 Stoch RSI MT4を使用することで、最適なエントリーおよびエグジットポイントを特定し、十分な情報に基づいたトレーディング決定を行うことができます。このインジケーターは、トレードのタイミングに対するユニークなアプローチを提供し、ユーザーが潜在的な市場の変動を利用し、利益を最大化できるようにします。 MQL製品のインストールガイド | MT4/MT5で購入したMQL製品の更新 | 一般的なトラブルシューティングガイド | インジケーター設定 / ガイド 主な機能 シグナル生成: StochasticオシレーターとRSIを利用して市場状況とモメンタムの変化を測定します。 BUY/SELLシグナル: 市場状況が売られ過ぎのレベルを示すときに買いシグナ
FREE
Donchian channels are a tool in technical analysis used to determine the relative volatility of a market and the potential for price breakouts. Can help identify potential breakouts and reversals in price, which are the moments when traders are called on to make strategic decisions. These strategies can help you capitalize on price trends while having pre-defined entry and exit points to secure gains or limit losses. Using the Donchian channel can thus be part of a disciplined approach to managi
FREE
Smart RSI MT4
Mostafa Saad Saeed Shawara
製品名 Smart RSI (MT4) – SmartView シリーズ 短い説明 MetaTrader プラットフォームで独特なユーザー体験を提供する RSI インジケーター。以前は利用できなかった高度な機能を提供し、ダブルクリックで設定を開く、削除せずにインジケーターを非表示/表示する、インジケーターウィンドウをチャート全体のサイズで表示するなどの機能を備えています。SmartView Indicators シリーズの残りの部分とシームレスに連携するように設計されています。 概要 SmartView シリーズは、革新的な機能を通じて MetaTrader プラットフォーム上のインジケーターに独特で特徴的なユーザー体験を提供し、インジケーター管理をより速く、より簡単にします。各インジケーターには、チャート上のスマートコントロールパネルが装備されており、基本情報を表示し、すべての重要な機能への迅速なアクセスを提供します。 以前は利用できなかった独自の機能 SmartView シリーズは、インジケーターでの作業をより簡単で迅速にする高度な機能を提供します: ダブルクリックで設定を開く:
FREE
Lisek Stochastic
Darius Hans Lischka
2.83 (6)
Lisek Stochastic   oscillator indicator with Alarm, Push Notifications and e-mail  Notifications. The Stochastic indicator is a momentum indicator that shows you how strong or weak the current trend is. It helps you identify overbought and oversold market conditions within a trend. The Stochastic indicator is lagging indicator, which means it don't predict where price is going, it is only providing data on where price has been !!! How to trade with Stochastic indicator: Trend following: As long
FREE
Discover the power of precision and efficiency in your trading with the " Super Auto Fibonacci " MT4 indicator. This cutting-edge tool is meticulously designed to enhance your technical analysis, providing you with invaluable insights to make informed trading decisions. Key Features: Automated Fibonacci Analysis: Say goodbye to the hassle of manual Fibonacci retracement and extension drawing. "Super Auto Fibonacci" instantly identifies and plots Fibonacci levels on your MT4 chart, saving you tim
FREE
The indicator displays signals according to the strategy of Bill Williams on the chart. Demo version of the indicator has the same features as the paid, except that it can work only on a demo account . Signal "First Wise Man" is formed when there is a divergent bar with angulation.  Bullish divergent bar - with lower minimum and closing price in the upper half. Bearish divergent bar - higher maximum and the closing price at the bottom half. Angulation is formed when all three lines of Alligator
FREE
TSO Stochastic RSI
Dionisis Nikolopoulos
4.25 (4)
Stochastic RSI makes a stochastic calculation on the RSI indicator. The Relative Strength Index (RSI) is a well known momentum oscillator that measures the speed and change of price movements, developed by J. Welles Wilder. Features Find overbought and oversold situations. Sound alert when overbought/oversold level is reached. Get email and/or push notification alerts when a signal is detected. The indicator is non-repainting. Returns buffer values for %K and %D to be used as part of an EA . (s
FREE
Introducing Force Jurik—a powerful indicator designed to enhance trading insights by combining custom moving averages based on Jurik with the MetaTrader 4 indicator, Force Index. Jurik moving averages are renowned for their precision and smoothness, making them ideal for analyzing price movements in the forex market. They offer traders a reliable method of identifying trends and filtering out market noise, ultimately providing clearer signals for decision-making. The Force Index, a popular Me
FREE
Follow The Line
Oliver Gideon Amofa Appiah
3.94 (16)
FOLLOW THE LINE GET THE FULL VERSION HERE: https://www.mql5.com/en/market/product/36024 This indicator obeys the popular maxim that: "THE TREND IS YOUR FRIEND" It paints a GREEN line for BUY and also paints a RED line for SELL.  It gives alarms and alerts of all kinds. IT DOES NOT REPAINT and can be used for all currency pairs and timeframes. Yes, as easy and simple as that. Even a newbie can use it to make great and reliable trades. NB: For best results, get my other premium indicators for more
FREE
Market Shift and FVG
Cruz Molina William Alberto
5 (2)
MT4用 マーケットストラクチャーシフトとフェアバリューギャップ (FVG) インジケーター このMT4インジケーターは、市場構造の変化とフェアバリューギャップ(FVG)を特定し、トレーダーに潜在的な取引機会を提供します。モバイル通知を通じてこれらのイベントをユーザーに警告し、変化する市場状況に迅速に対応できるようにします。 主な特徴: 市場構造シフトの検出: スイング高値/安値のブレイクと、平均と比較して значительный なキャンドル本体サイズに基づいて、強気と弱気の市場構造シフトを識別します。チャート上の上/下矢印で視覚化されます。 フェアバリューギャップ (FVG) の識別: 過去3本のキャンドルの価格アクションに基づいて、強気と弱気のFVGを検出します。 FVGはチャート上で色付きの長方形で強調表示されます。 モバイル通知: マーケットストラクチャーシフトとFVG形成の両方に関するリアルタイムのモバイル通知を受信し、潜在的な取引設定を見逃さないようにします。 カスタマイズ可能なパラメータ: ルックバック期間 (Lookback Period): スイング高値/安値計
FREE
This indicator finds Three Drives patterns. The Three Drives pattern is a 6-point reversal pattern characterised by a series of higher highs or lower lows that complete at a 127% or 161.8% Fibonacci extension. It signals that the market is exhausted and a reversal can happen. [ Installation Guide | Update Guide | Troubleshooting | FAQ | All Products  |  Get Help ] Customizable pattern sizes Customizable colors and sizes Customizable breakout periods Customizable 1-2-3 and 0-A-B ratios It impl
FREE
The product   Divergence Cci Force Stddev Ac Atr   is designed to find the differences between indicators and price. It allows you to open orders or set trends using these differences. The indicator has 4 different divergence features. Divergence types Class A Divergence Class B Divergence Class C Divergence Hidden Divergence Product Features and Rec ommendations There are 5 indicators on the indicator Indicators =   CCI, Force, Stdandard Deviation, Acelereator, Atr 4 different divergence type
FREE
TrendBite v1.5 - プロフェッショナルトレンド追跡インジケーター 開発者: 8aLt4 バージョン: 1.5 プラットフォーム: MetaTrader 4  概要 TrendBite v1.5 は、市場のトレンドの変化を検知し、投資家に明確な売買シグナルを提供するために設計された、高度なテクニカル分析インジケーターです。ボリンジャーバンドのアルゴリズムに基づいて、トレンドの転換を正確に捉えるこのツールは、初心者にも経験豊富なトレーダーにも最適です。  主な機能  トレンドの検知 自動トレンド分析:市場の上昇トレンドと下降トレンドを瞬時に検出 ボリンジャーバンドベース:信頼性の高い数学的モデルに基づく計算システム 視覚的な明瞭さ:緑(上昇)と黄色(下降)のヒストグラムバーでトレンド状況を明確に表示  売買シグナル 緑色の矢印(↑):買い機会を示します 赤色の矢印(↓):売り機会を示します 明確な視覚化:トレンドラインにより、ポジションの方向を簡単に追跡できます ヒストグラム表示:トレンドの強さを視覚的に評価可能  警告システム 音声警告:新しいシグナルが発生すると自動
FREE
PZ Penta O MT4
PZ TRADING SLU
2.33 (3)
The Penta-O is a 6-point retracement harmonacci pattern which usually precedes big market movements. Penta-O patterns can expand and repaint quite a bit. To make things easier this indicator implements a twist: it waits for a donchian breakout in the right direction before signaling the trade. The end result is an otherwise repainting indicator with a very reliable trading signal. The donchian breakout period is entered as an input. [ Installation Guide | Update Guide | Troubleshooting | FAQ | A
FREE
THIS FREE INDICATOR ALLOWS YOU TO SET THE TIMEFRAME OF THE MA YOU WANT ON YOUR CHART For example, it's very useful if you want to trade the H4 200 SMA using a lower timeframe chart, to identify price reactions such as reversals, Wyckoff schematics, etc. ***Please comment, rate and share it to your friends if you like it*** ------------------------------------------------------------------------- Moving averages are popular technical indicators used to identify trends, support and resistance leve
FREE
Basic Harmonic Pattern
Mehran Sepah Mansoor
4.58 (59)
このインディケータは、相場の反転ポイントを予測する最もポピュラーなハーモニックパターンを識別します。これらのハーモニックパターンは、外国為替市場で常に繰り返され ている価格形成であり、将来起こりうる値動きを示唆します。/   MT5無料バージョン さらに、このインジケーターには、市場エントリーシグナルと、様々な利食いと損切りが組み込まれています。ハーモニック・パターン・インディケータは、それ自体で売買シグナルを発 信することができますが、他のテクニカル・インディケータを使用してこれらの シグナルを確認することをお勧めします。例えば、RSIやMACDなどのオシレーターを使用して、トレンドの方向性やモメンタ ムの強さを確認してから売買を行うことを検討するとよいでしょう。 このインディケータのダッシュボードスキャナ: ( Basic Harmonic Patterns Dashboard ) 含まれるハーモニックパターン ガートレー バタフライ バット カニ サメ サイファー ABCD 主な入力 Max allowed deviation (%): このパラメータは、調和的パタ
FREE
What is Squeeze Momentum? Squeeze Momentum is an innovative technical analysis indicator popularized by John Carter in "Mastering the Trade" that detects compression periods in markets. This indicator analyzes volatility changes using a combination of Bollinger Bands and Keltner Channel. What Does It Do? Squeeze Detection : Identifies periods when Bollinger Bands move inside the Keltner Channel Momentum Measurement : Shows momentum changes through linear regression calculations Color-Coded Signa
FREE
MACD indicator in MetaTrader 4/5 looks different than MACD does in most other charting software. That is because the MetaTrader 4/5 version of MACD displays the MACD line as a histogram when it is traditionally displayed as a line. Additionally, the MetaTrader 4/5 version computes the Signal line using an SMA, while according to MACD definition it is supposed to be an EMA. The MetaTrader 4/5 version also does not compute a true MACD Histogram (the difference between the MACD/Signal lines). This
FREE
The presented indicator is the author's implementation of the Double Smoothed Stochastic oscillator developed by William Blau and Walter Bressert. The calculation of values ​​is in many ways similar to the calculation of the classic stochastic oscillator. The indicator takes into account the location of the current price relative to local highs/lows. The indicator gives signals about changing its direction and/or about entering/exiting the overbought/oversold zone. The signal is given after the
The MACD (Moving Average Convergence Divergence) indicator is one of the most widely used technical analysis tools by traders worldwide. Created by Gerald Appel in the 1970s, the MACD is an indicator that helps investors identify the trend direction, trend strength, and possible trend reversal points. The MACD indicator is composed of a histogram that shows the difference between the 12-period exponential moving average and the 26-period exponential moving average. The top part of the histogram
FREE
Free automatic Fibonacci is an indicator that automatically plots a Fibonacci retracement based on the number of bars you select on the BarsToScan setting in the indicator. The Fibonacci is automatically updated in real time as new highest and lowest values appears amongst the selected bars. You can select which level values to be displayed in the indicator settings. You can also select the color of the levels thus enabling the trader to be able to attach the indicator several times with differe
FREE
For those who like trend the Force will be a very useful indicator. This is because it is based on the famouse ADX, which measure the strenght of a trend, but without its 3 confusing lines. Force has its very simple interpretation: if the histogram is above zero level the trend is up, otherwise it is down. You can use it to find divergences too, which is very profitable. If you have any doubt or suggestion, please, contact me. Enjoy! MT5 version:  https://www.mql5.com/en/market/product/41928 T
FREE
A simple but effective helper that will allow you to track both global and local market trends. The indicator combines the work of two oscillators: Stochastic and RSI. Both indicators can be set to any timeframe. Advantages of Use Multitimeframe - you can adjust both indicators to the desired timeframes. To obtain the entry points, you can use the Elder's triple screen system. Highly customizable - you can configure not only the parameters of the indicators, but also their appearance (color and
FREE
Free informative Indicator-helper. It'll be usefull for traders who trade many symbols or using grid systems (Averaging or Martingale). Indicator counts drawdown as percent and currency separate. It has a number of settings: Count deposite drawdown according equity value and send e-mail or notifications to user if DD more than set; Sending e-mail when max open orders reached; Shows price and remaining pips amount before MarginCall on current chart and Account generally; Display summary trade lot
FREE
Introducing the Professional Arka STM Signal Indicator With Arka Candle Close Time – 100% Free Version Fast, Accurate, and Unmatched in Identifying Trading Opportunities This indicator is the result of combining advanced price action analysis with specialized market algorithms, delivering clear, timely, and profitable signals. Completely Free – No Installation or Usage Limits ️ An automated trading bot, fully synchronized with it, is also ready to run. The Power of ARKA   STM Si
FREE
Trend Reversal pro is a histogram type indicator that give long and short signals, the indicator can be traded on its own with following entry rules . Buy Rule, histogram gives green bar. Sell Rule, histogram gives red bar. This indicator doesn't repaint or back paint, this indicator signals are not delayed. -------------------------------------------------------
FREE
Auto Supply and Demand Oscillator is an indicator for MetaTrader 4 and MetaTrader 5 that detects supply and demand zones automatically and displays them as a single oscillator value at the bottom of the chart, instead of drawing rectangles directly on price. Concept Supply zones are price areas where strong selling created a sharp downward move away from a balance area. Demand zones are price areas where strong buying created a sharp upward move. Traditional implementations draw boxes on the
FREE
Check my paid tools they work great and I share Ea's based on them for free please r ate The Dual Timeframe RSI (Relative Strength Index) indicator is a novel trading tool that allows traders to monitor RSI readings from two different timeframes on a single chart. This dual perspective enables traders to identify potential trend confirmations and divergences more effectively. For instance, a trader might use a 1-hour RSI alongside a daily RSI to ensure that short-term trades align with the broa
FREE
このプロダクトを購入した人は以下も購入しています
Neuro Poseidon is a new indicator by Daria Rezueva. It combines precise trading signals with adaptive TP/SL levels - creating best possible trades as a result! Message me and get  Neuro Poseidon Assistant  as a gift to automize your trading process! What makes it stand out? 1. Proven profitability on all assets and timeframes 2. Only confirmed BUY and SELL signals present on the chart 3. Adaptive TP & SL levels generated by the software for each trade 4. Easy to understand - suitable for all
M1 SNIPER は使いやすいトレーディングインジケーターシステムです。M1時間足向けに設計された矢印インジケーターです。M1時間足でのスキャルピングのためのスタンドアロンシステムとして、また既存のトレーディングシステムの一部としても使用できます。このトレーディングシステムはM1時間足での取引に特化して設計されていますが、他の時間足でも使用できます。元々、この手法はXAUUSDとBTCUSDの取引用に設計しましたが、他の市場においても役立つと考えています。 インジケーターのシグナルは、トレンドの方向と逆方向に取引できます。インジケーターのシグナルを利用して両方向に取引するのに役立つ特別な取引テクニックをご紹介します。この手法は、特別な動的なサポートとレジスタンスの価格帯を利用することに基づいています。 ご購入後、M1 SNIPER矢印インジケーターをすぐにダウンロードできます。さらに、M1 SNIPERツールのすべてのユーザーに、以下のスクリーンショットに表示されているApollo Dynamic SRインジケーターを無料で提供しています。この2つのインジケーターを組み合わせることで
Gann Made Easy は、ミスター・ギャンの理論を使用した取引の最良の原則に基づいた、プロフェッショナルで使いやすい外国為替取引システムです。 W・D・ガン。このインジケーターは、ストップロスとテイクプロフィットレベルを含む正確な買いと売りのシグナルを提供します。 PUSH通知を利用して外出先でも取引可能です。 ご購入後、取引方法の説明と優れた追加インジケーターを無料で入手するには、私にご連絡ください! おそらく、ギャンの取引手法についてはすでに何度も聞いたことがあるでしょう。通常、ギャンの理論は初心者のトレーダーだけでなく、すでにある程度の取引経験がある人にとっても非常に複雑なものです。なぜなら、ギャンの取引手法は理論的にはそれほど簡単に適用できるものではないからです。私はその知識を磨き、最良の原則を私の外国為替インジケーターに組み込むために数年を費やしました。 このインジケーターは非常に簡単に適用できます。必要なのは、それをチャートに添付し、簡単な取引推奨事項に従うだけです。このインジケーターは常に市場分析の仕事を行い、取引の機会を探します。適切なエントリーポイントを検出す
Dynamic Forex28 Navigator - 次世代の Forex 取引ツール。 現在 49% オフ。 Dynamic Forex28 Navigator は、長年人気のインジケーターを進化させたもので、3 つの機能を 1 つにまとめています。 Advanced Currency Strength28 インジケーター (レビュー 695 件)  + Advanced Currency IMPULSE with ALERT (レビュー 520 件) + CS28 コンボ シグナル (ボーナス)。 インジケーターの詳細 https://www.mql5.com/en/blogs/post/758844 次世代の Strength インジケーターが提供するもの  オリジナルで気に入っていたすべての機能が、新機能と精度の向上によって強化されました。 主な機能: 独自の通貨強度計算式。 すべての時間枠でスムーズかつ正確な強度ライン。 トレンドの特定と正確なエントリーに最適です。 ダイナミックマーケットフィボナッチレベル (マーケットフィボナッチ)。 このインジケーターに固有
Scalper Inside PRO Scalper Inside PRO は、MetaTrader 4 向けの短期トレンドおよびスキャルピング用インジケーターです。独自アルゴリズムを用いて、市場の方向性と主要なターゲットレベルを素早く検出します。エントリー、イグジット、複数の利確ターゲットを自動計算し、詳細なパフォーマンス統計を表示することで、さまざまな銘柄やストラテジーがどのように機能してきたかを確認できます。これにより、現在のマーケットコンディションに最も適した取引銘柄を選択するのに役立ちます。さらに、Scalper Inside PRO には、お使いの矢印インジケーターを簡単に接続でき、その統計と過去のパフォーマンスを素早く評価できます。 本インジケーターは、あらゆる銘柄と時間足で動作し(短期トレードには M5 を推奨)、複数の内蔵ストラテジーを備えています。そのため、単体のスキャルピングツールとしても、トレーディングシステム内の強力な分析コンポーネントとしても活用できます。 主な機能 独自アルゴリズム(Next‑Generation Trend Detection Algor
Enigmera
Ivan Stefanov
5 (8)
ENIGMERA: 市場の中心 重要:MQL5.comのデモはStrategy Testerで実行されており、Enigmeraの機能を完全には反映していない場合があります。詳細については、説明、スクリーンショット、ビデオをご確認ください。質問があれば、遠慮なくメッセージを送ってください! インジケーターのコードは完全に書き直されました。バージョン3.0は新機能を追加し、インジケーターの開始以来蓄積されたバグを修正しました。 紹介 このインジケーターとトレーディングシステムは、金融市場への注目すべきアプローチです。ENIGMERAはフラクタルサイクルを使用して、サポートとレジスタンスのレベルを正確に計算します。真の蓄積フェーズを示し、方向と目標を提供します。トレンドでも修正でも機能するシステムです。 動作方法 インジケーターのほとんどの機能は、チャートの左側にあるボタンで制御され、市場の状況に迅速に対応できるようになっています。 ボタン ON/OFF – インジケーター全体を表示または非表示にします。 Channel – サポートチャネルを有効にし、許容範囲の偏差を示します。 Dev
多くの矢印インジケーターは、シグナルだけを表示して、その後の判断はすべてトレーダー任せです。KT Alpha Hunter Arrows は、最初から完成されたトレードプランを提供します。 各シグナル矢印が表示されると、エントリーライン、ストップロス、4つのテイクプロフィット水準、そして現在の銘柄と時間足を今トレードする価値があるかを示すリアルタイムのエッジ判定が、チャート上にまとめて描画されます。付属の Trade Manager EA は、手動でエントリーした後の管理をサポートし、相場が荒れて感情が揺れやすい場面でも、トレードの規律を保ちやすくします。リペイントなし。確定足のみでシグナルを表示。Forex、ゴールド、指数、その他あなたが取引するあらゆる銘柄向けに設計されています。 主な機能 リペイントしない買い・売り矢印。シグナルは足が確定した後にのみ表示されます。 各シグナルにエントリーライン、構造的なストップロス、4つのテイクプロフィット水準を表示。 Edge Dashboard が、現在のチャート上で買いと売りのセットアップを個別に評価。 判定システム:No Edge、Ma
Trend Catcher ind
Ramil Minniakhmetov
5 (2)
トレンドキャッチャーインジケーター トレンドキャッチャーインジケーターは、開発者独自の適応型トレンド分析指標を組み合わせることで、市場価格の動きを分析します。短期的なノイズを除去し、根底にあるモメンタムの強さ、ボラティリティの拡大、価格構造の挙動に焦点を当てることで、真の市場方向性を特定します。また、移動平均線、RSI、ボラティリティフィルターなどの平滑化およびトレンドフィルタリング機能を備えたカスタマイズ指標も使用します。 実際の運用状況のモニタリングやその他の製品については、こちらをご覧ください: https://www.mql5.com/en/users/mechanic/seller ご注意ください。私はTelegramでEAや設定を販売していません。詐欺です。すべての設定はブログで無料で公開しています。 重要!ご購入後すぐにご連絡ください。手順とボーナスをお送りします!
PRO Renko Systemは、特別にRENKOチャートを取引するために設計された高精度の取引システムです。 これは、様々な取引商品に適用することができる普遍的なシステムです。 システムは効果的に正確な逆転信号へのアクセスを与えるいわゆる市場の騒音を中和する。 表示器は非常に使いやすく、信号の生成に責任がある1つの変数だけがあります。 あなたは簡単にお好みの任意の取引ツールとレンコバーのサイズにツールを適応させることができます。 私はいつもあなたが私のソフトウェアで収益性の高い取引を支援するために余分なサポートを提供する準備ができています! 私はあなたに幸せで収益性の高い取引をしたいです! ご購入後にご連絡ください! 私はあなたに私のレンコチャートジェネレータを送信します。 私はまた、私の個人的な推奨事項やシステムの他のモジュールを無料で共有します!
トレンドラインプロ   市場の真の方向転換点を理解するのに役立ちます。この指標は、真のトレンド反転と主要プレーヤーが再び参入するポイントを示します。 分かりますか     BOSライン   複雑な設定や不要なノイズなしに、より長い時間足でのトレンドの変化と重要なレベルを把握できます。シグナルは再描画されず、バーが閉じた後もチャート上に残ります。 VERSION MT 5     -     RFI LEVELS PRO インジケーター と組み合わせることで、その潜在能力を最大限に発揮します。 インジケーターが示す内容: 本当の変化   トレンド(BOSライン) 一度シグナルが現れたら、それは有効です!これは、リペイント機能を持つインジケーターとの重要な違いです。リペイント機能を持つインジケーターは、シグナルを発した後、それを変更し、資金の損失につながる可能性があります。これにより、より高い確率と精度で市場に参入できます。また、矢印が現れた後、目標値(利益確定)に達するか、反転シグナルが現れるまで、ローソク足の色を変更する機能もあります。 繰り返しエントリ       主要プレーヤーの
Genesis Matrix Pro is a professional multi-timeframe trend detection indicator designed to help traders identify high-quality market alignment with clarity and structure. It combines 12 different technical indicators into one visual alignment matrix, allowing traders to quickly see when market conditions are bullish, bearish, or neutral. A signal is generated only when the selected strategies are aligned, helping reduce noise and improve decision-making. PLEASE CONTACT ME AFTER PURCHASE TO GET
この製品は 2026 年の市場向けに更新され、最新の MT5 ビルドに最適化されています。 価格更新のお知らせ: Smart Trend Trading System は現在 $99 で提供されています。 次の 30 件の購入 後、価格は $199 に上がります。 特別オファー: Smart Trend Trading System を購入後、私にプライベートメッセージを送ることで、 Smart Universal EA を無料 で受け取り、Smart Trend のシグナルを自動売買に変えることができます。 Smart Trend Trading System は、リペイントなし、再描画なし、遅延なしの完全なトレーディングシステムです。よりクリーンなシグナル、より明確なトレンド方向、そしてより整理された取引方法を求めるトレーダー向けに作られています。 Online course , manual and download presets . このシステムは、トレンド検出、反転ゾーン、Smart Cloud、トレーリングストップロジック、サポートとレジスタンス、ローソク足の色分け、ア
トレンドトレーディング は、タイミングのプルバックとブレイクアウトにより、市場で起こっているトレンドから可能な限り利益を得るように設計された指標です。確立されたトレンドの中で価格が何をしているかを分析することにより、取引の機会を見つけます。 [ インストールガイド | 更新ガイド | トラブルシューティング | よくある質問 | すべての製品 ] 自信を持って効率的に金融市場を取引する むち打ちにならずに確立されたトレンドから利益を得る 収益性の高いプルバック、ブレイクアウト、早期の逆転を認識する この指標は、独自の品質とパフォーマンスを分析します 複数時間枠のダッシュボードを実装します インジケーターは再描画されていません 電子メール/音声/視覚アラートを実装します 確立されたトレンドは多くの取引機会を提供しますが、ほとんどのトレンド指標はそれらを完全に無視しています。インジケーターの解釈はかなり簡単です: (1) トレンドの変化 (2) トレンドの方向への後退 (3) トレンドの方向へのブレイクアウト 赤いダッシュ は下降トレンド中の修正です 青いダッシュ は上昇トレンド中
Step into the world of Forex trading with confidence, clarity, and precision using   Gold Indicator   a next-generation tool engineered to take your trading performance to the next level. Whether you’re a seasoned professional or just beginning your journey in the currency markets, Gold Indicator equips you with powerful insights and help you trade smarter, not harder. Built on the proven synergy of three advanced indicators, Gold Indicator focuses exclusively on medium and long-term trends eli
スイングトレーディング は、トレンドの方向のスイングと可能な反転スイングを検出するように設計された最初のインジケーターです。トレーディングの文献で広く説明されているベースラインスイングトレーディングアプローチを使用します。インディケータは、いくつかの価格と時間のベクトルを調査して、全体的なトレンドの方向を追跡し、市場が売られ過ぎまたは買われ過ぎて修正の準備ができている状況を検出します。 [ インストールガイド | 更新ガイド | トラブルシューティング | よくある質問 | すべての製品 ] むち打ちを起こさずに市場スイングの利益 インジケーターは常にトレンドの方向を表示します 色付きの価格帯は機会のベースラインを表します 色付きのダッシュは、可能な反転スイングを表します この指標は、独自の品質とパフォーマンスを分析します 複数時間枠のダッシュボードを実装します カスタマイズ可能なトレンドおよびスイング期間 電子メール/サウンド/プッシュアラートを実装します インジケータは再描画またはバックペインティングではありません Swing Tradingとは Swing Tradingは
Current event:  https://c.mql5.com/1/326/A2SR2025_NoMusic.gif A. A2SR とは何ですか ?   * 先行テクニカル指標です (塗り直しなし、ラグなし)。 -- ガイダンス : -- https://www.mql5.com/en/blogs/post/734748/page4#comment_16532516 -- そして https://www.mql5.com/en/users/yohana/blog A2SR には、サポート (需要) とレジスタンス (供給) のレベルを決定する特別な手法があります。 ネットで見かける通常の方法とは異なり、A2SR は実際の SR レベルを決定する独自のコンセプトを持っています。 元の手法はインターネットから取得されたものではなく、インターネット上で公開されたこともありません。 A2SR は、取引スタイルに応じて SR レベルを自動選択します。 時間枠を変更しても、SR レベルはその位置にとどまります。 実際のSRは、使用する時間枠から取得されるわけではないため. A2SR
BTMM State Engine Pro is a MetaTrader 4 indicator for traders who use the Beat The Market Maker approach: Asian session context, kill zone timing, level progression, peak formation detection, and a multi-pair scanner from a single chart. It combines cycle state logic with a built-in scanner dashboard so you do not need the same tool on many charts at once. What it does Draws the Asian session range; session times can follow broker server offset or be set in inputs. Tracks level progression (L
「 Dynamic Scalper System 」インジケーターは、トレンド波の中でスキャルピング取引を行う手法のために設計されています。 主要通貨ペアと金でテスト済みで、他の取引商品との互換性があります。 トレンドに沿った短期的なポジションオープンのシグナルを提供し、追加の価格変動サポートも提供します。 インジケーターの原理 大きな矢印はトレンドの方向を決定します。 トレンド波の中では、小さな矢印の形でスキャルピングシグナルを生成するアルゴリズムが機能します。 赤い矢印は強気方向、青い矢印は弱気方向です。 トレンドの方向には敏感な価格変動ラインが描かれ、小さな矢印のシグナルと連動します。 シグナルは次のように機能します。適切なタイミングでラインが現れるとエントリーシグナルが形成され、ラインが開いている間はポジションが保持され、完了すると取引が終了します。 推奨される動作時間枠はM1~H4です。 矢印は現在のローソク足に形成され、次のローソク足が開いている場合は、前のローソク足の矢印は再描画されません。 入力パラメータ Trend Wave Period - トレンド方向
Price & Time Market Structure Indicator A professional market structure tool that analyzes waves through both price and time — not price alone. Main Description NeoWave PRO is a professional market structure indicator for MetaTrader 4 designed for traders who want to move beyond traditional one-dimensional wave tools such as ZigZag, swing indicators, and basic high/low systems. Most wave indicators analyze only one thing: Price. But a real market wave is not only a price movement. A true wave de
MonsterDash Harmonic Indicator is a harmonic pattern dashboard. It recognizes all major patterns. MonsterDash is a dashboard that displays all detected patterns for all symbols and (almost) all timeframes in sortable and scrollable format. Users can add their own user defined patterns . MonsterDash can open and update charts with the pattern found. Settings MonsterDash's default settings are good enough most of the time. Feel free to fine tune them to your needs. The color settings are for thos
Apollo SR Master は、サポート/レジスタンスゾーンを利用した取引をより容易かつ確実にする特別な機能を備えたサポート/レジスタンスインジケーターです。このインジケーターは、ローカル価格の高値と安値を検出することで、タイムラグなしでリアルタイムにサポート/レジスタンスゾーンを計算します。そして、新たに形成されたSRゾーンを確認するために、インジケーターは特別なシグナルを表示します。このシグナルは、SRゾーンを実際の売りまたは買いシグナルとして考慮して使用できることを示します。この場合、SRゾーンの強度が高まり、SRエリアからの取引が成功する確率も高まります。これがこのインジケーターの基本的な考え方です。 SRゾーンは、ストップロスとテイクプロフィットの設定を容易にします。シグナルの方向に応じて、SRゾーンの上または下のスペースをストップロスとして設定できます。さらに、反対側のSRゾーンは、潜在的なテイクプロフィットエリアとして設定できます。 また、Apollo SRマスターインジケーターをご利用のすべてのユーザーには、「Apollo Price Action System」
現在40%オフ 初心者やエキスパートトレーダーに最適なソリューション! このインジケーターは、独自の機能と新しい計算式を取り入れた、ユニークで高品質、かつ手頃な価格のトレーディングツールです。たった1枚のチャートで28の為替ペアの通貨強度を読み取ることができます。新しいトレンドやスキャルピングチャンスの引き金となるポイントを正確に特定することができるので、あなたのトレードがどのように改善されるか想像してみてください。 ユーザーマニュアルはこちら  https://www.mql5.com/en/blogs/post/697384 これが最初の1本、オリジナルだ! 価値のないクローンを買わないでください。 特別な サブウィンドウの矢印で強い通貨の勢いを表示 GAPがあなたのトレードを導く! 基準通貨や気配値が売られすぎ・買われすぎのゾーン(外相フィボナッチレベル)にあるとき、個別チャートのメインウィンドウに警告表示。 通貨がレンジの外側から反落した場合、プルバック/リバーサルのアラート。 クロスパターンの特別なアラート 複数の時間枠を選択可能で、トレンドを素早く確認できます
Auto Optimized Parabolic RSI: 高度な3Dモメンタムエンジン ほとんどのリテール向けインジケーターは、市場のボラティリティが変化した瞬間に破綻する静的な入力値に依存しているため、失敗に終わります。Auto Optimized Parabolic RSIは、自らの数学的優位性を継続的に再計算することで「インジケーターの陳腐化」問題を解決し、機関投資家レベルの定量的適応力をMT5ターミナルに直接もたらします。 最大の強み: カスタムインメモリ3D最適化   標準的な自動最適化ツールは、インジケーターの呼び出しで端末に過負荷をかけるため、頻繁にMT5プラットフォームをフリーズさせます。本ツールは、このボトルネックを完全に回避しています。RAMベースのカスタムネイティブ計算機を内蔵した内部エンジンは、チャートを読み込んだりタイムフレームを変更したりするたびに、超高速の3Dグリッド探索を実行します。RSI期間(頻度)、SARステップ(加速度)、SAR最大値(制限速度)を同時にスイープし、プラットフォームを遅延させることなく、数万通りものパラメーターの組み合わせを絶対的
Advanced Supply Demand
Bernhard Schweigert
4.91 (300)
現在40%オフ 初心者にもエキスパートトレーダーにも最適なソリューション このインジケーターは独自の機能と新しい公式を多数内蔵しており、ユニークで高品質かつ手頃な取引ツールです。このアップデートでは、2つの時間枠ゾーンを表示できるようになります。より長いTFだけでなく、チャートTFとより長いTF(ネストゾーンを表示)の両方を表示できます。すべてのSupply Demandトレーダーの皆さんのお気に召すはずです。:) 重要情報の公開 Advanced Supply Demandの可能性を最大化するには、 https://www.mql5.com/ja/blogs/post/720245 にアクセスしてください。   エントリーまたはターゲットの正確なトリガーポイントを正確に特定できれば取引がどのように改善されるか想像してみてください。新しい基盤となるアルゴリズムに基づいて構築されているため、買い手と売り手の間の潜在的な不均衡をさらに簡単に特定できます。これは、最も強い需要と供給のゾーンと、過去のパフォーマンス(古いゾーンを表示)がグラフィカルに表現されるためです。これらの機能は、最適な
このインジケーターは、エリオット波動理論と組み合わせて作動し、2つの方法で使用されます: 自動モード: このモードでは、インジケーターがチャート上の全ての5つのモーティブ波を自動的に検出し、予測とポテンシャルな逆転ゾーンを提供します。また、アラートやプッシュメッセージを生成する能力も備えています。この自動機能により、エリオット波動パターンの識別と分析のプロセスが効率化されます。 手動モード: このオプションは、エリオット波動理論を手動で扱いたいトレーダー向けです。9つの段階を使用して波を描画することができます。各段階は、表示された後に描画されたラインを調整して個別に定義できます。この機能により、手動で波を描画するプロセスがより効率的になります。重要な点として、すべての描画データが将来の参照のためにプラットフォームのデータフォルダに保存されることに注意してください。 パラメータ: Name: インジケーターの名前。 Use_System_Visuals: インジケーターのテーマを有効または無効にして、取引プラットフォーム全体の外観に合わせます。 Explain_Comment: 波の番号
Introduction to Fractal Pattern Scanner Fractal Indicator refers to the technical indicator that makes use of the fractal geometry found in the financial market. Fractal Pattern Scanner is the advanced Fractal Indicator that brings the latest trading technology after the extensive research and development work in the fractal geometry in the financial market. The most important feature in Fractal Pattern Scanner is the ability to measure the turning point probability as well as the trend probabi
Send us a message after your purchase to receive more information on how to get your  BONUS  for FREE  that works in great combination with Bull vs Bear ! Bull versus Bear is an easy-to-use Forex indicator that gives traders clear and accurate signals based on clear trend retests . Forget about lagging indicators or staring at charts for hours because  Bull vs Bear provides real-time entries with no lag and no repaint, so you can trade with confidence. Bull vs Bear  helps you enter trades during
Scalper Vault は、スキャルピングを成功させるために必要なすべてを提供するプロフェッショナルなスキャルピング システムです。このインジケーターは、外国為替およびバイナリー オプションのトレーダーが使用できる完全な取引システムです。推奨される時間枠は M5 です。 システムは、トレンドの方向に正確な矢印シグナルを提供します。また、トップとボトムのシグナルとギャン マーケット レベルも提供します。 インジケーターは、プッシュ通知を含むすべてのタイプのアラートを提供します。 インジケータの購入後にご連絡ください。私の個人的な取引の推奨事項と素晴らしいボーナス指標を無料で共有します! 幸せで有益な取引をお祈りします!
The Propfolio Master Suite is the ultimate all-in-one analytical workstation for professional traders. Combining the power of the Beat The Market Maker (BTMM) methodology, Smart Money Concepts (SND/Liquidity), and Advanced Volume Profile, this suite replaces multiple different indicators with one optimized engine. Monitor up to 14 pairs simultaneously from a single chart, instantly identify market cycles, and seamlessly map institutional footprints with the click of a button. The Command Center
Introduction Harmonic Patterns are best used to predict potential turning point. Traditionally, Harmonic Pattern was identified manually connecting peaks and troughs points in the chart. Manual harmonic pattern detection is painfully tedious and not suitable for everyone. You are often exposed under subjective pattern identification with manual pattern detection. To avoid these limitations, Harmonic Pattern Plus was designed to automate your harmonic pattern detection process. The functionality
作者のその他のプロダクト
ATR Bands Indicator
Teddy Mutugi Mworia Teddy Mutugi Mworia
5 (3)
In many strategies, it's quite common to use a scaled ATR to help define a stop-loss, and it's not uncommon to use it for take-profit targets as well. While it's possible to use the built-in ATR indicator and manually calculate the offset value, it's not particularly intuitive or efficient, and has the potential for miscalculations.  Features Configurable ATR offset Upper and Lower Band. configurable ATR scaling factor alternate(non-chart) ATR timeframe explicitly defined input types to improv
FREE
Color Gradient Background
Teddy Mutugi Mworia Teddy Mutugi Mworia
このインジケーターは、2つのカスタマイズ可能な色の間で滑らかな遷移を適用することで、チャートの外観を変えることができます。この目を引くグラデーション効果により、チャートは新鮮でモダンな印象を与え、視覚的に魅力的になります。 インジケーターがチャートに添付されると、現在のチャート上にあるすべてのインジケーターウィンドウにグラデーションが適用され、その後追加される新しいインジケーターウィンドウにも影響を与えます。 ぜひ試してみて、あなたのチャートの外観をリフレッシュしてください!視覚的に改善されたチャートは、取引の際の体験を向上させ、より良い判断を下す助けになります。新しい外観のチャートで取引を楽しんでください!
FREE
MT5 CCI Dashboard Scanner
Teddy Mutugi Mworia Teddy Mutugi Mworia
MT5 CCIダッシュボードスキャナー MT5 CCIダッシュボードスキャナーは、異なる時間枠とインストゥルメントにわたってコモディティ・チャネル・インデックス(CCI)レベルを追跡し、新しい信号が検出されたときにリアルタイムアラートを提供するツールです。ユーザーフレンドリーで、コンピュータの計算リソースに優しく、どんなコンピュータでもスムーズに動作します。 主な機能 自動インストゥルメントグルーピング : スキャナーは、マーケットウォッチリストからすべてのインストゥルメントを収集し、カテゴリ(メジャー、マイナー、エキゾチック、その他)に整理します。設定のシンプルなチェックボックスインターフェースを使用して、スキャンするインストゥルメントを簡単に選択できます。 カスタマイズ可能な時間枠選択 : 21種類の異なる時間枠からスキャン用に選択できます。すべての選択された時間枠はダッシュボードに表示され、新しい信号の通知が各時間枠に送信されます。 簡単なCCI設定 : CCIの設定(期間と適用価格を含む)を調整し、売買レベルを設定できます。また、現在のキャンドルに基づいてスキャンするか、最も最
FREE
RSI Dashboard Scanner
Teddy Mutugi Mworia Teddy Mutugi Mworia
5 (1)
取引を強化し、新しいRSIスキャナーのバージョンでさらなる興奮を追加しましょう! 自動的なインストゥルメントのグループ化 : スキャナーは、マーケットウォッチからすべてのインストゥルメントを自動的に収集し、主要(Majors)、副次(Minors)、エキゾチック(Exotics)、その他(Others)の4つのカテゴリに整理します。 カスタマイズ可能な信号選択 : 設定ページで、信号をスキャンしたいインストゥルメントを選択できます。 柔軟な時間枠の選択 : 信号を監視したい時間枠を指定することもできます。 RSIパラメータの設定 : RSIパラメータ(期間と適用価格)を簡単に設定し、売買レベルを定義できます。現在のキャンドルデータを使用するか、キャンドルが閉じるのを待ってから信号を処理するかを選択できます。 個別のカラーカスタマイズ : 前景、背景、買い矢印、売り矢印の色をカスタマイズできます。スキャナーは、各要素の色を自動的に調整して、視覚的に魅力的なインターフェースを作成します。 矢印タイプの選択 : 好みに合わせてさまざまな矢印タイプを選択できます。 リアルタイムアラート : 選
FREE
MT4 MA Tuner
Teddy Mutugi Mworia Teddy Mutugi Mworia
5 (1)
移動平均線を微調整するための究極のツール これは、移動平均線の設定を簡素化し、最適化するために設計された高度なツールです。MAチューナーを使用すると、ユーザーフレンドリーなパネルを通じて、主要なパラメーター(期間、シフト、メソッド、価格)を簡単に調整でき、キャンドルが移動平均線を交差する頻度や、それに対するオープンおよびクローズの位置に関する詳細な統計情報を即座に取得できます。 なぜ、標準の移動平均線インジケーターよりも優れているのでしょうか? 標準の移動平均線インジケーターと同じMAラインを描画しながら、MAチューナーでは、期間を1ずつ増やすたびにインジケーターウィンドウを開く必要がありません。さらに、シフトや他の調整もスムーズに行えるため、より効率的なトレーディングが可能です。
FREE
Moving Average Crossing Scanner
Teddy Mutugi Mworia Teddy Mutugi Mworia
4.33 (3)
This indicator scans the Moving Average values for 2 Moving Averages on multiple pairs and multiple timeframes in realtime and displays a Buy signal when the fast MA is above the slow MA and a Sell signal when the fast MA is below the slow MA.  -All the MA parameters(Period, Method and Applied price) can be changed from the inputs window. -You can either add your own list of pairs to scan or set the scanner to automatically use the pairs in the market watch using the Symbols Source input. -T
FREE
フィルタ:
レビューなし
レビューに返信