PipsFactoryWeeklyDemo
- インディケータ
- バージョン: 3.0
- アップデート済み: 3 12月 2021

This is Demo version of PipsFactoryWeekly
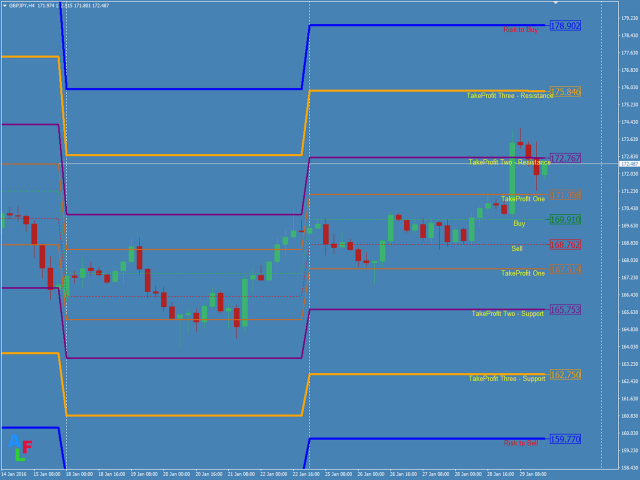
This indicator depends on High and Low price of Currency in last Week and then i made some secret equations to draw 10 lines.
Features:
- You will know what exactly price you should enter the market .
- You will know when to be out of market.
- You will know you what should you do in market:
- Buy
- Sell
- Take profit and there are 3 levels to take your profit
- Support
- Resistance
- Risk to buy
- Risk to Sell
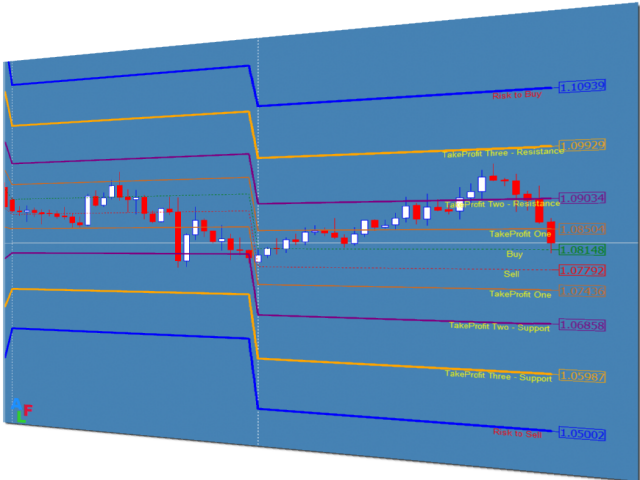
Signal Types and Frame used:
- You can use this indicator just on H4 frame and you have to download the historical data of W1 frame.
- Enter buy order in case the price is at buy line and there are 3 levels to take your profit
- First level is take profit.
- Second level is take profit too but it is also Resistance.
- Third level is take profit too but it is also Resistance.
- The fourth line is Risk to enter market with buy order.
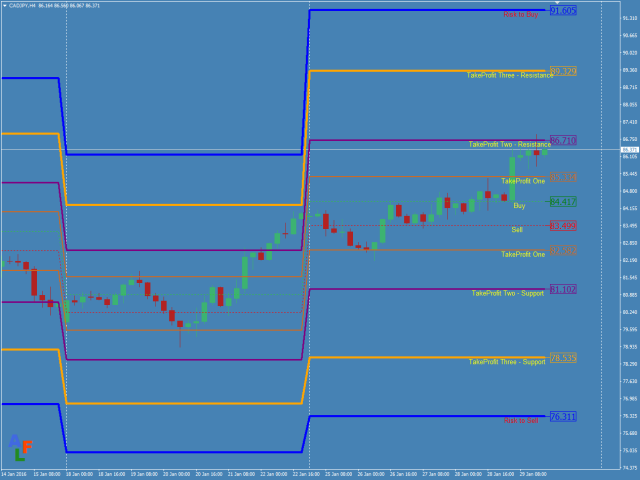
- Enter sell order in case price at sell line and there are 3 levels to take your profit
- First level is take profit.
- Second level is take profit too but it is also Support
- Third level is take profit too but it is also Support.
- The fourth line is Risk to enter market with sell order.
- Currency: It works on USD/CAD because it is a Demo Version but full version works on any currency pair
- It is very easy to use.
ユーザーは評価に対して何もコメントを残しませんでした