MTF MovingAverage

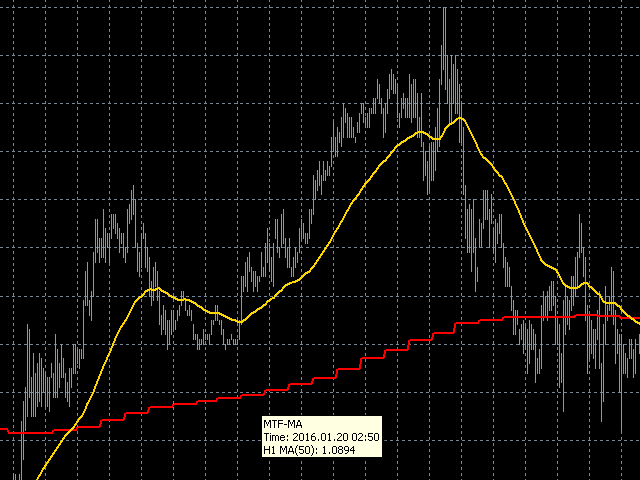
The indicator displays the moving average of a higher timeframe on the chart.


The indicator parameters

  • TimeFrame - time frame of the moving average (drop-down list)
  • MaPeriod - moving average period
  • MaMethod - moving average method (drop-down list)
  • MaShift - moving average shift
  • MaPrice - moving average price (drop-down list)
おすすめのプロダクト
This Signal Zero Risk indicator uses Donchian channel and ATR indicators. This trend tracking system uses historical data to buy and sell. This indicator does not repaint. The point at which the signal is given does not change. You can use it in all graphics. You can use it in all pairs. This indicator shows the input and output signals as arrows and alert. Open long deals on blue arrows Open short deals on red arrows It tells you that you should quit the transaction. Parameters Alerts -  notif
「ダイナミック・スキャルピング・オシレーター」は、MT4向けの高度なカスタムCrypto_Forexインジケーターです。効率的な取引ツールです! - 新世代のオシレーター - 使い方は画像をご覧ください。 - ダイナミック・スキャルピング・オシレーターは、適応型の売られ過ぎ/買われ過ぎゾーンを備えています。 - オシレーターは、動的な売られ過ぎ/買われ過ぎエリアから正確なエントリーポイントを見つけるための補助ツールです。 - 売られ過ぎ値:グリーンラインより下、買われ過ぎ値:オレンジラインより上。 - このインジケーターは、プライスアクションパターンと組み合わせるのに最適です。 - 標準的なオシレーターよりもはるかに正確です。対応時間枠:M30、H1、H4、D1、W1。 - PCとモバイルの両方でアラート機能付き。 高品質のトレーディングロボットとインジケーターをご覧になるにはここをクリックしてください! これは、このMQL5ウェブサイトでのみ提供されるオリジナル製品です。
This indicator is based on the classical indicators: RSI (Relative Strength Index) and PSAR (Parabolic Stop and Reverse) and will be helpful for those who love and know how to use not a visual but digital representation of the indicators. The indicator shows values from 9 currency pairs. You will be able to change the main input parameters for RSI: OverboughtLevel = 70; OversoldLevel = 30; Period = 14; Price = PRICE_CLOSE; and PSAR: step = 0.02; maximum = 0.2; Also you may change Symb1 - Symb9 t
Trend reversal indicator. This indicator is based on expected value, as well as the Bollinger Bands and Ichimoku Kinko Hyo technical indicators. A trend reversal is determined by a complex mathematical formula, and its confirmation is based on the values of BB and the Ichimoku cloud. Signals are generated at the peak of a trend reversal, i.e. Trend Arrow Finder identifies the beginning of a new trend and the end of the previous trend. When a new candle opens, a signal for opening positions (buy
「スキャルピング取引戦略」-インディケータはスキャルピングシステムを使用して取引するために作成されました。 「スキャルピング取引戦略」は、価格が今どこに行くかを矢印でチャートに示しています。インジケーターが矢印を引いた後、価格は矢印の方向に少なくとも20ポイント移動します。これは私たちが効果的に取引するのに十分です。 「スキャルピング取引戦略」はそのシグナルを再描画しません。インジケータには、さまざまな動作モードがあります。新しいローソク足の始点とローソク足の終点の両方に矢印を描くことができます。選択した動作モードによって異なります。 「スキャルピング取引戦略」では、ある方向に複数の矢印を描画してから、別の方向に矢印を描画できます。各矢印の後、価格はトレンドを完全に逆転させるか、矢印の方向に少し引き戻します。 「スキャルピング取引戦略」指標の価値は、この指標がトレーダーが短期間で日中取引を開始するのに役立つことです。 「スキャルピング取引戦略」指標の利点: 信号を再描画しません。 「スキャルピング取引戦略」は、日中の取引に役立ちます 「スキャルピング取引戦略」はスキャルピング用に設
回帰取引を意味する専門的かつ定量的なアプローチを実装する独自の指標。これは、価格が予測可能かつ測定可能な方法で迂回して平均に戻るという事実を利用しており、非定量的な取引戦略を大幅に上回る明確な出入りルールを可能にします。 [ Installation Guide | Update Guide | Troubleshooting | FAQ | All Products ] 明確な取引シグナル 驚くほど簡単に取引できます カスタマイズ可能な色とサイズ パフォーマンス統計を実装します ほとんどの取引戦略を上回ります 適切なSLおよびTPレベルを表示します 電子メール/音声/視覚アラートを実装します 使い方 インディケータは、より高い時間枠からの完全にカスタマイズ可能な移動平均の周りの標準偏差を測定し、トレンドフォローアプローチを使用して正確に取引を見つけます。取引は、現在のチャートの価格アクションに飛び込むことによって見つけられ、価格が選択したより高い時間枠から計算された平均価格帯に戻ったときに閉じられます。それがコード化される方法のために、指標は高ボラティリティと強いトレンドの市場か
SuperTrend Alerts adds alerts to the widely popular SuperTrend indicator. As the name suggests, SuperTrend is a trending indicator which works best in trendy (not choppy) markets. SuperTrend is extremely popular for intraday and daily trading, and can be used on any timeframe. Place a call when the price closes above the SuperTrend line, and place a put when the price closes below the SuperTrend line. These crossovers are highlighted by non-repainting up/down arrows. Alerts Email, message and s
Impulse fractals indicator - is counter-trend oriented complex market fractal pattern.  Market creates bull/bear impulse, trend starts, fractals on impulsed wave are an agressive pullback signals. Buy arrow is plotted when market is bearish and it's impulse showed up-side fractal, and sell arrow is plotted when market is bullish and it's impulse showed dn-side fractal. Main indicator's adjustable inputs : impulsePeriod - main period of impulse histogram  filterPeriod  - smoothes impulse accordi
Daily hedge
Ad Hock Technologies Pty LTD
Introducing Daily Hedge - Your Advanced Custom Hedge System for Forex Trading Unleash the Power of Daily Hedge - Your Ultimate Trading Companion Experience the next level of trading sophistication with Daily Hedge, an advanced custom hedge system designed to revolutionize your Forex trading experience. With its cutting-edge features and intelligent algorithms, Daily Hedge empowers you to make informed decisions and seize profitable opportunities like never before. Unlocking Advanced Trading Str
Tiger Trend
Leandro Bernardez Camero
Tiger Trend – ダイナミックなレンジベースのトレンド反転インジケーター 最新情報を受け取るにはチャンネルに参加してください: https://www.mql5.com/en/channels/forexnewadvisor Tiger Trend は、最近の価格レンジから計算された適応的なサポートとレジスタンスレベルに基づいて、潜在的なトレンド反転を検出するために設計されたダイナミックなトレンドインジケーターです。価格の終値がこれらの動的な閾値に対してどのように反応するかを分析することで、モメンタムの変化をトレーダーが見極めるのをサポートします。 主な特徴: 平均価格レンジとユーザー定義のリスクパラメータに基づく動的なサポート/レジスタンスの計算 価格がこれらの適応レベルを上回る/下回る際にトレンド方向の変化を検出 買いまたは売りの反転ポイントをチャート上に矢印で視覚的に表示 トレンド転換時にリアルタイムでアラートを発する通知システム Tiger Trend は、モメンタムの初期変化を捉えたいデイトレーダーやスイングトレーダーにとって特に有効です。 動作の仕組み シグ
Xeons
Maryna Shulzhenko
The Xeon indicator was created to display the trend in a visual form. One of the main definitions for monitoring the currency market is trend. A trend is a stable direction of price movement. To find it, the indicator uses calculations designed to smooth out sharp fluctuations that do not affect the overall picture of price movement. The indicator was created for those who value their time and money. A trend can be increasing (bullish trend) or decreasing (bearish trend). In most cases, a tre
XFlow shows an expanding price channel that helps determine the trend and the moments of its reversal. It is also used when accompanying transactions to set take profit/stop loss and averages. It has practically no parameters and is very easy to use - just specify an important moment in the history for you and the indicator will calculate the price channel. DISPLAYED LINES ROTATE - a thick solid line. The center of the general price rotation. The price makes wide cyclical movements around the
Нестандартный индикатор определения текущего тренда. Альтернативный подход к определению текущей рыночной тенденции. В основе лежит уникальный алгоритм. Не используются   скользящие средние , осцилляторы , супер-тренды и прочие стандартные индикаторы. Для таймфреймов:   от M15 до D1 . Для стилей торговли:  интрадэй, свинг, долгосрок . Может стать готовой торговой стратегией совместно с любым канальным индикатором. Например таким, как индикатор   "Snake" . Внимание! Это индикатор, а не советник,
Cloud Stair is an Indicator has 2 Cloud (Up Trend and Down Trend). Cloud will turn Red when trend go down. Cloud will turn Blue when trend go up. You can use this indicator as a Support and Resistance level. Trend very strong when there are no opposite side. Open Buy position when the indicator show blue cloud and no red cloud. Open Sell position when the indicator show red cloud and no blue cloud.
Smooth MA Trend Cross Alert is indicator signal strategy trading by Smoothed Moving Average (SMMA) crossover. It'll alert signal with an audio or pop up on the chart when 2 periods SMMA cross above/below for Buy/Sell. It easy use. Filter sideways by SMMA's smoothed trend. Helpful for your system trading. You can customize period of SMMA for crossing alert signal. You can ON/OFF audio alert signal on the chart, Notifications alert on mobile, Email message alert when Buy/Sell SMMA cross alert sign
このインジケーターは実践的なトレードに最適な自動波動分析のインジケーターです! 場合... 注:   Tang Lun (Tang Zhong Shuo Zen) の命名規則の影響で、私は波のグレーディングに西洋の名前を使用することに慣れていません。基本的な波を ペン 、二次波のバンドを セグメント と名付けました。同時に、 セグメント にはトレンドの方向が指定されます (この命名方法は将来のノートで使用されます。最初に言っておきます)。ただし、アルゴリズムは曲がりくねった理論とはほとんど関係がないため、付けるべきではありません。これは、私の市場分析 によって要約された、絶えず変化する複雑な運用ルール を反映しています。 バンドは標準化され、人によって異なることがないよう定義されており、市場参入を厳密に分析する上で重要な役割を果たす人為的な干渉の描画方法が排除されています。 このインジケーターを使用することは、取引インターフェイスの美しさを改善することと同等であり、元の K ライン取引を放棄し、取引の新しいレベルに連れて行きます。また、宣伝の観点から顧客の認識も向上します。 イ
XAU Marti
BILLY ARANDUQUE ABCEDE
Get the EA for FREE Just sign up and use my broker. Broker Link :  https://fbs.partners?ibl=684451&ibp=26113188 Setfile Here :  https://drive.google.com/file/d/1IetLj8ZC-AehDXQLJCTYfWGn3GB4JgqU/view?usp=sharing MT5 Version Here :  https://www.mql5.com/en/market/product/136467 XAU Marti The Smart Choice for Gold & Forex Traders -  Profit Potential! Why This EA Stands Out: RSI-POWERED ENTRIES   - Combines the reliability of RSI indicators with advanced money management for high-probab
This is  a dashboard indicator that displays the Average Level of each selected currency pairs that filters and gives us a signal for overbought (>=90%) or if price at extreme peak above 90, and/or oversold (<=10%) or if price at extreme peak below 10. The calculation is using Relative Strength Index default periods (2 & 9) applied to three different higher time frames H4,D1,&W1. This won't change or altered even if you change symbol or switch to lower time frames or even in monthly and year
The Others indicator is a trend-type indicator. In those moments when you need to make a decision to enter a position and give the trader a direction. The indicator gives the trader the opportunity to visually determine which trend will be present at a particular time interval. These are auxiliary tools for technical analysis of the market. Recommended for use in conjunction with any of the oscillators. The main application of the Others indicator is to generate buy and sell signals. Determini
Introducing RSI Jurik—an innovative indicator designed to revolutionize your forex trading strategy by combining custom moving averages based on the Relative Strength Index (RSI) with the MetaTrader 4 indicator, RSI. Jurik moving averages are renowned for their accuracy and reliability in analyzing price movements in the forex market. They provide traders with smoother representations of price action, reducing noise and offering clearer signals for identifying trends and potential reversals.
FREE
Indicator for binary options arrow is easy to use and does not require configuration works on all currency pairs, cryptocurrencies buy signal blue up arrow sell signal red down arrow tips do not trade during news and 15-30 minutes before their release, as the market is too volatile and there is a lot of noise it is worth entering trades one or two candles from the current period (recommended for 1 candle) timeframe up to m 15 recommended money management fixed lot or fixed percentage of the depo
PipsZenith Trend Range Assistant Overview The PipsZenith Trend Range Assistant is a clean, professional MT4 indicator designed to help traders quickly identify whether the market is in a trend (bullish/bearish) or range (sideways). It removes guesswork and prevents false trades in choppy conditions by combining Moving Average slope and ADX strength filters, while also offering Heiken Ashi confirmation for smoother trading decisions. This tool is lightweight, intuitive, and built with contr
The intelligent algorithm of the Godfather indicator accurately determines the trend, filters out market noise and generates entry and exit levels. The indicator will help in finding entry points when analyzing the price chart. The program first receives a "snapshot" of the graph, then analyzes it. The results are reported to the trader in the form of signals. The main purpose of this indicator is to determine the moments of entries and exits from transactions, so the indicator displays only th
Trend Tracking System is an indicator that generates trade arrows. It generates trade arrows with its own algorithm. These arrows give buying and selling signals. The indicator certainly does not repaint. The point at which the signal is given does not change. You can use it in all graphics. You can use it in all pairs. This indicator shows the input and output signals as arrows and alert. When sl_tp is set to true, the indicator will send you the close long and close short warnings. It tells yo
REMINDER: Early buyers hot price discount: Price subject to rise after first 20 copies. Starting price $65 and final price will be $1275. Secure your discounted copy Now! Smart Money Analyser Indicator User Manual 1. Introduction Welcome to the   Smart Money Analyser Indicator This powerful tool provides traders with comprehensive market analysis by combining various technical indicators to generate actionable trading signals. Designed to be user-friendly, this indicator helps traders of all
Blahtech VWAP
Blahtech Limited
5 (3)
Was: $69    Now: $49   Blahtech VWAP - Volume Weighted Average Price (VWAP) is the ratio of price to total volume. It provides an average price over a specified time interval.  Links [  Install  |  Update  |  Documentation   ] Feature Highlights Configurable VWAP Line Sessions, intervals, anchored or continuous Previous day settlement line Standard Deviation bands Alerts at bar close or real time Automatic Broker or Tick volumes Significantly reduced CPU usage Input Parameters Expert Advisor
ZhiBi Fast Scalpは、優れた高速スキャルピングインデックスシステムで、トレンドに従ってシグナルが変動し、BuyシグナルとSellシグナルが頻繁に表示されます。 すべての市場の種類と期間に適しています。 上向きの矢印は買い注文を出すために現れ、下向きの矢印は売り注文を出すために現れる。 パラメータ設定の説明 [Signal_line_period]:小周期信号線の平均周期。 [Trend_line_period]:大周期トレンドラインの平均期間。 [Alert_No_Off]:ポップアップメッセージを開くか閉じる; true = on、false = off; [SendMail_No_Off]:Eメールのオンまたはオフ、true =オン、false =オフ。 [SendNotification_No_Off]:メッセージは携帯端末にオンまたはオフにプッシュされる。 true =オン、false =オフ。 より有用なインディケータURL: https://www.mql5.com/en/users/zhengqiuyang/seller
This product works by detecting trend opportunities. So as shown in the screenshot when The indicator shows an upward arrow it shows the market is on an uptrend and when the indicator Shows a downward arrow it shows the market is on a downward direction. What makes this indicator Special is that it has additional signals just below the arrow signals. It is up to the trader to be  Creative and combine these signals with the arrow signal to get accurate forecasts.
The Binary Profit Maker,  This indicator works on MT4 and is very easy to use. When you receive a signal from it, you wait for that candle with the signal to close and you enter your trade at the beginning of the next new candle . A Up Purple arrow means Buy and a Down Purple arrow means Sell. All arrows comes with Alert  like for easy identification of trade signal. Are you okay with that? How To Enter Trade? 1 minute candle 1 minute expire
The Volatility Pro is a professional indicator for the MetaTrader 4 platform This indicator can be used to calculate the volatility using two methods. It is also possible to apply a moving average to the volatility histogram. This indicator allows to easily identify the bars with high volatility, and it will also be useful for traders who trade the volatility breakouts. By purchasing this indicator, you will receive: Excellent indicator signals. Free product support. Regular updates. Unique ind
このプロダクトを購入した人は以下も購入しています
Gann Made Easy は、ミスター・ギャンの理論を使用した取引の最良の原則に基づいた、プロフェッショナルで使いやすい外国為替取引システムです。 W・D・ガン。このインジケーターは、ストップロスとテイクプロフィットレベルを含む正確な買いと売りのシグナルを提供します。 PUSH通知を利用して外出先でも取引可能です。 ご購入後、取引方法の説明と優れた追加インジケーターを無料で入手するには、私にご連絡ください! おそらく、ギャンの取引手法についてはすでに何度も聞いたことがあるでしょう。通常、ギャンの理論は初心者のトレーダーだけでなく、すでにある程度の取引経験がある人にとっても非常に複雑なものです。なぜなら、ギャンの取引手法は理論的にはそれほど簡単に適用できるものではないからです。私はその知識を磨き、最良の原則を私の外国為替インジケーターに組み込むために数年を費やしました。 このインジケーターは非常に簡単に適用できます。必要なのは、それをチャートに添付し、簡単な取引推奨事項に従うだけです。このインジケーターは常に市場分析の仕事を行い、取引の機会を探します。適切なエントリーポイントを検出す
Ultimate Sniper Dashboard
Hispraise Chinedum Abraham
4.82 (22)
299ドルで割引中! 今後値上げの可能性あり! 下の説明を読んでください! 究極のスナイパーダッシュボードのための最高のエントリーシステム。究極のダイナミックレベル。(私の製品をチェックしてください) 究極のスナイパーダッシュボードはMT4多通貨テスト制限のため、ライブマーケットでのみ作動します。 究極のスナイパーダッシュボードをご紹介します。HA-Sniper、MA-Sniper、その他多くの特別なモードが含まれる最高の製品です。究極のスナイパーダッシュボードは絶対的な獣です! 初心者やエキスパートトレーダーにとって最高のソリューションです。もう二度と動きを見逃さない! シンプルさとピップを愛するトレーダーのために、特別な製品をご用意しました。シンプルでありながら、ダッシュボードは複数のカスタムアルゴリズムに基づき28の通貨ペアを監視し、すべての作業を行います。たった一つのチャートで、プロのように市場を読み解くことができます。もし、為替ペアが動き出したときに、その方向性を正確に特定することができれば、あなたの取引はどれほど改善されることでしょう。   当社のシステムは、高い確率
M1 SNIPER は使いやすいトレーディングインジケーターシステムです。M1時間足向けに設計された矢印インジケーターです。M1時間足でのスキャルピングのためのスタンドアロンシステムとして、また既存のトレーディングシステムの一部としても使用できます。このトレーディングシステムはM1時間足での取引に特化して設計されていますが、他の時間足でも使用できます。元々、この手法はXAUUSDとBTCUSDの取引用に設計しましたが、他の市場においても役立つと考えています。 インジケーターのシグナルは、トレンドの方向と逆方向に取引できます。インジケーターのシグナルを利用して両方向に取引するのに役立つ特別な取引テクニックをご紹介します。この手法は、特別な動的なサポートとレジスタンスの価格帯を利用することに基づいています。 ご購入後、M1 SNIPER矢印インジケーターをすぐにダウンロードできます。さらに、M1 SNIPERツールのすべてのユーザーに、以下のスクリーンショットに表示されているApollo Dynamic SRインジケーターを無料で提供しています。この2つのインジケーターを組み合わせることで
After purchase, contact me privately to receive 1 month of free testing with EA Forex Proton! This advanced MT4 trading robot automatically executes signals from any MT4 indicator, including Market Makers. The latest version also includes AI integration, allowing each trade signal to be analyzed using Artificial Intelligence. Live Signal with EA Forex Proton: Click here Market Makers is a powerful price action trading system designed to identify high-probability Buy and Sell opportunities based
Scalper Inside PRO – Since 2020. An exclusive indicator that utilizes an innovative algorithm to swiftly and accurately determine the market trend. The indicator automatically calculates opening, closing, and profit levels, providing detailed trading statistics. With these features, you can choose the most appropriate trading instrument for the current market conditions. Additionally, you can easily integrate your own arrow indicators into Scalper Inside Pro to quickly evaluate their statistics
まず第一に、この取引ツールはノンリペイント、ノンリドロー、ノンラグの指標であり、プロの取引に理想的ですことを強調する価値があります。 オンラインコース、ユーザーマニュアル、デモ。 スマートプライスアクションコンセプトインジケーターは、新米から経験豊富なトレーダーまで、非常 に強力なツールです。Inner Circle Trader AnalysisやSmart Money Concepts Trading Strategiesなど、20以上の有用な指標を1つに組み合わせています。このインジケーターはスマートマネーコンセプトに焦点を当て、大手機関の取引方法を提供し、彼らの動きを予測するのに役立ちます。 特に、流動性分析に優れており、機関がどのように取引しているかを理解しやすくしています。市場のトレンドを予測し、価格の動きを慎重に分析するのに優れています。機関の戦略とトレードを合わせることで、市場の動向についてより正確な予測ができます。このインジケーターは多目的であり、市場構造を分析し、重要な注文ブロックを特定し、さまざまなパターンを認識するのに優れています。 このインジケーターは
Trend Screener
STE S.S.COMPANY
4.79 (95)
トレンドインジケーター、1つのツールに組み込まれたすべての重要なトレンド機能を備えたトレンドトレーディングとフィルタリングのための画期的なユニークなソリューション! これは、すべてのシンボル/商品(外国為替、商品、暗号通貨、インデックス、株式)で使用できる100%再描画されていないマルチタイムフレームおよびマルチ通貨インジケーターです。 期間限定オファー: サポートおよびレジスタンス スクリーナー インジケーターは、たった 50 ドルで永久的にご利用いただけます。(元の価格 250 ドル) (オファー延長) トレンドスクリーナーは、チャート内のドットで矢印トレンドシグナルを提供するインジケーターに続く効率的なインジケーターです。 トレンド分析インジケーターで使用できる機能: 1.トレンドスキャナー。 2.最大利益分析を備えたトレンドライン。 3.トレンド通貨強度メーター。 4.アラート付きのトレンド反転ドット。 5.アラート付きの強いトレンドドット。 6.トレンド矢印 毎日の分析例、毎日のシグナルパフォーマンス...など、トレンドスクリーナーインジケーターを使用して、ここで見つけること
Route Lines Prices -は、価格の方向性を予測するために設計されたインジケーターです。シンプルなインターフェースには、価格変動と将来の方向性を計算するための複数のアルゴリズムが搭載されています。これらのアルゴリズムには、使用する時間枠に基づいたボラティリティ計算と価格平滑化が含まれています。 このインジケーターには、「 Calculating price values 」値を変更するためのパラメーターが1つだけあります。デフォルト値の1は、バランスの取れた自動計算を提供し、インジケーターを手動で設定することなく使用できます。 値を2から500まで手動で変更することで、インジケーターを独自のトレーディングシステムに合わせてカスタマイズできます。 このインジケーターは、M1からH4の時間枠での使用を推奨します。あらゆる取引銘柄で使用できます。 シグナル矢印はローソク足の終値で生成され、過去の履歴には再描画されません。 メインチャートには、重複した矢印が表示されます。 複数のアラートタイプが利用可能です。内蔵のライン軌跡カウンターは、終値に基づいて動作します。これ
「 Dynamic Scalper System 」インジケーターは、トレンド波の中でスキャルピング取引を行う手法のために設計されています。 主要通貨ペアと金でテスト済みで、他の取引商品との互換性があります。 トレンドに沿った短期的なポジションオープンのシグナルを提供し、追加の価格変動サポートも提供します。 インジケーターの原理 大きな矢印はトレンドの方向を決定します。 トレンド波の中では、小さな矢印の形でスキャルピングシグナルを生成するアルゴリズムが機能します。 赤い矢印は強気方向、青い矢印は弱気方向です。 トレンドの方向には敏感な価格変動ラインが描かれ、小さな矢印のシグナルと連動します。 シグナルは次のように機能します。適切なタイミングでラインが現れるとエントリーシグナルが形成され、ラインが開いている間はポジションが保持され、完了すると取引が終了します。 推奨される動作時間枠はM1~H4です。 矢印は現在のローソク足に形成され、次のローソク足が開いている場合は、前のローソク足の矢印は再描画されません。 入力パラメータ Trend Wave Period - トレンド方向
Ultimate Dynamic Levels
Hispraise Chinedum Abraham
4.7 (10)
現在、ホリデーディスカウントで399ドル! 今後値上がりする可能性があります。以下の説明をお読みください。 Ultimate Dynamic Levelsの紹介 - Ultimate Sniper DashboardのBESTエントリーインジケーター! 極めてローリスクなタイムリーエントリーと高RR!!! アルティメットスナイパーダッシュボードはこちら。 初心者はもちろん、プロのトレーダーにとっても最も重要な能力は、いつどこで相場が転換するかを正確に判断し、いかに安全に参入し、利益を得て退場するかを見極めることです。 アルティメット・ダイナミック・レベルズ・インディケーターは、相場が転換する可能性が最も高い場所を簡単に教えてくれるので、極めてローリスクなトレードを自信を持って行うことができ、同時にチャートをクリーンでシンプルに保ちながら、$$$を稼ぐことができるのです! アルティメット・ダイナミック・レベルズ・インディケーターは、複数の時間枠で重要な隠れたレベルを一度に見つけるユニークで強力なアルゴリズムを持っています。また、他の典型的なSRインジケーターのように、レベルを再描
Super Signal – Skyblade Edition プロ仕様のノンリペイント / ノーラグ・トレンドシグナルシステム。卓越した勝率を実現 | MT4 / MT5 対応 1分足、5分足、15分足などの低い時間足で最も効果を発揮します。 主な特徴: Super Signal – Skyblade Edition は、トレンド取引に特化したスマートなシグナルシステムです。マルチレイヤーのフィルターロジックを用いて、明確な方向性と実際のモメンタムに支えられた強力なトレンドのみを検出します。 このシステムは 天井や底を予測するものではありません 。次の3つの条件がすべて満たされた場合にのみシグナルを発生させます: 明確なトレンド方向 モメンタムの増加 健全なボラティリティ構造 市場セッションに基づく流動性分析と組み合わせることで、シグナルの精度とタイミングがさらに向上します。 シグナルの特性: すべての矢印シグナルは 100% 非リペイント / 遅延なし 一度出現したシグナルは固定され、点滅・消失しません チャート上の矢印、情報パネル、ポップアップ通知、音声アラート、プッシュ通知
ON Trade Waves Patterns Harmonic Elliot Wolfeをご紹介します。これは手動および自動の方法を使用して市場のさまざまなパターンを検出するために設計された高度なインジケーターです。以下はその動作方法です: ハーモニックパターン: このインジケーターは、チャートに表示されるハーモニックパターンを識別できます。これらのパターンは、Scott Carneyの「Harmonic Trading vol 1および2」で説明されているように、ハーモニックトレーディング理論を実践するトレーダーにとって重要です。手動で描画するか、自動検出に頼るかにかかわらず、ON Trade Waves Patternsがお手伝いします。 コントロールパネル: このインジケーターはユーザーフレンドリーなコントロールパネルを備えています。チャートと時間枠の設定を保存し、異なる構成間をスムーズに切り替えることができます。チャートスペースを最大限に活用するために最小化することもできます。他の分析ツールで作業することを好む場合、閉じるボタンをクリックするだけで、すべてのインジケーターデ
現在20%OFF! 初心者やエキスパートトレーダーに最適なソリューションです。 このインディケータは、エキゾチックペア・コモディティ・インデックス・先物など、あらゆるシンボルの通貨の強さを表示することに特化したインディケータです。金、銀、原油、DAX、US30、MXN、TRY、CNHなどの通貨の強さを表示するために、9行目にどのシンボルでも追加することができます。独自の機能を多数搭載し、新しい計算式を採用したため、ユニークで高品質、かつ手頃な価格のトレーディングツールとなっています。新しいトレンドやスキャルピングチャンスのトリガーポイントを正確に把握することができるため、あなたのトレードがどのように改善されるか想像してみてください。 ユーザーマニュアル:ここをクリック   https://www.mql5.com/en/blogs/post/708876 すべての時間枠に対応します。あなたはすぐにトレンドを見ることができるようになります! 新しいアルゴリズムに基づいて設計されているため、潜在的な取引の特定と確認がより簡単になります。これは、8つの主要通貨と1つのシンボルの強弱
まず第一に、この取引インジケーターは再描画されず、再描画されず、遅延しないことを強調する価値があります。これにより、手動取引とロボット取引の両方に理想的なものになります。 ユーザーマニュアル:設定、入力、戦略。 アトミックアナリストは、価格の強さとモメンタムを利用して市場でより良いエッジを見つけるためのPA価格アクションインジケーターです。ノイズや誤ったシグナルを除去し、取引ポテンシャルを高めるための高度なフィルターを備えています。複雑なインジケーターの複数のレイヤーを使用して、アトミックアナリストはチャートをスキャンし、複雑な数学的計算をシンプルなシグナルと色に変換します。これにより、どのような初心者トレーダーでも理解して使用し、一貫した取引の決定を行うことができます。 「アトミックアナリスト」は、新規および経験豊富なトレーダー向けにカスタマイズされた包括的な取引ソリューションです。プレミアムインジケーターとトップノッチの機能を1つの取引戦略に組み合わせ、すべてのタイプのトレーダーにとって汎用性のある選択肢にします。 デイリートレーディングとスキャルピング戦略:高速で正確な
通貨強さウィザードは、取引を成功させるためのオールインワン ソリューションを提供する非常に強力な指標です。このインジケーターは、複数の時間枠のすべての通貨のデータを使用して、このまたはその外国為替ペアのパワーを計算します。このデータは、使いやすい通貨インデックスと通貨パワーラインの形式で表され、特定の通貨のパワーを確認するために使用できます。 必要なのは、取引したいチャートにインジケーターを接続することだけです。インジケーターは、取引する通貨の実際の強さを示します。このインジケーターは、トレンドに合わせて取引するときに有利に利用できる売買高の圧力の極値も示します。このインジケーターには、フィボナッチに基づく可能なターゲットも表示されます。 このインジケーターは、PUSH 通知を含むあらゆるタイプのアラートを提供します。 購入後ご連絡下さい。私の取引のヒントをあなたと共有し、素晴らしいボーナスインジケーターを無料で提供します! 幸せで有益な取引をお祈りします。
説明書(ロシア語)  /  説明書 (英語)  /  バージョン MT5 主な機能: 売り手と買い手のアクティブなゾーンを表示します。 このインジケーターは、買いと売りの適切な最初のインパルスレベル/ゾーンをすべて表示します。これらのレベル/ゾーンがアクティブになると、エントリーポイントの探索が始まり、レベルの色が変わり、特定の色で塗りつぶされます。状況をより直感的に把握できるように、矢印も表示されます。 LOGIC AI - テンプレートをアクティブ化するときにエントリポイントを検索するためのゾーン(円)の表示 視認性を向上させるため、人工知能を用いて進入ポイントを探索したゾーンを表示する機能が追加されました。 より高い時間枠からのレベル/ゾーンの表示(MTFモード) より長い時間間隔でレベル/ゾーンを表示する機能を追加しました。また、インジケーターに自動トレンド検出機能(   TPSproTREND PRO   )を実装しました。 取引のための個別の専門的なステップバイステップのアルゴリズム このアルゴリズムは、トレンドの方向と逆方向の両方でデイトレードを行うために設計されていま
BTMM State Engine Pro is a MetaTrader 4 indicator for traders who use the Beat The Market Maker approach: Asian session context, kill zone timing, level progression, peak formation detection, and a multi-pair scanner from a single chart. It combines cycle state logic with a built-in scanner dashboard so you do not need the same tool on many charts at once. What it does Draws the Asian session range; session times can follow broker server offset or be set in inputs. Tracks level progression (L
Auto Optimized Parabolic RSI: 高度な3Dモメンタムエンジン ほとんどのリテール向けインジケーターは、市場のボラティリティが変化した瞬間に破綻する静的な入力値に依存しているため、失敗に終わります。Auto Optimized Parabolic RSIは、自らの数学的優位性を継続的に再計算することで「インジケーターの陳腐化」問題を解決し、機関投資家レベルの定量的適応力をMT5ターミナルに直接もたらします。 最大の強み: カスタムインメモリ3D最適化   標準的な自動最適化ツールは、インジケーターの呼び出しで端末に過負荷をかけるため、頻繁にMT5プラットフォームをフリーズさせます。本ツールは、このボトルネックを完全に回避しています。RAMベースのカスタムネイティブ計算機を内蔵した内部エンジンは、チャートを読み込んだりタイムフレームを変更したりするたびに、超高速の3Dグリッド探索を実行します。RSI期間(頻度)、SARステップ(加速度)、SAR最大値(制限速度)を同時にスイープし、プラットフォームを遅延させることなく、数万通りものパラメーターの組み合わせを絶対的
Linear Trend Predictor ー - エントリ ポイントと方向サポート ラインを組み合わせたトレンド インジケーター。高値/安値チャネルを突破するという原理に基づいて機能します。 インジケーターのアルゴリズムは市場のノイズをフィルタリングし、ボラティリティと市場の動向を考慮します。 インジケーターの機能  平滑化手法を使用して、市場のトレンドと、買い注文または売り注文を開くためのエントリー ポイントを表示します。  任意の時間枠のチャートを分析して、短期および長期の市場の動きを判断するのに適しています。  あらゆる市場や時間枠に適応可能な入力パラメータにより、トレーダーはインジケーターを独自にカスタマイズできます。  設定されたインジケーター信号は消えず、再描画もされません。ローソク足の終値で決定されます。  いくつかの種類の通知が矢印と組み合わされています。  このインジケーターは、独立した取引システムとして使用することも、他の取引システムへの追加として使用することもできます。  あらゆるレベルの経験を持つトレーダーが使用できます。 主なパラメータ Vol
現在40%オフ 初心者やエキスパートトレーダーに最適なソリューション! このインジケーターは、独自の機能と新しい計算式を取り入れた、ユニークで高品質、かつ手頃な価格のトレーディングツールです。たった1枚のチャートで28の為替ペアの通貨強度を読み取ることができます。新しいトレンドやスキャルピングチャンスの引き金となるポイントを正確に特定することができるので、あなたのトレードがどのように改善されるか想像してみてください。 ユーザーマニュアルはこちら  https://www.mql5.com/en/blogs/post/697384 これが最初の1本、オリジナルだ! 価値のないクローンを買わないでください。 特別な サブウィンドウの矢印で強い通貨の勢いを表示 GAPがあなたのトレードを導く! 基準通貨や気配値が売られすぎ・買われすぎのゾーン(外相フィボナッチレベル)にあるとき、個別チャートのメインウィンドウに警告表示。 通貨がレンジの外側から反落した場合、プルバック/リバーサルのアラート。 クロスパターンの特別なアラート 複数の時間枠を選択可能で、トレンドを素早く確認できます
Easy Breakout
Mohamed Hassan
4.71 (14)
After your purchase, feel free to contact me for more details on how to receive a bonus indicator called VFI, which pairs perfectly with Easy Breakout for enhanced confluence!    Easy Breakout is a powerful price action trading system built on one of the most popular and widely trusted strategies among traders: the Breakout strategy ! This indicator delivers crystal-clear Buy and Sell signals based on breakouts from key support and resistance zones. Unlike typical breakout indicators, it levera
Trend indicator AI
Ramil Minniakhmetov
4.53 (83)
Trend Ai indicatorは、トレンドの識別と実用的なエントリポイントと反転アラートを組み合わせることで、トレーダーの市場分析を強化する優れたツールです。 この指標は、ユーザーが自信と正確さで外国為替市場の複雑さをナビゲートすることを可能にします トレンドAiインジケーターは、主要なシグナル以外にも、プルバックやリトレースメント中に発生するセカンダリエントリポイントを識別し、トレーダーが確立されたトレンド内の価格修正を活用できるようにします。 重要な利点: *MT4およびMT5の仕事 *明確な買いまたは売りシグナル *再描画しません ·すべての資産で動作します 私はeaやセットをtelegram it詐欺で販売しないように注意してください。 すべての設定はここでブログで無料です。  重要! 指示とボーナスを得るために購入後すぐに私に連絡してください! 私の他のプロダクトと同様、実質操作の監視はここに見つけることができます: https://www.mql5.com/en/users/mechanic/seller&nbsp ; 設定および入力: すべての
トレンドラインプロ   市場の真の方向転換点を理解するのに役立ちます。この指標は、真のトレンド反転と主要プレーヤーが再び参入するポイントを示します。 分かりますか     BOSライン   複雑な設定や不要なノイズなしに、より長い時間足でのトレンドの変化と重要なレベルを把握できます。シグナルは再描画されず、バーが閉じた後もチャート上に残ります。 VERSION MT 5     -     RFI LEVELS PRO インジケーター と組み合わせることで、その潜在能力を最大限に発揮します。 インジケーターが示す内容: 本当の変化   トレンド(BOSライン) 一度シグナルが現れたら、それは有効です!これは、リペイント機能を持つインジケーターとの重要な違いです。リペイント機能を持つインジケーターは、シグナルを発した後、それを変更し、資金の損失につながる可能性があります。これにより、より高い確率と精度で市場に参入できます。また、矢印が現れた後、目標値(利益確定)に達するか、反転シグナルが現れるまで、ローソク足の色を変更する機能もあります。 繰り返しエントリ       主要プレーヤーの
Order Block Hunter
Noha Mohamed Fathy Younes Badr
5 (10)
Order block hunter indicator is the best indicator for  hunt the order blocks that area where there has been a large concentration of limit orders waiting to be executed Order blocks are identified on a chart by observing previous price action and looking for areas where the price experienced significant movement or sudden changes in direction .This indicator does that for you by using very complicated codes and helps you to take the best areas To buy and sell because it make marks at the best a
GOLD Impulse with Alert
Bernhard Schweigert
4.67 (12)
このインディケータは、当社の2つの製品 Advanced Currency IMPULSE with ALERT  +   Currency Strength Exotics . のスーパーコンビネーションです。 このインジケーターは全ての時間枠で作動し、8つの主要通貨と1つのシンボルの強弱のインパルスをグラフで表示します。 このインジケータは、金、エキゾチックペア、商品、インデックス、先物など、あらゆるシンボルの通貨強度の加速度を表示することに特化されています。金、銀、原油、DAX、US30、MXN、TRY、CNHなどの通貨強度の加速度(インパルスまたは速度)を表示するために、任意のシンボルを9行目に追加できる、この種の最初のものです。 新しいアルゴリズムに基づいて構築され、潜在的な取引の特定と確認がさらに容易になりました。これは、通貨の強さや弱さが加速しているかどうかをグラフィカルに表示し、その加速の速度を測定するためです。加速すると物事は明らかに速く進みますが、これはFX市場でも同じです。つまり、反対方向に加速している通貨をペアリングすれば、潜在的に利益を生む取引を特定
Apollo SR Master は、サポート/レジスタンスゾーンを利用した取引をより容易かつ確実にする特別な機能を備えたサポート/レジスタンスインジケーターです。このインジケーターは、ローカル価格の高値と安値を検出することで、タイムラグなしでリアルタイムにサポート/レジスタンスゾーンを計算します。そして、新たに形成されたSRゾーンを確認するために、インジケーターは特別なシグナルを表示します。このシグナルは、SRゾーンを実際の売りまたは買いシグナルとして考慮して使用できることを示します。この場合、SRゾーンの強度が高まり、SRエリアからの取引が成功する確率も高まります。これがこのインジケーターの基本的な考え方です。 SRゾーンは、ストップロスとテイクプロフィットの設定を容易にします。シグナルの方向に応じて、SRゾーンの上または下のスペースをストップロスとして設定できます。さらに、反対側のSRゾーンは、潜在的なテイクプロフィットエリアとして設定できます。 また、Apollo SRマスターインジケーターをご利用のすべてのユーザーには、「Apollo Price Action System」
KT Gaussian Trend Filter は、ガウスフィルターと線形回帰スムージングを組み合わせることで、明確かつ正確なトレンド分析を実現します。わかりやすい買いと売りのシグナルを生成しながら、市場の長期的な方向性を効果的に示します。 機能 カスタマイズ可能なガウスフィルター: 期間やポール設定を調整してスムージング精度を高め、トレンドの明瞭さを向上。 線形回帰による強化: ガウススムージングをさらに最適化し、市場のノイズによる誤信号を最小限に抑えます。 マルチタイムフレームスキャナー: 複数の時間軸におけるガウストレンドの方向を自動検出し、わかりやすいダッシュボードに表示します。 トレーリングバンド機能: トレンド中の深い押し目でのエントリーポイントを簡単に把握可能。 カラーカスタマイズ対応: チャートの配色や取引スタイルに合わせて色を自由に設定できます。 内蔵アラート機能: ポップアップ、メール、プッシュ通知、サウンドアラートで即時通知を受け取れます。 使い方 このインジケーターは明確なシグナルを提供し、トレーダーがエントリーやエグジットのタイミングを判断しやすくします
Advanced Supply Demand
Bernhard Schweigert
4.91 (299)
現在40%オフ 初心者にもエキスパートトレーダーにも最適なソリューション このインジケーターは独自の機能と新しい公式を多数内蔵しており、ユニークで高品質かつ手頃な取引ツールです。このアップデートでは、2つの時間枠ゾーンを表示できるようになります。より長いTFだけでなく、チャートTFとより長いTF(ネストゾーンを表示)の両方を表示できます。すべてのSupply Demandトレーダーの皆さんのお気に召すはずです。:) 重要情報の公開 Advanced Supply Demandの可能性を最大化するには、 https://www.mql5.com/ja/blogs/post/720245 にアクセスしてください。   エントリーまたはターゲットの正確なトリガーポイントを正確に特定できれば取引がどのように改善されるか想像してみてください。新しい基盤となるアルゴリズムに基づいて構築されているため、買い手と売り手の間の潜在的な不均衡をさらに簡単に特定できます。これは、最も強い需要と供給のゾーンと、過去のパフォーマンス(古いゾーンを表示)がグラフィカルに表現されるためです。これらの機能は、最適な
Volatility Trend System - a trading system that gives signals for entries. The volatility system gives linear and point signals in the direction of the trend, as well as signals to exit it, without redrawing and delays. The trend indicator monitors the direction of the medium-term trend, shows the direction and its change. The signal indicator is based on changes in volatility and shows market entries. The indicator is equipped with several types of alerts. Can be applied to various trading ins
PRO Renko Systemは、特別にRENKOチャートを取引するために設計された高精度の取引システムです。 これは、様々な取引商品に適用することができる普遍的なシステムです。 システムは効果的に正確な逆転信号へのアクセスを与えるいわゆる市場の騒音を中和する。 表示器は非常に使いやすく、信号の生成に責任がある1つの変数だけがあります。 あなたは簡単にお好みの任意の取引ツールとレンコバーのサイズにツールを適応させることができます。 私はいつもあなたが私のソフトウェアで収益性の高い取引を支援するために余分なサポートを提供する準備ができています! 私はあなたに幸せで収益性の高い取引をしたいです! ご購入後にご連絡ください! 私はあなたに私のレンコチャートジェネレータを送信します。 私はまた、私の個人的な推奨事項やシステムの他のモジュールを無料で共有します!
作者のその他のプロダクト
The Expert Advisor allows you to build a trading system based on a custom indicator. It performs automated opening/closing of trades based on the signals of arrow indicators (which buffer values ​​other than 0 and EMPTY_VALUE) or color lines. The EA polls the values ​​of the specified indicator buffers, opens/closes and accompanies trades according to the specified parameters. The Expert Advisor implements the following trade support functions: -installation of SL and TP; -calculation of the
Semiautomatic EA for trading based on the averaging and locking strategy. The trader sends signals for opening grids by using the buttons on the chart. The EA opens a market order, places a grid of limit orders in the same direction with lot multiplication according to specified parameters and a locking stop order in the opposite direction with the volume equal to the sum of all the previous ones. Once the price passes the specified breakeven level, the EA places a stop loss at the open price+sp
The indicator displays the data of the Stochastic oscillator from a higher timeframe on the chart. The main and signal lines are displayed in a separate window. The stepped response is not smoothed. The indicator is useful for practicing "manual" forex trading strategies, which use the data from several screens with different timeframes of a single symbol. The indicator uses the settings that are identical to the standard ones, and a drop-down list for selecting the timeframe. Indicator Paramet
The indicator displays the data of the candles from a higher timeframe on the chart. Only the candle body (by the open and close prices) is displayed. The candlesticks are colored depending on the difference between the open and close prices. After removing the indicator from the chart, the objects used by it are deleted automatically. Indicator Parameters TimeFrame - time frame (drop-down list) BearColor - bearish candle color (standard dialog) BullColor - bullish candle color (standard dialog
The indicator displays the data of a standard MACD indicator from a higher timeframe. The product features notifications of crossing the zero or signal line by the histogram. Parameters TimeFrame - indicator timeframe (dropdown list) MacdFast - fast line period MacdSlow - slow line period MacdSignal - signal line period MacdPrice - price type (dropdown list) AlertCrossZero - enable notifications of crossing the zero line AlertCrossSignal - enable notifications of crossing the signal line UseNot
The indicator displays the data of the Average True Range (ATR) from a higher timeframe on the chart. It allows you to see the scope of the movement without having to switch to another screen terminal The indicator parameters TimeFrame - time frame of the data (drop-down list) can not be lower than current AtrPeriod - period of the Average True Range indicator a higher timeframe range
The indicator displays the data of the standard ADX indicator from a higher timeframe on the chart. Several indicators with different timeframe settings can be placed on a single chart. The indicator parameters TimeFrame - time frame of the data (drop-down list) can not be lower than current AdxPeriod - period of the indicator for a higher timeframe AdxPrice - prices for the calculation of the indicator data from a higher timeframe
The indicator detects divergence signals - the divergences between the price peaks and the MACD oscillator values. The signals are displayed as arrows in the additional window and are maintained by the messages in a pop-up window, e-mails and push-notifications. The conditions which formed the signal are displayed by lines on the chart and in the indicator window. Indicator Parameters MacdFast - fast MACD line period MacdSlow - slow MACD line period MacdSignal - MACD signal line period MacdPric
The indicator detects and displays М. Gartley's Butterfly pattern. The pattern is plotted by the extreme values of the ZigZag indicator (included in the resources, no need to install). After detecting the pattern, the indicator notifies of that by the pop-up window, a mobile notification and an email. The pattern and wave parameters are displayed on the screenshots. The default parameters are used for demonstration purposes only in order to increase the amount of detected patterns. Parameters z
The indicator displays the averaged value of the moving averages of the current and two higher timeframes with the same parameters on the chart. If the moving averages are located one above the other, the resulting one is painted in green, showing an uptrend, in the opposite direction - red color (downtrend), intertwined - yellow color (transitional state) The indicator parameters MaPeriod - moving average period MaMethod - moving average method (drop-down list) MaShift - moving average shift M
The indicator displays the price movement on the chart, which is smoothed by the root mean square function. The screenshot shows the moving average with period 20, the smoothed root mean square (red) and simple SMA (yellow). The indicator parameters MAPeriod - Moving average period MaPrice - applied price (drop down list, similar to the standard MovingAverage average) BarsCount - number of processed bars (reduces download time when attaching to the chart and using in programs).
The indicator displays the standard price deviation from the root mean moving average line in the additional window. The screenshot displays the standard indicator (the lower one) and SqrtDev (the upper one). Parameters SqrtPeriod - root mean line and standard deviation period. SqrtPrice - applied price (drop-down list). BarsCount - amount of processed bars (reduces the download time when applying to a chart and using in programs).
The indicator detects and displays the 5-0 harmonic pattern on the chart according to the scheme provided in the screenshot. The pattern is plotted by the extreme values of the ZigZag indicator (included in the resources, does not require additional installation). After detecting the pattern, the indicator notifies of that by the pop-up window, a mobile notification and an email. The indicator highlights not only the complete figure, but also the time of its formation. During the formation the f
The indicator detects and displays the AB=CD harmonic pattern on the chart according to the scheme provided in the screenshot. The pattern is plotted by the extreme values of the ZigZag indicator (included in the resources, does not require additional installation). After detecting the pattern, the indicator notifies of that by the pop-up window, a mobile notification and an email. The indicator highlights not only the complete figure, but also the time of its formation. During the formation the
UniversalEA
Sergey Deev
3.4 (5)
The Expert Advisor allows you to build a trading system based on a custom indicator. It performs automated opening/closing of deals based on the signals of an indicator that places values ​​other than 0 and EMPTY_VALUE in the buffer. The EA polls the values ​​of the specified indicator buffers, opens/closes and accompanies trades according to the specified parameters. The Expert Advisor implements the following trade support functions: - installation for the transaction SL and TP; - calculation
The indicator detects and displays the White Swan and Black Swan harmonic pattern on the chart according to the scheme provided in the screenshot. The pattern is plotted by the extreme values of the ZigZag indicator (included in the resources, does not require additional installation). After detecting the pattern, the indicator notifies of that by the pop-up window, a mobile notification and an email. The indicator highlights not only the complete figure, but also the time of its formation. Duri
The indicator detects and displays Shark harmonic pattern (see the screenshot). The pattern is plotted by the extreme values of the ZigZag indicator (included in the resources, no need to install). After detecting the pattern, the indicator notifies of that by a pop-up window, a mobile notification and an email. The indicator highlights the process of the pattern formation and not just the complete pattern. In the former case, it is displayed in the contour triangles. After the pattern is comple
The indicator detects and displays 3 Drives harmonic pattern (see the screenshot). The pattern is plotted by the extreme values of the ZigZag indicator (included in the resources, no need to install). After detecting the pattern, the indicator notifies of that by a pop-up window, a mobile notification and an email. The indicator highlights the process of the pattern formation and not just the complete pattern. In the former case, it is displayed in the contour triangles. After the pattern is com
The indicator detects and displays Cypher harmonic pattern also known as Anti-Butterfly (see the screenshot). The pattern is plotted by the extreme values of the ZigZag indicator (included in the resources, no need to install). After detecting the pattern, the indicator notifies of that by a pop-up window, a mobile notification and an email. The indicator highlights the process of the pattern formation and not just the complete pattern. In the former case, it is displayed in the contour triangle
The indicator displays ZigZag lines from a higher timeframe (see the example in the screenshot). The red thin line is the current timeframe's ZigZag, while a thicker yellow line is the higher timeframe's one. The indicator is repainted as the data is updated. Parameters Depth, Dev, Back - ZigZag parameters; BarsCount - amount of processed bars (reduces the initial download time and decreases the load when using in an EA); TimeFrame - indicator timeframe (cannot be lower than the current one).
The indicator displays Renko bars on the chart, plots two moving averages by them and generates buy/sell signals based on the conditions displayed in the screenshots and described below: the buy signal is formed if the fast moving average is above the slow moving average, from 4 to 10 consecutive bullish Renko bars are displayed, followed by no more than 2 bearish and one bullish Renko bars; the sell signal is formed if the fast moving average is below the slow moving average, from 4 to 10 conse
The indicator displays renko bars on a chart, use them to plot MACD histogram and provides buy/sell signals: signal of MACD histogram crossing its signal line; signal of MACD histogram crossing the line 0. Renko is a non-trivial price display method. Instead of displaying each bar within a time interval, only the bars where the price moved a certain number of points are shown. Renko bars do not depend on a time interval, therefore the indicator works on any timeframe without losing its efficienc
The indicator displays renko bars on a chart, uses them to plot the fast and slow moving average and Stochastic, as well as it provides buy/sell signals: a buy signal is generated when the fast moving is above the slow one, and the signal line of Stochastic crosses the lower level from bottom up; a sell signal is generated when the fast moving is below the slow one, and the signal line of Stochastic crosses the upper level from top to bottom; Renko is a non-trivial price display method. Instead
The indicator displays Renko bars on the chart and uses them to plot the ZigZag - trend lines connecting the local Lows and Highs of the price movement. Renko - specialized display of the price action, in which the graph is displayed not every bar of the time frame, but only under the condition that the price had passed more than the specified number of points. Renko bars are not bound to a time frame, so the indicator can work on any time frame with the same efficiency. This implementation of t
The indicator displays Renko bars on the chart, uses them to plot the ZigZag - trend lines connecting the local Lows and Highs of the price movement, and highlights them based on the Gartley patterns, showing the potential price reversal points. Renko - specialized display of the price action, in which the graph is displayed not every bar of the time frame, but only under the condition that the price had passed more than the specified number of points. Renko bars are not bound to a time frame, s
The indicator displays renko bars on a chart, uses them to plot the MACD oscillator and determines the divergence conditions (divergences of price movements and oscillator values). The buy/sell signal is formed if the next High/Low price is not confirmed by the oscillator values. The ZigZag indicator is used to evaluate the extremums. Only the last 3 peaks are taken into account (see the screenshot). If peak 1 is higher than peak 2 or peak 3, and at the same time the macd value is lower, then a
The indicator displays renko bars on a chart and uses them to create ZigZag indicator - trend lines connecting local price movement Highs and Lows. The indicator, in turn, is used to create AB=CD displaying potential price reversal points. Renko is a non-trivial price display method. Instead of displaying each bar within a time interval, only the bars where the price moved a certain number of points are shown. Renko bars do not depend on a time interval, therefore the indicator works on any time
The indicator calculates and displays renko bars using MA and PSAR data as well as provides buy/sell signals. Renko is a non-trivial price display method. Instead of displaying each bar within a time interval, only the bars where the price moved a certain number of points are shown. Renko bars do not depend on a time interval, therefore the indicator works on any timeframe without losing its efficiency. Buy signal forms when PSAR readings are moving down, MA is moving up, the price is closing ab
The indicator displays Renko bars on the chart, uses their data to calculate and display the moving average, PriceChannel and generates buy/sell signals. Renko is a non-trivial price display method. Instead of displaying each bar within a time interval, only the bars where the price moved a certain number of points are shown. Renko bars do not depend on a time interval, therefore the indicator works on any timeframe without losing its efficiency. The PriceChannel indicator displays the upper, lo
The indicator displays Renko bars on the chart, uses their data to calculate and display the Bollinger Bands, MACD oscillator and generates buy/sell signals. Renko is a non-trivial price display method, in which a bar within a time interval is shown on the chart only if the price has moved a certain number of points. Renko bars do not depend on a time interval, therefore the indicator works on any timeframe without losing its efficiency. When attached to a chart, the indicator checks for presenc
フィルタ:
Oaktree
25
Oaktree 2019.02.14 12:28 
 

ユーザーは評価に対して何もコメントを残しませんでした

sunnychow
9043
sunnychow 2018.12.16 14:48 
 

ユーザーは評価に対して何もコメントを残しませんでした

Matthew Todorovski
13133
Matthew Todorovski 2018.06.30 15:01 
 

ユーザーは評価に対して何もコメントを残しませんでした

Arsen Kocharjan
36
Arsen Kocharjan 2017.09.17 14:27 
 

ユーザーは評価に対して何もコメントを残しませんでした

Gennadiy Voltornist
11909
Gennadiy Voltornist 2017.09.16 19:21 
 

ユーザーは評価に対して何もコメントを残しませんでした

Kostbar
513
Kostbar 2016.09.25 15:55 
 

ユーザーは評価に対して何もコメントを残しませんでした

Maksym Mudrakov
30050
Maksym Mudrakov 2016.08.31 08:12 
 

ユーザーは評価に対して何もコメントを残しませんでした

レビューに返信