Signal Moving Average Lux Algo MT4
- 지표
-
Lorentzos Roussos
 🎱🏓🎷💚☕️
💎 The simplest Neural Network Coding Guide : https://www.mql5.com/en/blogs/post/752324 - 버전: 1.0
MT5용 신호 이동 평균 Lux 알고리즘
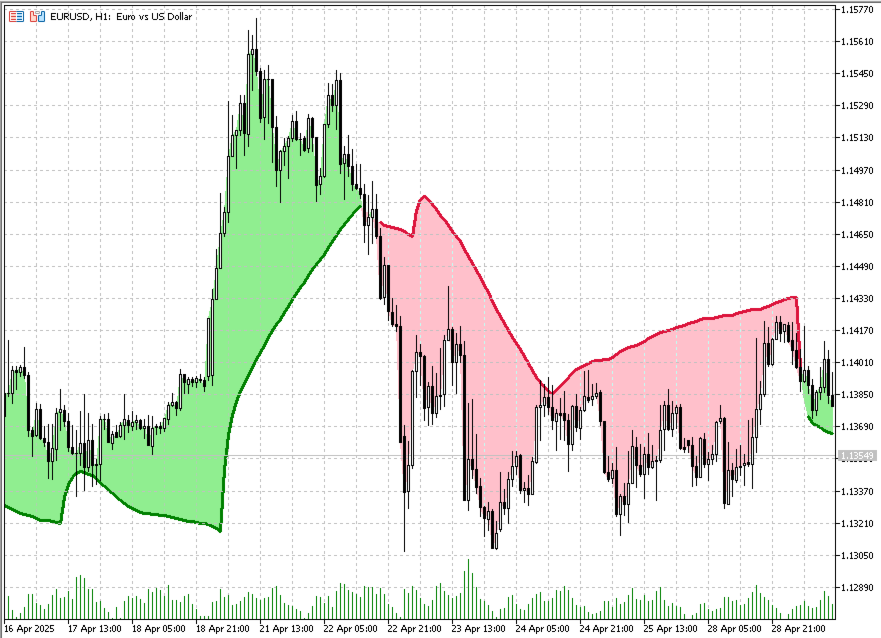
이동 평균 교차 시스템에서 신호선 사용을 위해 특별히 설계된 고유한 이동 평균 지표를 만나보세요. 이 고급 도구는 범위가 좁은 시장에서는 가격에서 벗어나는 반면, 추세가 있는 시장에서는 표준 이동 평균을 면밀히 반영한다는 점에서 차별화됩니다. 이러한 특징은 트레이더가 시장 변동으로 인한 불필요한 노이즈와 잠재적인 과매도를 방지하는 데 도움이 됩니다.
이동 평균은 범위가 좁은 시장에서는 가격에서 벗어나고, 추세가 있는 시장에서는 일반 이동 평균값에 도달합니다.
이동 평균 교차 전략은 일반적인 추세를 파악하는 데 사용되는 느린 이동 평균인 "신호선"에 의존하는 경우가 많습니다. 이 신호선은 빠른 이동 평균과 함께 사용되어 일반 가격과 신호선의 교차에서 발생할 수 있는 휩소 거래를 걸러냅니다.
제안된 지표는 범위가 좁은 기간 동안 가격에서 벗어나지 않으므로 가격과 신호선 사이에 발생하는 교차 횟수를 효과적으로 줄일 수 있습니다.
가격과 신호선 사이 영역의 색상은 신호선을 기준으로 한 가격의 위치에 따라 결정되며, 녹색 지표는 신호선보다 가격이 높은 것을 나타냅니다.
그러나 신호선의 색상은 시장이 추세를 보이는지, 아니면 등락을 보이는지를 고려하여 결정되며, 시장이 추세를 보일 때만 변경됩니다.
Lux Algo에서 트레이딩 뷰를 위해 개발한 지표입니다.