Symbol Switcher MT4
- インディケータ
-
Sopheak Khlot
 私はフルタイムのFXトレーダーであり、MQL開発者でもあります。EA開発サービスを提供しています。
無料インジケーター&EA:https://t.me/bestforexscript - バージョン: 1.0
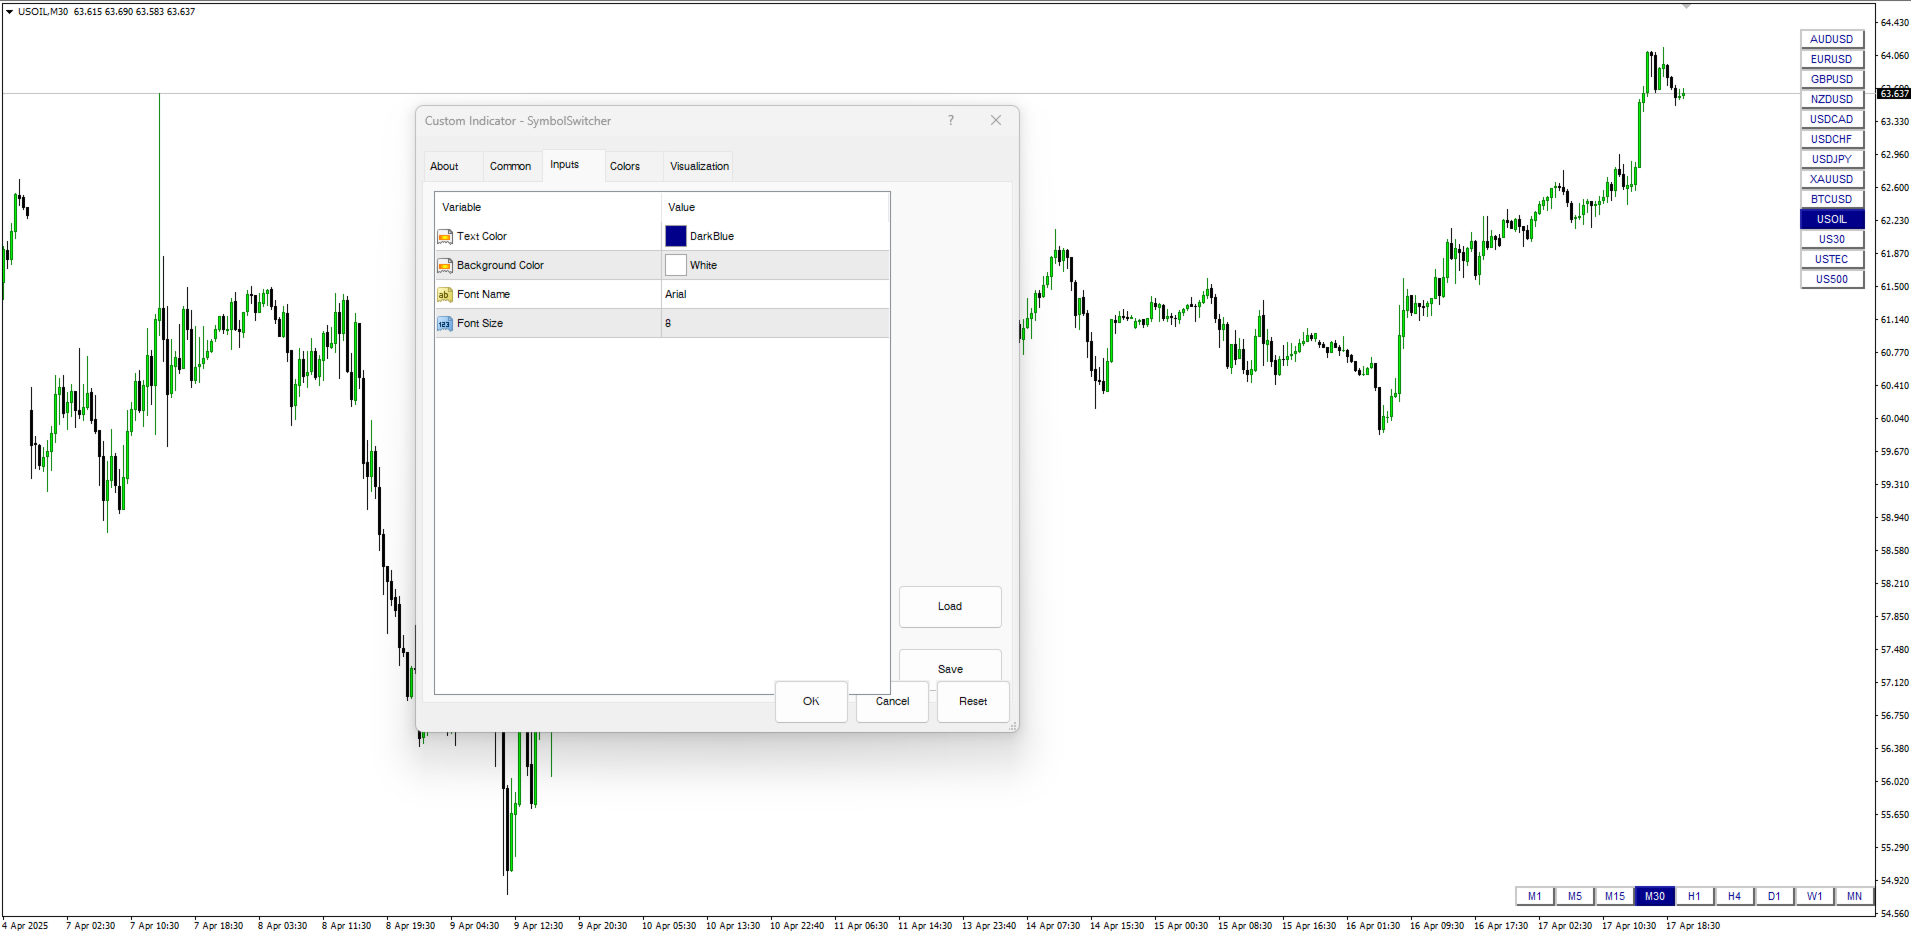
As the suggested, with this indicator you are able to switch from one symbol or timeframe to another in the same single chart. So forget about opening tons of chart on your screen!
It's not designed for ICT or SMC trader, but if you are that kind of trader you still can use it. Imagine you have a strategy containing various indicators and settings, on a single chart you can screen the entry opportunity then move to the next symbol or timeframe.