BB vector dynamics indicator

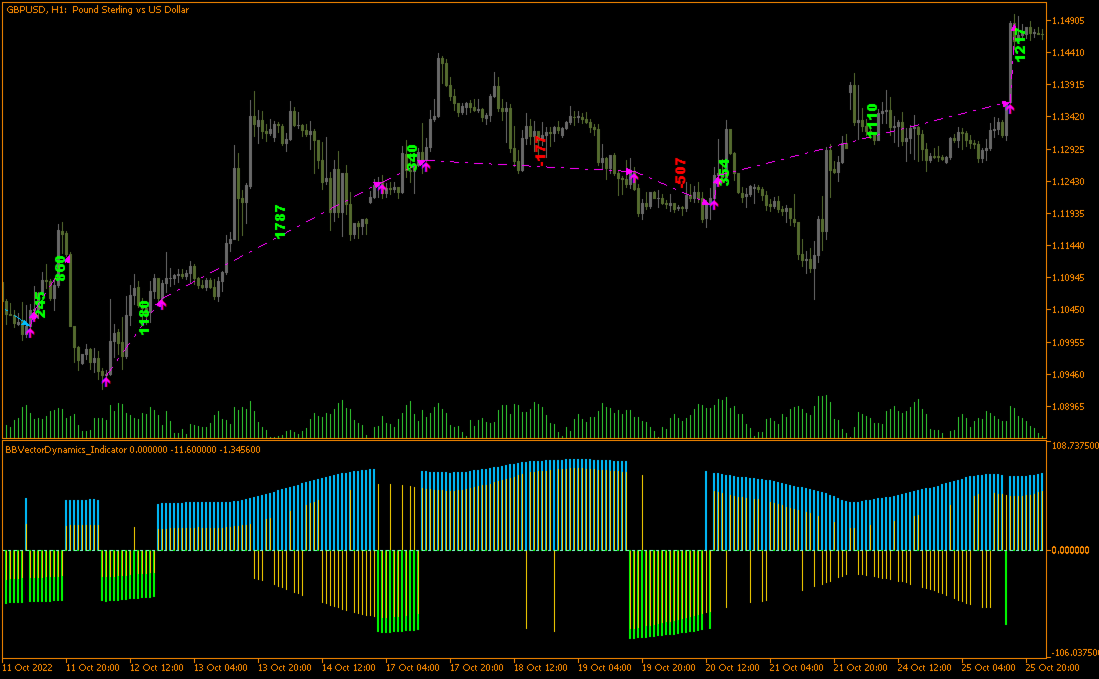
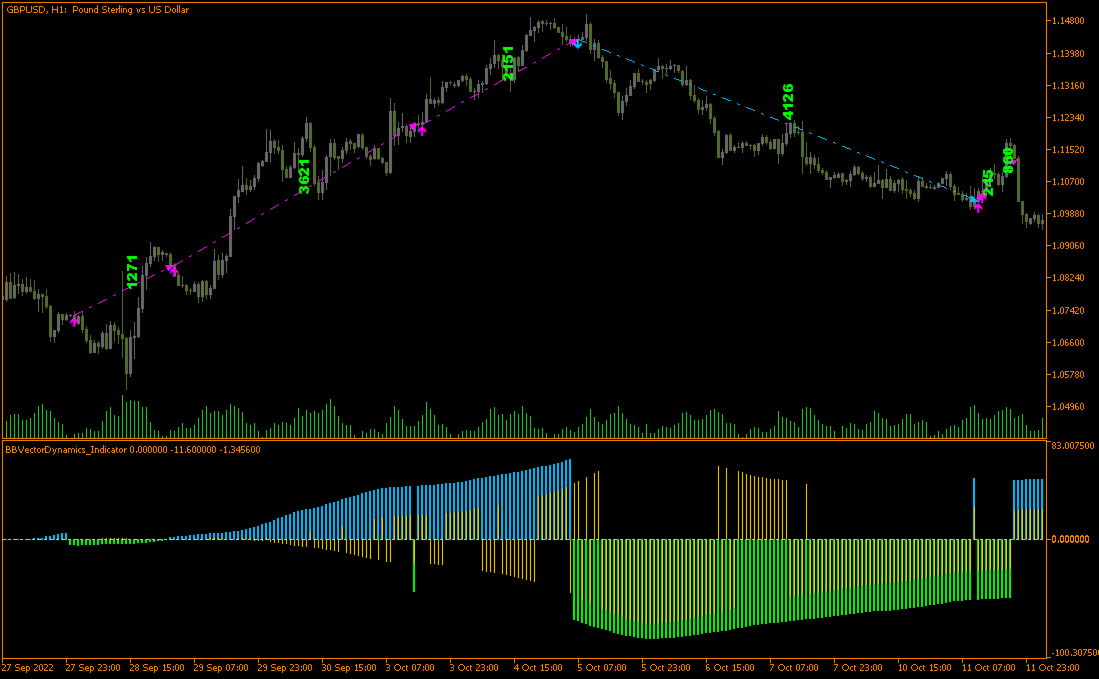
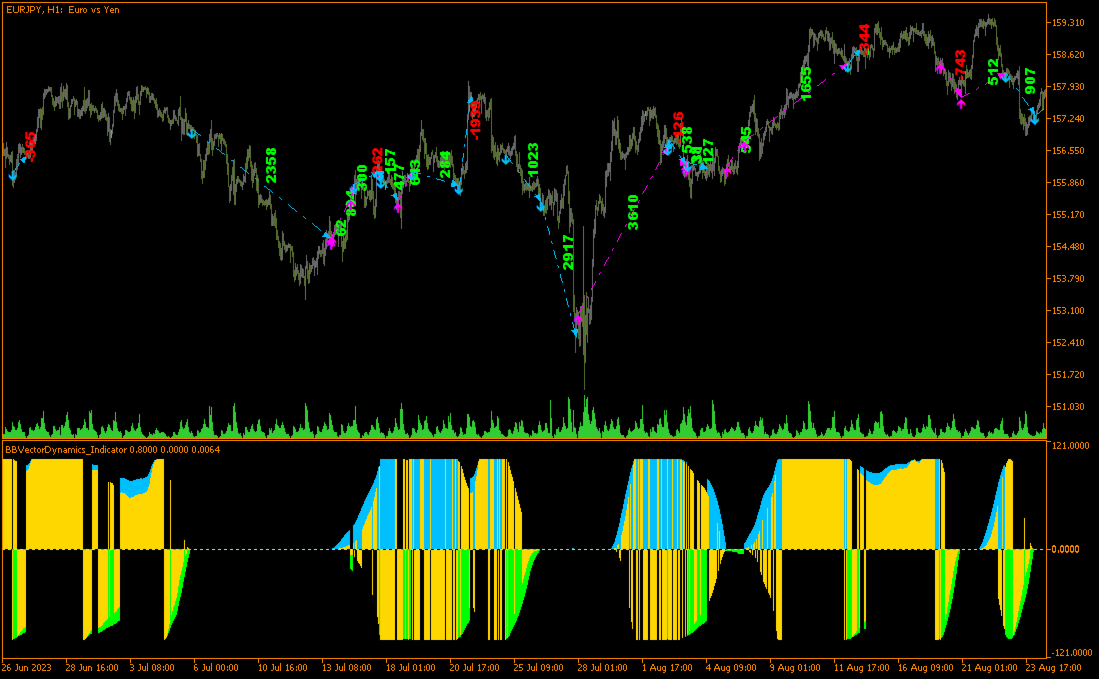
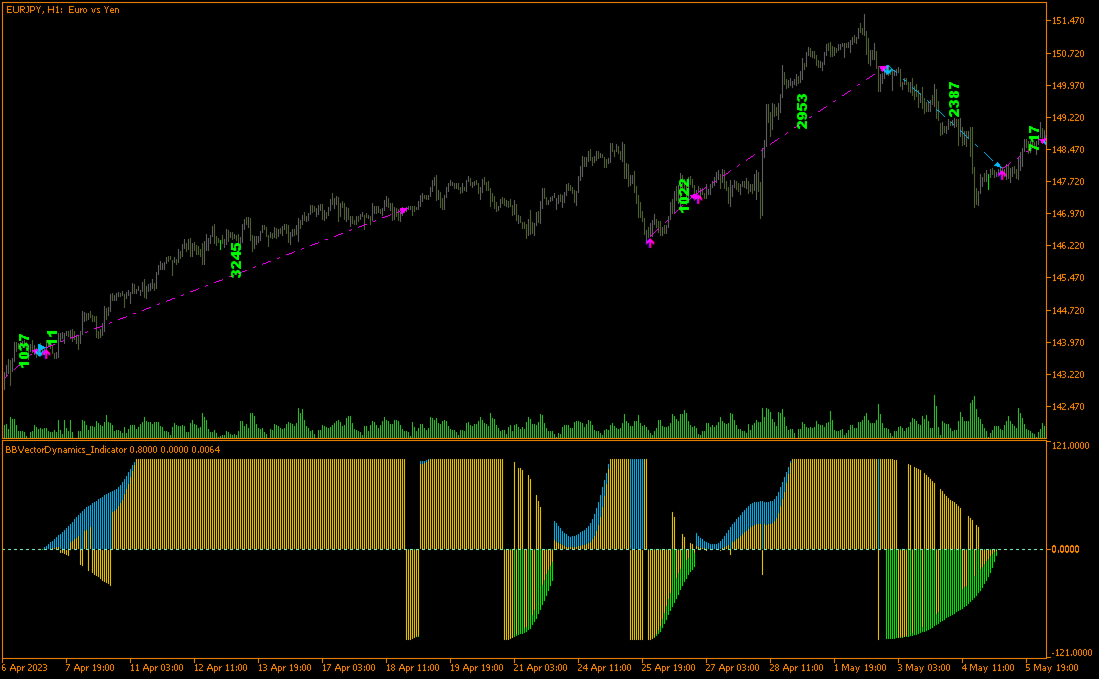
BBVectorDynamics_indicator is an innovative trading system specifically designed for volatile markets. Based on unique algorithms for analyzing market forces and identifying imbalances between buyers and sellers, this system helps you make precise and well-considered decisions in the trading process.

Main features of the bb vector dynamics_indicator:

  • Calculation of dynamic vectors. System determines the differences between the extreme price values and smoothed averages over a specified period. This process allows for a more accurate assessment of the current market state, detecting imbalances between buying and selling activities, and predicting potential trend reversals.
  • Analysis of market's force dynamic. Changes in the values reflecting market participants' activity are evaluated. An increase in one value reflects growing buyer pressure, while a decrease in another value indicates an increasing role of sellers. These data help determine the dominant direction of market movement and find optimal moments to exit the market.
  • Additional filtering of trend data. Market indicator changes are compared with price movement dynamics. Discrepancies between these factors facilitate forecasting shifts in the current trend. Identifying such moments helps close positions timely and minimize risks.
  • Filter for confirming stable trends. The stability of certain market indicator values over extended periods is analyzed. This confirms the stability of the current market trend, ensuring confidence in its further development. This information is necessary for maintaining open positions or planning new trades within the existing trend.
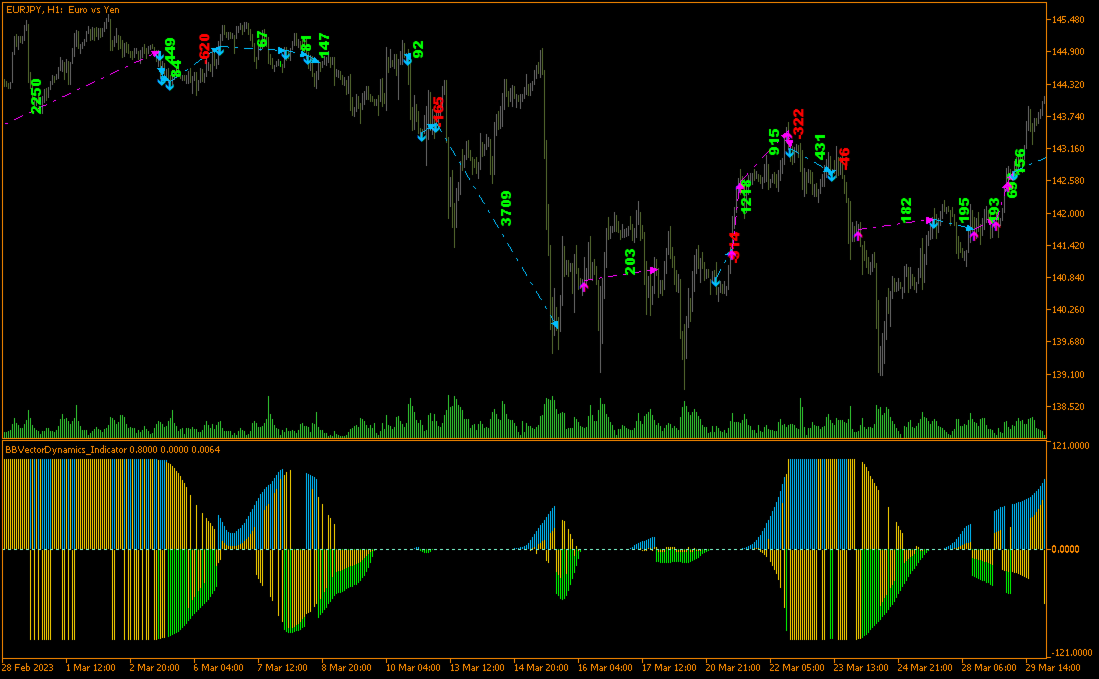
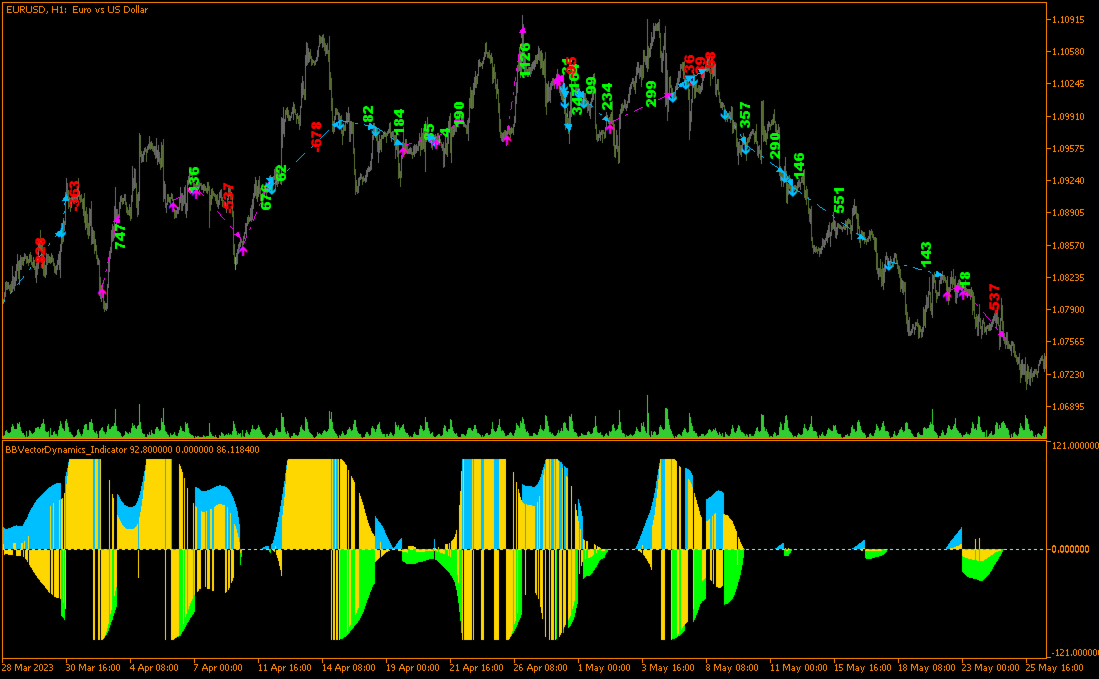
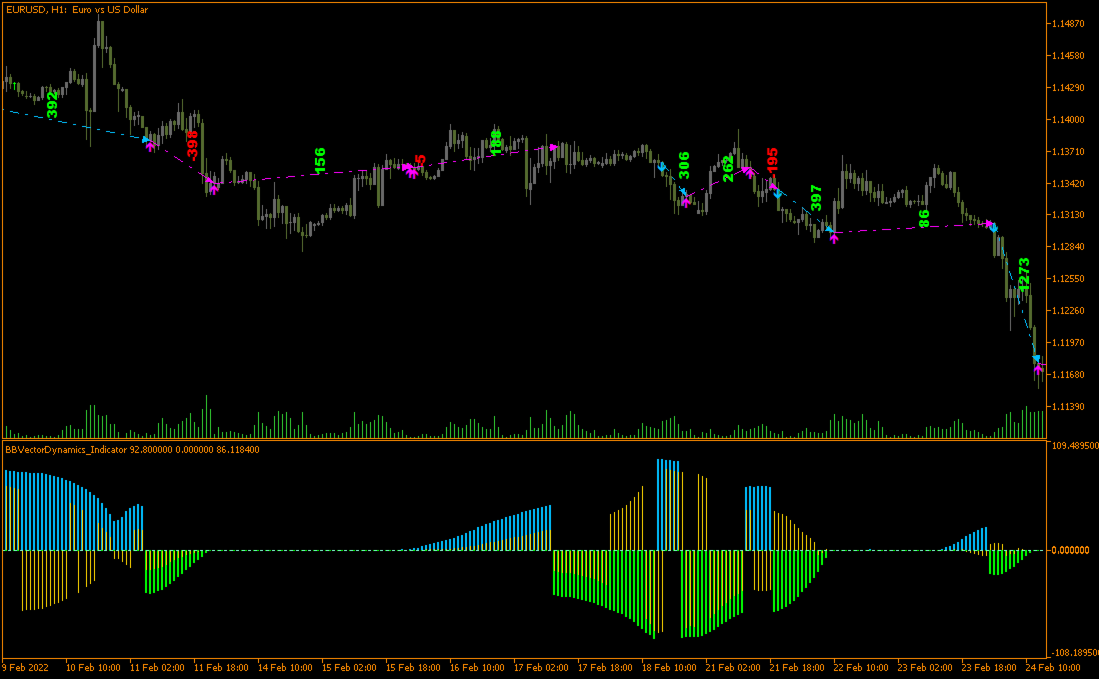
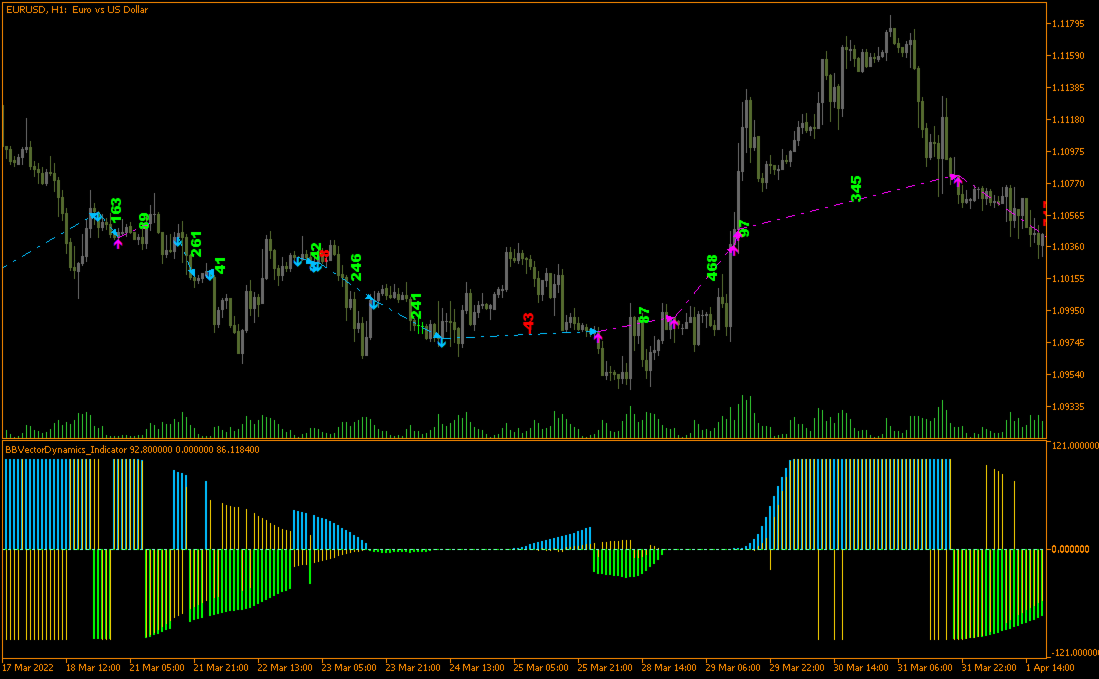
  • The system is intended for trading with dynamic, volatile markets. It focuses on highly volatile currency pairs: EURUSD, GBPUSD, and EURJPY, providing a steady flow of quality trading signals. Trading is possible on timeframes H1, H2, H3, and H4, allowing adaptation to various market conditions.


おすすめのプロダクト
SMC Venom Model BPR インジケーターは、スマート マネー (SMC) コンセプトで取引するトレーダー向けのプロフェッショナル ツールです。価格チャート上の 2 つの主要なパターンを自動的に識別します。 FVG   (フェアバリューギャップ) は、3 本のローソク足の組み合わせで、最初のローソク足と 3 番目のローソク足の間にギャップがあります。ボリュームサポートのないレベル間のゾーンを形成し、価格修正につながることがよくあります。 BPR   (バランス価格範囲) は、2 つの FVG パターンの組み合わせで、「ブリッジ」を形成します。これは、価格がボリュームアクティビティの少ない動きで動くときに、ブレイクアウトしてレベルに戻るゾーンで、ローソク足の間にギャップを作成します。 これらのパターンは、大規模な市場プレーヤーと一般参加者の相互作用が発生するチャート上のボリュームと価格動向の分析に基づいて、トレーダーが主要なサポート/レジスタンス レベル、ブレイクアウト ゾーン、エントリ ポイントを識別するのに役立ちます。 インジケーターは、長方形と矢印の形でパターンを視覚
Indicator Name: Fibaction – price action candle Detector Description: Fibo Signal Boxes is a powerful Smart Money Concept (SMC)-inspired indicator that auto-detects price action candles. bullish hammers and shooting stars, then draws precise Fibonacci entry zones and multiple take-profit levels directly on the chart. as for the SL personally i use 40 pips rules  Key Features: Detects bullish hammer and shooting star reversal candles. Automatically draws Fibonacci entry and TP boxes. as
Your Trend Friend
Luigi Nunes Labigalini
5 (1)
The trend is your friend! Look at the color of the indicator and trade on that direction. It does not  repaint. After each candle is closed, that's the color of the trend. You can focus on shorter faster trends or major trends, just test what's most suitable for the symbol and timeframe you trade. Simply change the "Length" parameter and the indicator will automatically adapt. You can also change the color, thickness and style of the lines. Download and give it a try! There are big movements w
Range Directional Force Indicator – Designed for You to Optimize! The Range Directional Force Indicator is a cutting-edge tool designed to empower traders by visualizing market dynamics and directional strength. Built to offer insights into market trends and reversals, this indicator is an invaluable asset for traders seeking precision in their strategies. However, it is important to note that this indicator is not optimized, leaving room for you to tailor it to your unique trading preferences.
Awesome Oscillator by Bill Williams with the ability to fine-tune and replace the averaging algorithms of the indicator, which significantly expands the possibilities of using this oscillator in algorithmic trading and brings it closer in its properties to such an indicator as the MACD. To reduce price noise, the final indicator is processed with an additional Smooth averaging. The indicator has the ability to give alerts, send mail messages and push signals when the direction of movement of th
ETE Detector v4.0 (Head & Shoulders) Author: KOUAME N’DA LEMISSA Version: 4.0 Platform: MetaTrader 5 Indicator Type: Chart / Visual Trading Signals Overview The ETE Detector v4.0 is a technical indicator designed to automatically detect classic and inverse Head & Shoulders patterns (H&S) on MT5 charts. These patterns are widely used to anticipate trend reversals. With this tool, traders can: Detect sell signals (classic H&S) and buy signals (inverse H&S) with accuracy. Easily visualize patterns
Basic Support and Resistance   インジケータは、テクニカル分析を強化するために必要なソリューションです。このインジケータを使用すると、チャートにサポートレベルとレジスタンスレベルを投影できます/ mt4バージョン 機能 フィボナッチレベルの統合: サポートと抵抗レベルとともにフィボナッチレベルを表示するオプションを使用すると、私たちの指標は市場行動と逆転領域の可能性についてさらに深い洞察を提供します。 パフォーマンスの最適化: 各バーの開口部のみで拡張ラインを更新するオプションを使用すると、インジケータは、サポートレベルと抵抗レベルの精度を犠牲にすることなく最適なパフォーマンスを保証します。 入力 メイン設定 Timeframe:  この入力を通じて、より高い時間枠のサポートラインとレジスタンスラインをチャート上に表示することを選択できます。 Support/Resistance Strength [Number of Bars]:   この入力を使用して、サポートと抵抗の強度を決定できます。数が高いほど、サポート/抵抗がより強くなります。 Pric
Noize Absorption Index - is the manual trading system that measures the difference of pressure between bears forces and bulls forces. Green line - is a noize free index that showing curent situation. Zero value of index shows totally choppy/flat market.Values above zero level shows how powerfull bullish wave is and values below zero measures bearish forces.Up arrow appears on bearish market when it's ready to reverse, dn arrow appears on weak bullish market, as a result of reverse expectation.
PipFinite Exit EDGE MT5
Karlo Wilson Vendiola
4.87 (31)
Did You Have A Profitable Trade But Suddenly Reversed? In a solid strategy, exiting a trade is equally important as entering. Exit EDGE helps maximize your current trade profit and avoid turning winning trades to losers. Never Miss An Exit Signal Again Monitor all pairs and timeframes in just 1 chart www.mql5.com/en/blogs/post/726558 How To Trade You can close your open trades as soon as you receive a signal Close your Buy orders if you receive an Exit Buy Signal. Close your Sell orders if
Visual CrossPulse Dynamics: Trade with the Market's True Rhythm Unlock a new level of market insight with Visual CrossPulse Dynamics, a sophisticated trading indicator designed to adapt to ever-changing volatility and reveal the true direction of the trend. Are you tired of indicators that lag in fast-moving markets or give false signals during consolidation? The Visual CrossPulse Dynamics indicator solves this problem by using an advanced, adaptive algorithm that intelligently adjusts to the m
これはほぼ間違いなく、MetaTraderプラットフォームで見つけることができる最も完全な調和価格形成自動認識インジケーターです。 19種類のパターンを検出し、フィボナッチプロジェクションをあなたと同じように真剣に受け止め、潜在的逆転ゾーン(PRZ)を表示し、適切なストップロスとテイクプロフィットレベルを見つけます。 [ インストールガイド | 更新ガイド | トラブルシューティング | よくある質問 | すべての製品 ] 19の異なる調和価格形成を検出します プライマリ、派生および補完フィボナッチ投影(PRZ)をプロットします 過去の価格行動を評価し、過去のすべてのパターンを表示します この指標は、独自の品質とパフォーマンスを分析します 適切なストップロスとテイクプロフィットのレベルを表示します ブレイクアウトを使用して適切な取引を通知します すべてのパターン比をグラフにプロットします 電子メール/音声/視覚アラートを実装します スコット・M・カーニーの本に着想を得て、この指標は最も純粋で急を要するトレーダーのニーズを満たすように設計されています。ただし、トレードを容易にする
Stratos Pali Indicator is a revolutionary tool designed to enhance your trading strategy by accurately identifying market trends. This sophisticated indicator uses a unique algorithm to generate a complete histogram, which records when the trend is Long or Short. When a trend reversal occurs, an arrow appears, indicating the new direction of the trend. Important Information Revealed Leave a review and contact me via mql5 message to receive My Top 5 set files for Stratos Pali at no cost ! Down
まず第一に、この取引ツールはノンリペイント、ノンリドロー、ノンラグの指標であり、プロの取引に理想的ですことを強調する価値があります。 オンラインコース、ユーザーマニュアル、デモ。 スマートプライスアクションコンセプトインジケーターは、新米から経験豊富なトレーダーまで、非常 に強力なツールです。Inner Circle Trader AnalysisやSmart Money Concepts Trading Strategiesなど、20以上の有用な指標を1つに組み合わせています。このインジケーターはスマートマネーコンセプトに焦点を当て、大手機関の取引方法を提供し、彼らの動きを予測するのに役立ちます。 特に、流動性分析に優れており、機関がどのように取引しているかを理解しやすくしています。市場のトレンドを予測し、価格の動きを慎重に分析するのに優れています。機関の戦略とトレードを合わせることで、市場の動向についてより正確な予測ができます。このインジケーターは多目的であり、市場構造を分析し、重要な注文ブロックを特定し、さまざまなパターンを認識するのに優れています。 このインジケーター
MT4版  |  FAQ Owl Smart Levels Indicator は、 Bill Williams の高度なフラクタル、市場の正しい波構造を構築する Valable ZigZag、エントリの正確なレベルをマークする Fibonacci レベルなどの一般的な市場分析ツールを含む 1 つのインジケーター内の完全な取引システムです。 利益を得るために市場と場所に。 戦略の詳細な説明 インジケータを操作するための指示 顧問-取引助手 プライベートユーザーチャット ->購入後に私に書いて、私はプライベートチャットにあなたを追加し、あなたはそこにすべてのボーナスをダウンロードすることができます 力はシンプルさにあります! Owl Smart Levels 取引システムは非常に使いやすいので、専門家にも、市場を勉強し始めて自分で取引戦略を選択し始めたばかりの人にも適しています。 戦略と指標に秘密の数式や計算方法が隠されているわけではなく、すべての戦略指標は公開されています。 Owl Smart Levels を使用すると、取引を開始するためのシグナルをすばやく確認し、注文を出すための
DAILY OH/OL SDEV QUANT MODEL - STATISTICAL TRADING WITH PRECISION RISK MANAGEMENT TRADE WITH MATHEMATICAL CERTAINTY - KNOW YOUR EXACT STOP-LOSS AND TAKE-PROFIT BEFORE YOU ENTER This indicator analyzes 5,000+ days of price history to give you: Exact entry levels (sigma bands locked at daily open) Exact stop-loss distance (from M
Provided Trend is a complex signal formation indicator. As a result of the work of internal algorithms, you can see only three types of signals on your chart. The first is a buy signal, the second is a sell signal, and the third is a market exit signal. Options: CalcFlatSlow - The first parameter that controls the main function of splitting the price chart into waves. CalcFlatFast - The second parameter that controls the main function of splitting the price chart into waves. CalcFlatAvg - Para
プレミアムレベルは、正しい予測の精度が80%を超える独自の指標です。 この指標は、最高のトレーディングスペシャリストによって2か月以上テストされています。 あなたが他のどこにも見つけられない作者の指標! スクリーンショットから、このツールの正確さを自分で確認できます。 1は、1キャンドルの有効期限を持つバイナリーオプションの取引に最適です。 2はすべての通貨ペア、株式、商品、暗号通貨で機能します 手順: 赤い矢印が表示されたらすぐにダウントレードを開き、青い矢印が表示されたら閉じます。青い矢印の後に開くこともできます。 試してテストしてください!推奨設定はデフォルトです! 日足チャートで最高の精度を示します! インディケータは、2600 Pipsの収益性に対して、約10Pipsという非常に小さなマージンを使用します。
Crypto_Forex インジケーター   PINBAR パターン MT5用。リペイントなし、遅延なし。 - インジケーター「PINBARパターン」は、プライスアクション取引に非常に強力なインジケーターです。 - インジケーターはチャート上のピンバーを検出します。 - 強気のピンバー - チャート上に青い矢印シグナルを表示します(画像参照)。 - 弱気のピンバー - チャート上に赤い矢印シグナルを表示します(画像参照)。 - PC およびモバイルのアラート付き 。 - インジケーター「PINBARパターン」は、サポート/レジスタンスレベルと組み合わせるのに最適です。 高品質のトレーディングロボットとインジケーターをご覧になるにはここをクリックしてください! これは、このMQL5ウェブサイトでのみ提供されるオリジナル製品です。
インジケーター技術仕様 – Delta Profile for MetaTrader 5 Delta Profile は MetaTrader 5 用に開発されたインジケーターで、指定されたローソク足範囲内の出来高フローを詳細に分析するためのものです。異なる価格レベルにおける正の出来高(上昇に関連)と負の出来高(下降に関連)の不均衡を構造化し、可視化します。その結果、ユーザーは最も多くの取引が集中する価格帯や実際の市場不均衡が形成される領域を明確に把握できます。 以下に、本インジケーターの主要な技術特性と設定パラメータを示します。 基本コンセプト インジケーターは 価格レベル を識別し、それらを正の出来高、負の出来高、および純 Delta(正負の出来高差)に分類します。 各価格レベルは 水平バー としてチャートに表示され、市場の活動ゾーンや不均衡領域を視覚的に確認できます。 ユーザーは 分析対象ローソク足数 、 価格の丸め精度 、 最大表示レベル数 、および 表示スタイル を自由に設定できます。 主要機能 価格レベルのマッピング :設定された精度に基づき価格を丸め、対応するローソク足の
DYJ BoS インジケーターは、次のような市場構造の変化の主な要素を自動的に識別してマークします。 構造のブレイクアウト (BoS): 価格が大きく変動し、構造の前のポイントを突破したときに発生します。 彼は上昇トレンドと下降トレンドの可能性のあるライン(UP と DN、つまり連続した新高値と新安値)をマークし、価格がこれらのラインを突破すると、赤(弱気)と緑(強気)の矢印でマークします。 BoS は通常、価格が以前の価格変動によって確立されたスイング安値または高値を決定的に突破したときに発生します。価格がスイング高値を上回ったりスイング安値を下回ったりすると、単に以前に形成された市場構造から抜け出すだけなので、「ブレイクアウト」構造と呼ばれます。これは多くの場合、市場センチメントとトレンドの方向の変化を示し、既存のトレンドの継続または新しいトレンドの始まりを示唆します。 ポジションのクローズの精度を高めるために、通常はストップロスとテイクプロフィットを設定しないことが推奨されます。最終ポジションは通常、同じ方向の次のブレイクスルー ポイント、または反対方向のブレイクスルー
A powerful oscillator that provide Buy and Sell signals by calculating the investor liquidity. The more liquidity the more buy possibilities. The less liquidity the more sell possibilities. Please download the demo and run a backtest! HOW IT WORKS: The oscillator will put buy and sell arrow on the chart in runtime only . Top value is 95 to 100 -> Investors are ready to buy and you should follow. Bottom value is 5 to 0 -> Investors are ready to sell and you should follow. Alert + sound will appe
KT Renko Patterns は、レンコチャートの各レンガをスキャンしながら、さまざまな金融市場でトレーダーによく使用されている有名なチャートパターンを検出します。 時間ベースのチャートと比較して、レンコチャートは視認性が高くシンプルなため、パターンベースのトレードがより簡単かつ明確になります。 KT Renko Patterns は複数のレンコパターンを搭載しており、その多くは Prashant Shah 氏の著書『Profitable Trading with Renko Charts』でも詳しく解説されています。 KT Renko Patterns インジケーターに基づいた 100% 自動化された EA は、こちらからご利用いただけます - KT Renko Patterns EA 。 機能一覧 最大8種類の明確なレンコパターンを表示し、あいまいさなく取引をサポートします。 完全な客観性を保つため、すべてのパターンにストップロスとフィボナッチターゲットが設定されています。 KT Renko Patterns は各パターンの精度を継続的に測定し、重要な統計情報をチャート
Equinox Gold
Dmitriq Evgenoeviz Ko
Equinox Gold is a high-tech trading expert advisor (EA) specifically designed for the gold market ( XAUUSD ). The system is based on a unique Market Equilibrium algorithm that identifies areas of imbalance between supply and demand during extreme volatility. Unlike most robots that use dangerous sit-and-wait methods, Equinox Gold relies on mathematical momentum confirmation and strict risk control for every trade. MAIN ADVANTAGES VRP Filter (Volatility Range Filter): The robot automatically ada
Gann Time–Price Square Cycles (MT5) このインジケーターは、W.D. Gann が提唱した「時間と価格のバランス」という概念を応用しています。 チャート上のスイングを検出し、 Quarter, Half, Full サイクルの時間間隔を将来に向けて投影し、垂直線で表示します。 このツールは、トレーダーがスイングの大きさと経過時間の関係を、MT5チャート上で直接研究できるよう設計されています。 機能 PivotDepth と最小スイングサイズに基づき、スイングの高値・安値を検出。 Quarter, Half, Full の調和的な時間間隔を投影。 計算されたサイクルポイントを示す垂直線を描画。 インジケーターを削除するまで、描画されたラインはチャート操作中も保持。 特徴 Quarter, Half, Full サイクルごとに独立した PivotDepth と MinSwingSize パラメータを設定可能。 新しいバー生成時、シンボル変更、タイムフレーム変更時に自動更新。 最大 5000 本の履歴バーを処理できる設計。 同じチャートに複数インスタンスを
US30NinjaMT5
Satyaseelan Shankarananda Moodley
US30 Ninja is a 5 minute scalping indicator that will let know you when there is a trade set up (buy or sell). Once the indicator gives the trade direction, you can open a trade and use a 30 pip stop loss and a 30 pip to 50 pip take profit. Please trade at own own risk. This indicator has been created solely for the US30 market and may not yield positive results on any other pair. 
Was: $249  Now: $99   Market Profile defines a number of day types that can help the trader to determine market behaviour. A key feature is the Value Area, representing the range of price action where 70% of trading took place. Understanding the Value Area can give traders valuable insight into market direction and establish the higher odds trade. It is an excellent addition to any system you may be using. Inspired by Jim Dalton’s book “Mind Over Markets”, this indicator is designed to suit the
TriParity AfterShock Catcher TriParity AfterShock Catcher is the execution-side tool of the TriParity workflow. It helps you turn a selected “aftershock regime” into a repeatable trading decision with defined Entry / TP / SL and baseline stats—without relying on predictions or “guaranteed mean reversion.” Important: This is NOT triangular arbitrage execution . TriParity AfterShock Catcher trades the aftershock (time-lag / overshoot → convergence) that can appear after interbank parity correcti
This indicator uses a mathematical calculation algorithm . This algorithm calculates the remainder between the updated model and the actual values and produces the possible progress of the graph on the graph. It is not a super prophet in trading, but it is very good for the trader when entering the market and to analyze it before entering. Applicable for all currencies. Данный индикатор использует алгоритм математических вычислений . Данный алгоритм вычисляет остаток между обновленной моделью и
回帰取引を意味する専門的かつ定量的なアプローチを実装する独自の指標。これは、価格が予測可能かつ測定可能な方法で迂回して平均に戻るという事実を利用しており、非定量的な取引戦略を大幅に上回る明確な出入りルールを可能にします。 [ Installation Guide | Update Guide | Troubleshooting | FAQ | All Products ] 明確な取引シグナル 驚くほど簡単に取引できます カスタマイズ可能な色とサイズ パフォーマンス統計を実装します ほとんどの取引戦略を上回ります 適切なSLおよびTPレベルを表示します 電子メール/音声/視覚アラートを実装します 使い方 インディケータは、より高い時間枠からの完全にカスタマイズ可能な移動平均の周りの標準偏差を測定し、トレンドフォローアプローチを使用して正確に取引を見つけます。取引は、現在のチャートの価格アクションに飛び込むことによって見つけられ、価格が選択したより高い時間枠から計算された平均価格帯に戻ったときに閉じられます。それがコード化される方法のために、指標は高ボラティリティと強いトレンドの市場か
ADVANCED FUNCTIONALITIES: Trend Score (0-100) with visual bar Intelligent signals with adjustable strength (1-10) Risk management with automatic TP/SL Audible and visual alerts Price zones with smooth filling Multi-indicator analysis (RSI, ATR, BB, EMAs) DESIGN FEATURES Modern Visual: Smooth and well-spaced lines (EMA with 2-3px width) Vibrant and professional colors (Sky Blue, Orange, Gold) Modern arrows (code 233/234) for buy/sell signals Configurable dark/light theme Adjustable transparency f
このプロダクトを購入した人は以下も購入しています
ARIPoint is a powerful trading companion designed to generate high-probability entry signals with dynamic TP/SL/DP levels based on volatility. Built-in performance tracking shows win/loss stats, PP1/PP2 hits, and success rates all updated live. Key Features: Buy/Sell signals with adaptive volatility bands Real-time TP/SL/DP levels based on ATR Built-in MA Filter with optional ATR/StdDev volatility Performance stats panel (Success, Profit/Loss, PP1/PP2) Alerts via popup, sound, push, or email Cu
note: this indicator is for METATRADER4, if you want the version for METATRADER5 this is the link:  https://www.mql5.com/it/market/product/108106 TRENDMAESTRO ver 2.5 TRENDMAESTRO recognizes a new TREND from the start, he never makes mistakes. The certainty of identifying a new TREND is priceless. DESCRIPTION TRENDMAESTRO identifies a new TREND in the bud, this indicator examines the volatility, volumes and momentum to identify the moment in which there is an explosion of one or more of these da
ARIScalp is a powerful trading companion designed to generate high-probability entry signals with dynamic TP/SL/DP levels based on volatility. Built-in performance tracking shows win/loss stats, PP1/PP2 hits, and success rates all updated live. Key Features: Buy/Sell signals with adaptive volatility bands Real-time TP/SL/DP levels based on ATR Built-in MA Filter with optional ATR/StdDev volatility Performance stats panel (Success, Profit/Loss, PP1/PP2) Alerts via popup, sound, push, or email Cus
ARICoin is a powerful trading companion designed to generate high-probability entry signals with dynamic TP/SL/DP levels based on volatility. Built-in performance tracking shows win/loss stats, PP1/PP2 hits, and success rates all updated live. Key Features: Buy/Sell signals with adaptive volatility bands Real-time TP/SL/DP levels based on ATR Built-in MA Filter with optional ATR/StdDev volatility Performance stats panel (Success, Profit/Loss, PP1/PP2) Alerts via popup, sound, push, or email Cust
AriX
Temirlan Kdyrkhan
AriX Indicator for MT5 A powerful trend-following and signal-evaluation tool AriX is a custom MT5 indicator that combines Moving Averages and ATR-based risk/reward logic to generate clear buy/sell signals. It visualizes dynamic SL/TP levels, evaluates past trade outcomes, and displays win/loss statistics in a clean on-chart panel. Key features include: Buy/Sell signals based on MA crossovers ATR-based SL/TP1/TP2/TP3 levels with visual lines and labels Signal outcome tracking with real-time stat
IVISTscalp5
Vadym Zhukovskyi
5 (6)
iVISTscalp5インジケーターをご紹介します。このインジケーターは、トレーディングにおいて独自でありながら効果的です。時間データに基づくこのインジケーターは、多年にわたる経験と金融市場の深い分析の結果です。iVISTscalp5インジケーターは、手動トレーディングにとって優れたツールです。便利さ、簡単さ、可視化 - すべての複雑さが内部に隠されています。私たちは、iVISTscalp5インジケーターの設定と使用を最大限に簡素化しました。このインジケーターは、MT5ターミナルにあるすべての金融商品に適しています。 稼働時間は、4時から20時(UTC+3)です。 iVISTscalp5インジケーターメニュー(スクリーンショット1を参照): History - 引用を計算する週数 dT_min - 時間間隔の選択(分) TFline - 水平ボリュームの作成(時間枠) BARSline - 水平ボリュームの作成(バー数) TFtrend1 - デイリーチャンネルの作成(時間枠) BARStrend1 - デイリーチャンネルの作成(バー数) TFtrend2 - 週次チャンネルの作成(時
Rtc ML Ai | Predictor CORE MACHINE LEARNING ENGINE Adaptive ML Market Predictor – Multi-Bar Trend & Candle Forecast What This Indicator Does This indicator is a  real-time market prediction engine  designed to analyze price behavior and estimate  future market tendencies . Unlike conventional indicators, this system  does not rely on static parameters or historical curve-fitting , but adapts its internal state dynamically during live market operation. Instead of using static rules, the indic
A tool for on-chart strategy backtesting and performance analysis. A utility for developing, debugging, and testing custom trading ideas and indicator functions. An indicator designed to quickly test trading concepts and visualize the effectiveness of different input parameters. An all-in-one sandbox for testing everything from simple crossovers to complex, multi-condition trading systems.
VTrende Pro
Andrii Diachenko
5 (1)
VTrende Pro - MTF indicator for trend trading with a display panel for MT5 *** Videos can be translated into any language using subtitles (video language - Russian) Although the signals of the VTrende Pro indicator can be used as signals of a full-fledged trading system, it is recommended to use them in conjunction with the Bill Williams TS. VTrende Pro is an extended version of the VTrende indicator. Difference between Pro version and VTrende: - Time zones - Signal V - signal 1-2 waves -    S
WARNING: This indicator is distributed EXCLUSIVELY on MQL5.com MT4 version:   https://www.mql5.com/it/market/product/160363 MT5 version:   https://www.mql5.com/it/market/product/160410 ============================================================================================= MAX RIBBON ver 1.00 The indicator that shows you the TREND clearly and unambiguously! ============================================================================================= DESCRIPTION MAX RIBBON is an advanced tre
##   ONLY GOLD ##   Тiльки Золото ## **Mercaria Professional Trading Zones - Complete Guide** ## **Mercaria Professional Trading Zones - Повний посібник** ### **How Mercaria Zones Work / Як працюють зони Mercaria** **English:** Mercaria Zones is an advanced trading indicator that identifies high-probability support and resistance areas using ZigZag extremes combined with mathematical zone calculations. The indicator works on multiple timeframes simultaneously, providing a comprehensive view
FXLAND Smart Reversal Indicator (MT5) FXLAND Smart Reversal Indicator is a professional technical analysis tool designed to help traders identify potential price reversal zones and key market turning points with clarity and precision. The best reversal indicator and price return by choosing only one ceiling or floor in each time frame A masterpiece of combining mathematics and Gann, fractal matrix, Fibonacci, movement angle and time. Completely intelligent Key Features Detects potenti
CGE Trading Suite
Carl Gustav Johan Ekstrom
5 (1)
CGE Trading Suite delivers the analytical edge typically reserved for professional trading desks—real-time capital flow analysis, cyclical timing models, and dynamic market structure mapping in a single integrated platform. Aggressive Signal: Rapid 200___READ DESCRIPTION FIRST Why CGE Trading Suite? The CGE Trading Suite empowers traders with structure, confidence, and consistent performance across all markets and time frames. Dashboard Instantly identify today's top and bottom movers with perc
A scalping indicator based on mathematical patterns, which on average gives signals with relatively small SL, and also occasionally helps to catch big moves in the markets (more information in the video) This indicator has three main types of notifications: The first type warns of a possible/upcoming signal on the next bar The second type indicates the presence of a ready signal to enter the market/open a position The third type is for SL and TP levels - you will be notified every time price re
Enigma 112 Indicator - User Manual Enigma 112 Indicator Complete User Manual - Ultimate Trading Solution Introduction The Enigma 112 is a comprehensive multi-timeframe trading indicator that combines advanced technical analysis concepts including Tesla 3-6-9 Gates, Huddleston Theory, PO3 Dealing Ranges, and sophisticated risk management systems. Tesla 3-6-9 Gates Based on Nikola Tesla's vortex mathematics for precise support and resistance levels Huddleston Theory Volume-based market
The Expert Advisor and the video are attached in the Discussion tab . The robot applies only one order and strictly follows the signals to evaluate the indicator efficiency. Pan PrizMA CD Phase is an option based on the Pan PrizMA indicator. Details (in Russian). Averaging by a quadric-quartic polynomial increases the smoothness of lines, adds momentum and rhythm. Extrapolation by the sinusoid function near a constant allows adjusting the delay or lead of signals. The value of the phase - wave s
Классификатор силы тренда. Показания на истории не меняет. Изменяется классификация только незакрытого бара. По идее подобен полной системе ASCTrend, сигнальный модуль которой, точнее его аппроксимация в несколько "урезанном" виде, есть в свободном доступе, а также в терминале как сигнальный индикатор SilverTrend . Точной копией системы ASCTrend не является. Работает на всех инструментах и всех временных диапазонах. Индикатор использует несколько некоррелируемых между собой алгоритмов для класси
FFx Universal Strength Meter PRO is more than a basic strength meter. Instead of limiting the calculation to price, it can be based on any of the 19 integrated strength modes + 9 timeframes. With the FFx USM, you are able to define any period for any combination of timeframes. For example, you can set the dashboard for the last 10 candles for M15-H1-H4… Full flexibility! Very easy to interpret... It gives a great idea about which currency is weak and which is strong, so you can find the best pai
The FFx Universal MTF alerter shows on a single chart all the timeframes (M1 to Monthly) with their own status for the chosen indicator. 9 indicators mode (MACD-RSI-Stochastic-MA-ADX-Ichimoku-Candles-CCI-PSAR). Each can be applied multiple times on the same chart with different settings. Very easy to interpret. Confirm your BUY entries when most of the timeframes are showing green color. And confirm your SELL entries when most of the timeframes are showing red color. 2 Alert Options : input to s
The FFx Watcher PRO is a dashboard displaying on a single chart the current direction of up to 15 standard indicators and up to 21 timeframes. It has 2 different modes: Watcher mode: Multi Indicators User is able to select up to 15 indicators to be displayed User is able to select up to 21 timeframes to be displayed Watcher mode: Multi Pairs User is able to select any number of pairs/symbols User is able to select up to 21 timeframes to be displayed This mode uses one of the standard indicators
FFx Patterns Alerter gives trade suggestions with Entry, Target 1, Target 2 and StopLoss .... for any of the selected patterns (PinBar, Engulfing, InsideBar, OutsideBar) Below are the different options available: Multiple instances can be applied on the same chart to monitor different patterns Entry suggestion - pips to be added over the break for the entry 3 different options to calculate the SL - by pips, by ATR multiplier or at the pattern High/Low 3 different options to calculate the 2 TPs -
MetaTrader 4 version available here : https://www.mql5.com/en/market/product/24881 FFx Basket Scanner is a global tool scanning all pairs and all timeframes over up to five indicators among the 16 available. You will clearly see which currencies to avoid trading and which ones to focus on. Once a currency goes into an extreme zone (e.g. 20/80%), you can trade the whole basket with great confidence. Another way to use it is to look at two currencies (weak vs strong) to find the best single pairs
MetaTrader 4 version available here: https://www.mql5.com/en/market/product/25793 FFx Pivot SR Suite PRO is a complete suite for support and resistance levels. Support and Resistance are the most used levels in all kinds of trading. Can be used to find reversal trend, to set targets and stop, etc. The indicator is fully flexible directly from the chart 4 periods to choose for the calculation: 4Hours, Daily, Weekly and Monthly 4 formulas to choose for the calculation: Classic, Camarilla, Fibonac
ClassicSBA
Umri Azkia Zulkarnaen
this indicator very simple and easy if you understand and agree with setup and rule basic teknical sba you can cek in link : please cek my youtube channel for detail chanel : an for detail info  contact me  basicly setup buy (long) for this indicator is Magenta- blue and green candle or magenta - green  and green candlestik and for setup sell (short) is Black - yellow - and red candle or black - red  and red candlestik
Indicador en base a la pendiente de la linea de precio, dibuja una línea de color cuando sube a base de los precios que previamente has sido procesados o linealizados, y cuando baja la pendiente la linea linealizada toma otro color. En este caso se a considerado 6 lineas de diferentes procesos desde pendientes largas hacia las cortas, observándose que cuando coincidan las pendientes se produce un máximo o mínimo, lo que a simple vista nos permitirá hacer una COMPRA O VENTA.
Индикатор Coefficient Of Determination (COD) представляет собой значение коэффициента детерминации или квадрат коэффициента корреляции между зависимой переменной — ценой и объясняющей переменной — тиковым объемом. Что это дает нам на практике? COD отлично распознает кульминацию трендовых движений, что позволяет подбирать оптимальные точки и ловить развороты рынка. Как использовать индикатор: Наиболее популярная торговая стратегия строится совместно с трендовым индикатором Moving Average (MA), пе
Fibonacci Múltiple 12, utiliza la serie fibonacci plasmado en el indicador fibonacci, aumentadolo 12 veces según su secuencia. El indicador fibonacci normalmente muestra una vez, el presente indicador se mostrara 12 veces empezando el numero que le indique siguiendo la secuencia. Se puede utilizar para ver la tendencia en periodos cortos y largos, de minutos a meses, solo aumentado el numero MULTIPLICA.
Recommended TimeFrame >= H1. 100% Non Repainted at any moment.  Use it carefully, only with Trend Direction. Trading Usage: 2 Variants: as Range System or as BreakOut System (Both Only With Trend Direction)::: (Always use StopLoss for minimise Risk); [1] as Range System: (Recommended) in UP TREND:  - BUY in Blue Line , then if price goes down by 50 points (on H1) open Second BUY.   Close in any Profit you wish: TrailingStop(45 points) or Close when Price touches upper Gold Line. in DOWN TREND
En base a cálculos matemáticos de determino una linea Horizontal que cruza a todas las señales de trading, mostrando los máximos y mínimos. La linea horizontal parte en dos las subidas y bajadas de las señales de trading, de tan manera que es fácil identificar los máximos y mínimos, y es inteligente por que es sensible a las subidas y bajadas, afín de no quedarse en un solo lado por siempre, trabaja excelentemente con otros indicadores suavizadores ya que les garantiza que en un intervalo de tie
this indicator is a Spike detector indicator, it is specially designed to trade Boom 1000, Boom 500, Crash 1000 and Crash 500 We recommend using it on Deriv Boom and Crash indices only Its setting is intuitive, familiar, easy to use it has notification functions; audible notifications and push notifications. this tool is simple to use, easy to handle This update is based on different strategies for spikes
作者のその他のプロダクト
Trend deviation scalper - is the manual system to scalp choppy market places. Indicator defines bull/bear trend and it's force. Inside exact trend system also defines "weak" places, when trend is ready to reverse. So as a rule, system plots a sell arrow when bull trend becomes weak and possibly reverses to bear trend. For buy arrow is opposite : arrow is plotted on bear weak trend. Such arrangement allows you to get a favorable price and stand up market noise. Loss arrows are closing by common p
Golden section price action indicator - is a trend-scalping complete system with enter and exit points. Indicator is based on most powerfull price action japan patterns that are filtered by volume, volatility, market phase. Pattern is not a simple combinations of candles. Patterns must have "weight" to move market in right direction. "Weight" - is the summary of pattern's volume, the size of pattern candles according to last average volatility and ofcourse pattern must appear in correct market p
SupportResistancePeaks Indicator indicator - is the combination of dynamic support/resitance and price action pattern. As a rule support/resistance indicators uses already calculated, history levels. The most disadvantage of this method - new(incomming) levels always are not the same as were on history, in other words accuracy is not so high as expected. My indicator is looking for dynamic/live levels that are forming right now after trend lost it's power and choppy market starts. As a rule exac
Trend deviation scalper - is the manual system to scalp choppy market places. Indicator defines bull/bear trend and it's force. Inside exact trend system also defines "weak" places, when trend is ready to reverse. So as a rule, system plots a sell arrow when bull trend becomes weak and possibly reverses to bear trend. For buy arrow is opposite : arrow is plotted on bear weak trend. Such arrangement allows you to get a favorable price and stand up market noise. Loss arrows are closing by common p
Trend driver bars is the manual trading system, which defines current trend continue or it's pull-back/reverse. "Driver" bars - are price action patterns that has powerfull affect on market, defining it's near future direction. Generally, driver bars represents trend "skeleton" and often anticipates new market impulse. System plots arrows when market shows 3 pattenrs in a row(most powerfull combo-pattern), and makes fast scalping of incomming movement. Loss positions closes by common profit. Lot
Wave Impulse OmegaScalper - is the manual system for scalping. In many cases Indicator "eats" almost all possible trend wave. System defines up price wave and down price wave. Inside the exact wave - system defines true trend movement and choppy market. Indicator plots signals while market is trending, powerfull and has quiet good volatility. This is complete system with enter and exit points. Main Indicator's Features Signals are not repaint,non-late or disappear(exept cases when system recalcu
Reverse side scalper is the manual trading system, that works on choppy(anti-trend) market. As a rule markets are on 80% choppy and only 20% is trend phase. System is based on custom step Moving and RSI and reverse pattern. System defines up movement, down movement, trend / choppy phases. Indicator plots Buy signal arrow when current direction is down and phase is trend, Sell signal arrow is plotted when currently is up movement and phase is trend. As a rule it allows to "catch" local maximum/mi
Binary step clouds - is the complete trading system with enter and exit points. System is based on double smoothed exponential step moving and volume weighted simple step moving.Generally each movings define trend direction and places when trend is in active phase. Signals plots when both movings approache to active trend phase and market speed is high.  Main Indicator's Features Signals are not repaint,non-late or disappear(exept cases when system recalculates all history datas,refreshing main
Acceleration Force Meter Indicator - is a trend system that join market in trend phase and after trend pull-back. AFM indicator - is the system that watchs market phases from flat to extreme volatility and prefers to enter in market when it's active, more volatility, ignoring most flat places. This is 100% complete trading system including enter and exit points. It works well with profitable trades - maximizing take profit targets(analysis of recent market volatility, its pips range to adapt cur
ImbaTrend Runner - is the trend following manual system for forex/crypto market. It defines medium-term trends and works with it in intraday mode. System shows enter points, profit and loss targets. As a rule profit targets are 2-3 X bigger than loss targets. Indicator is AutoAdaptive and it automatically updates it's settings during trading. Indicator is sensitive to market changes, regular updates helps to stay in relevant trend. Main Indicator's Features Signals are not repaint, late or disap
Early WPR divergence - is the manual system to define trend reverse. Green histogram shows main trend, Orange one - shows "short"/local trend. System is looking for clear divergence between both trends and pick up position(plot buy/sell arrows). When main trend is up, but local trend reverses to bearish trend and get's big power - sell arrow is plotted;    When main trend is down, but local trend reverses to bullish trend and get's big power - buy arrow is plotted;  Main inputs are : mediumTrend
Bull bear pressure indicator - is the manual system which defines bull/bear market. When lines is above zero level - market is strong bullish, and when lines below zero level - market is bearish. First line represents global trend and second one are smoothed and shows local market's mood. Main inputs are : MainPeriod- main indicator's period for global trend calculation; SignalPeriod - period for   smoothed and shows local market's trend; Main Indicator's Features Signals are not repaint,non-la
ROC acceleration-deceleration is the manual system for medium-term scalping. Indicator based on custom ROC system which defines bullish/bearish market and especially  acceleration-deceleration of tendention in the market's main direction. Buy arrow is plotted during bearish market when current trend decelerates and sell  arrow is plotted during bullish market when current trend decelerates. Main Indicator's Features Signals are not repaint,non-late or disappear(exept cases when system recalculat
ASI fractals with DPO filter - is the manual trend-following system. ASI fractals are the base of every trend. System plots an arrow when fractal pattern appears on ASI indcator and DPO direction is same as incomming signal. System has several ways of usage : simply indicator, indicator with suggested arrows, arrows with single targets and arrows with common profit targets. User can simply switch indicator's modes directly from chart. Main Indicator's Features Signals are not repaint,non-late or
Trend reversal index - is the manual trading system that works with overbought , oversold levels and reversal patterns. Sell arrow is plotted when indicator is higher than overbought level and here forms reversal pattern, all pattern points  located higher than overbought level. Opposite with buy arrow : ndicator is lower than oversold level and here forms reversal pattern, all pattern points located lower than overbought level.  Main Indicator's Features Signals are not repaint, late or disapp
Demarker pullback system - is the manual trading system for choppy markets. It show 2 colored histogram.  When histogram is blue - market is quite bullish, when histogram ir orange - market is more bearish. Up arrow is plotted when histogram is in oversold zone but blue color. Down arrow is plotted when histogram is in overbought zone but orange color. These patterns shows false breakout and possible soon reverse(price is overbought but shows bearish signs and price is oversold but shows bullis
TPM Cross (trend power moving cross) - is a trend following strategy based on custom signal points. Indicator consists from main custom moving chart line and trend power line. Indicator defines up and down movements by it's trend power and custom moving direction. When current market's trend looses it's power and opposite trend starts - power trend line  crosses moving and indicator plots an arrow.  Main indicator's adjustable inputs : movingPeriod - period of moving line  trendPeriod  - period
Impulse fractals indicator - is counter-trend oriented complex market fractal pattern.  Market creates bull/bear impulse, trend starts, fractals on impulsed wave are an agressive pullback signals. Buy arrow is plotted when market is bearish and it's impulse showed up-side fractal, and sell arrow is plotted when market is bullish and it's impulse showed dn-side fractal. Main indicator's adjustable inputs : impulsePeriod - main period of impulse histogram  filterPeriod  - smoothes impulse accordi
Floating peaks oscillator - it the manual trading system. It's based on Stochastik/RSI type of oscillator with dynamic/floating  overbought and oversold levels. When main line is green - market is under bullish pressure, when main line is red - market is under bearish pressure. Buy arrow appears at the floating bottom and sell arrow appears at floating top. Indicator allows to reverse signal types. Main indicator's adjustable inputs : mainTrendPeriod; signalTrendPeriod; smoothedTrendPeriod; tre
Trend speed vector - is the oscillator for manual trading. System measures trend direction and it's speed. Histogram shows 4 colors: Lime --> Strong up movement with good gain speed; Green --> Up movement with low gain speed Red --> Strong down movement with good gain speed; Orange --> Down movement with low gain speed Green and Orange histograms show weak market's movements and thуese places excluded from signal points. Buy arrow is plotted during strong down movement when bearish gain speed i
Floating gain meter is the manual trading system that works with local trends and it's scalping. Histogram represents  bull/bear floating trend gain. Green color histogram shows choppy market with bullish pressure, Orange - shows choppy market with bearish pressure. Lime and Red colors shows "boiled" places in market. As a rule buy arrow is placed after strong Down movement when it's power becomes weak and choppy market starts. And sell arrow is plotted after strong Up movement when it's power
Pullback points indicator - is the manual trading system, that shows most popular market prices. Indicator measures bull/bear waves pressure and looks for "consensus" prices. As a rule these points are crossed up and down very often and opened trade has several chances to be closed in positive zone. Mainly, such points is the good base for "common profit" types of strategies. Indicator also represents   "common profit"  scalping method of trading as default one.  Main Indicator's Features Signa
Noize Absorption Index - is the manual trading system that measures the difference of pressure between bears forces and bulls forces. Green line - is a noize free index that showing curent situation. Zero value of index shows totally choppy/flat market.Values above zero level shows how powerfull bullish wave is and values below zero measures bearish forces.Up arrow appears on bearish market when it's ready to reverse, dn arrow appears on weak bullish market, as a result of reverse expectation. S
Looking for EA to automate your trading strategy on the Forex market? TrendRocWaves Robot — your faithful companion in the world of trading! This 100% automated EA offers unique features: - works exclusively on high timeframes (H1 and H4) for confirmed response to market changes. - uses the most popular and liquid currency pairs such as EURUSD,GBPUSD with minimal spreads and fast transaction execution. - applies a scalping method based on a medium-term trend to achieve local goals and reduce r
Introducing the trading system Dynamic Trend Cycles Robot  — a powerful tool for H1-H4 trading with volatility pairs! Technical capabilities - pairs to trade : EURUSD,GBPUSD,XAUUSD;  - timeframes : M30,H1,H4; Why Choose Dynamic Trend Cycles Robot (DTC)? - Accurate Trend Analysis: DTC adapts to current market volatility, providing precise tracking of price trends. This allows you to confidently open positions in line with the main trend and maximize your profits. - Filtering False Signals: In t
Introducing to your attention an innovative expert advisor created specifically for the most juicy and volatility    currency     basket: GBPUSD and XAUUSD. This EA is designed using the main features of this market's movement, making it an ideal choice for dynamic trading on high-trending and medium-volatile pairs. The advisor is focused on minimizing trading risks, aiming to reduce losses to a minimum. Main features: EA is designed to open and close orders at the begginning of trading session
Introducing to your attention unique trading advisor, Squeeze roc xau points, exclusively designed for trading on the XAU/USD pair. We analyzed predominantly all objectively important timeframes and identified unique characteristics of gold movements relative to the dollar to create this product. These insights can be extremely useful in predicting market reversal points on timeframes from M30 to H8 for the XAU/USD pair. You can choose your favorite timeframe to receive signals or use multiple
Introducing to your attention the unique trading advisor "Scaled Vidya Trends", designed for dynamic scalp trading on trend volatility pairs hour timeframe. Main features of Scaled Vidya Trends: - EA works on H1 timeframe; - Uses the most popular currency pairs: EURUSD, GBPUSD, USDCAD. Brokers usually set one of the lowest spreads for these pairs; - Applies a scalping method based on local targets for orders; - Works at the close of the timeframe, waiting for signal confirmation. Signals works
Introducing to your attention a unique trading advisor "Detrended scalper jpy points robot", designed for trading with major JPY crosses. The idea is based on a modified indicator, detrended price oscillator, whose task is to eliminate the influence of the trend on price movements. This greatly simplifies the process of determining overbought/oversold cycles. The focus is on analyzing short cycles: long market cycles consist of several short ones. By analyzing the short components, we can more
Introducing the automated trading system "Flexi trend tracker robot" — a powerful instrument for hour+ timeframe trading with medium/soft volatility pairs! This EA offers unique features:  wide range of applications: This strategy can be used on various time intervals: H1 and H4 timeframes, making the trading advisor a highly versatile tool for trading.  the system works on comfortable USD crosses: USDCAD, USDCAD, and USDCAD pairs where you won't see overwhelming trends that wipe out deposits b
フィルタ:
レビューなし
レビューに返信