Roman5 Arbitrage Viewer for MT4
- インディケータ
- バージョン: 1.5
- アップデート済み: 3 4月 2020
- アクティベーション: 20

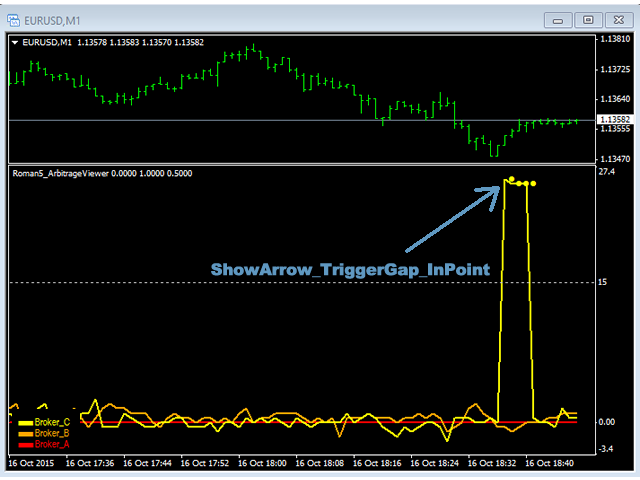
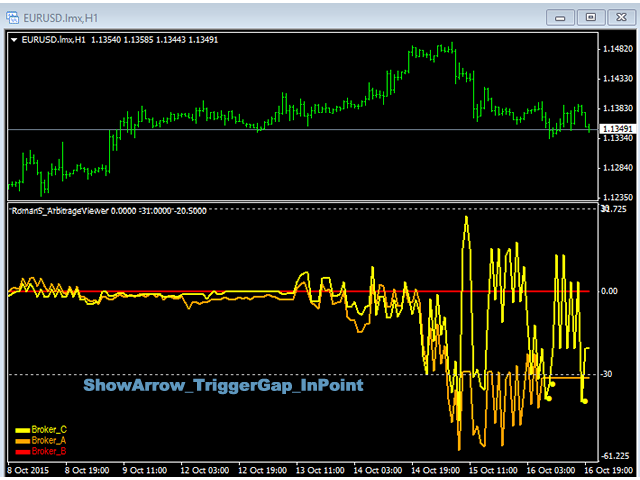
This indicator is a perfect tool able to compare which brokers have the lower latency. It shows us immediately which brokers are the slower one and the faster one. When you see the dot icon on the line it means this broker is the faster one and the red line (Broker_A) is the slower one. See the example on the screenshot.
How it works?
This indicator shares the prices information to and from the "shared" common data folder. It compares all the prices. The price is based on average by (Ask + Bid) / 2.
There are two conditions:
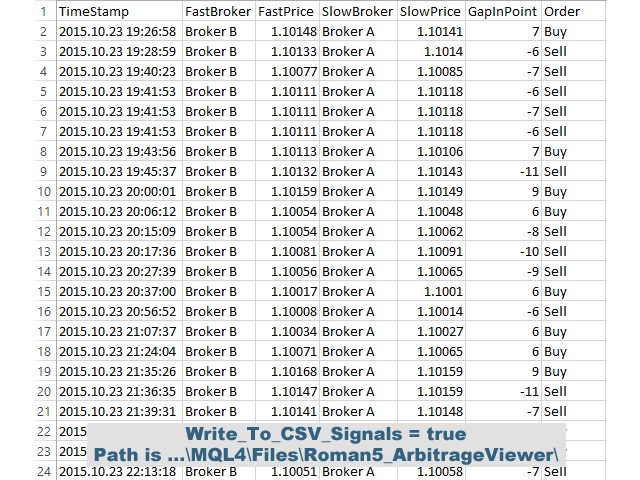
1. Gap is the difference between Broker A and Broker B prices. For example: Broker A price is 1.35115 and Broker B price is 1.35105 -- this is a 10 points gap.
Let's say set ShowArrow_TriggerGap_InPoint to 15 points it means when the gap is greater than or equal to 15 points then triggered.
2. Timestamp is to make sure that the fast broker prices are ahead of slow broker.
When these two conditions are met then the dot will be appeared on the chart. It comes with an alert that will sound whenever a new signal appears.
You are able to test on demo accounts only for free - See https://www.mql5.com/en/market/product/12487
Parameters
- TimerInMillisecond - This is re-scanning and looking for any new prices every 250ms. You can change the speed. Minimum is 50ms. Default is 250 milliseconds.
- Write_To_CSV_Signals - Able to export the signals to CSV file so you won't miss out. The path location is ..\MQL4\Files\Roman5_ArbitrageViewer\. Default is True.
- ShowArrow_TriggerGap_InPoint - When there is a gap between two brokers then it will place the dot. It just shows you that there is an opportunity for arbitrage. Default is 30 points.
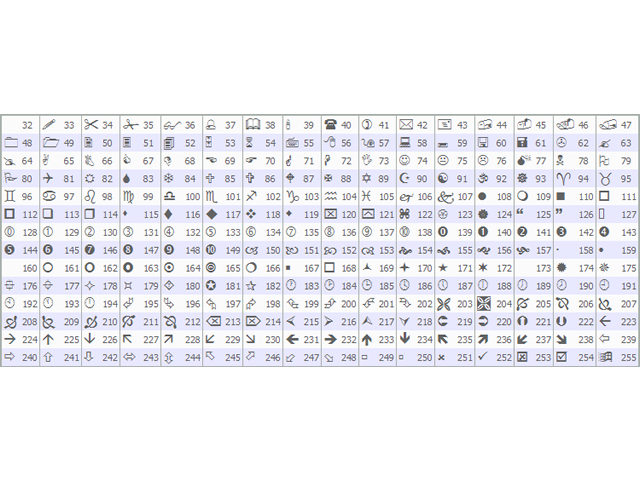
- WingdingsCode_ShowArrow_TriggerGap - This is the wingding fonts that appears on the chart. Default for dot icon is 159. See the wingdings code below.
- AlertSound - You can choose to enable or disable the alert that will sound whenever a new signal appears.