Ladder Heaven MT4
- インディケータ
- バージョン: 1.0

If you have difficulty determining the trend as well as entry points, stop loss points, and take profit points, "Ladder Heaven" will help you with that.
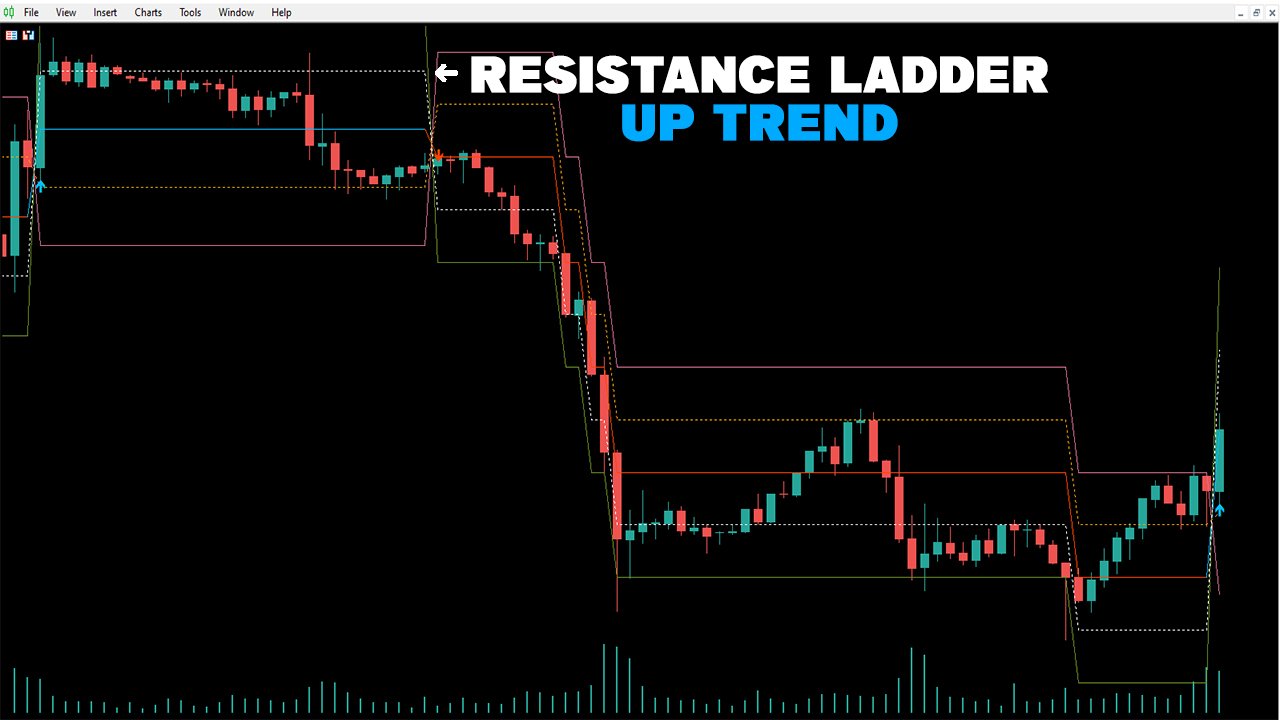
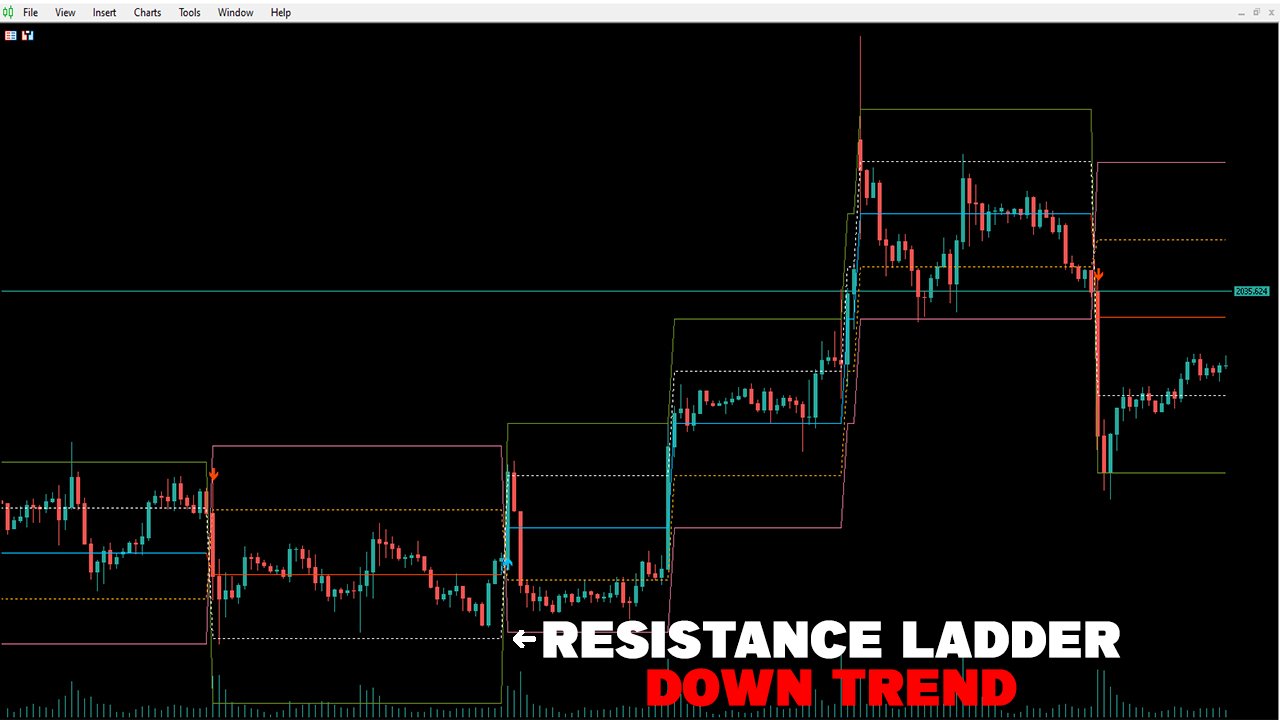
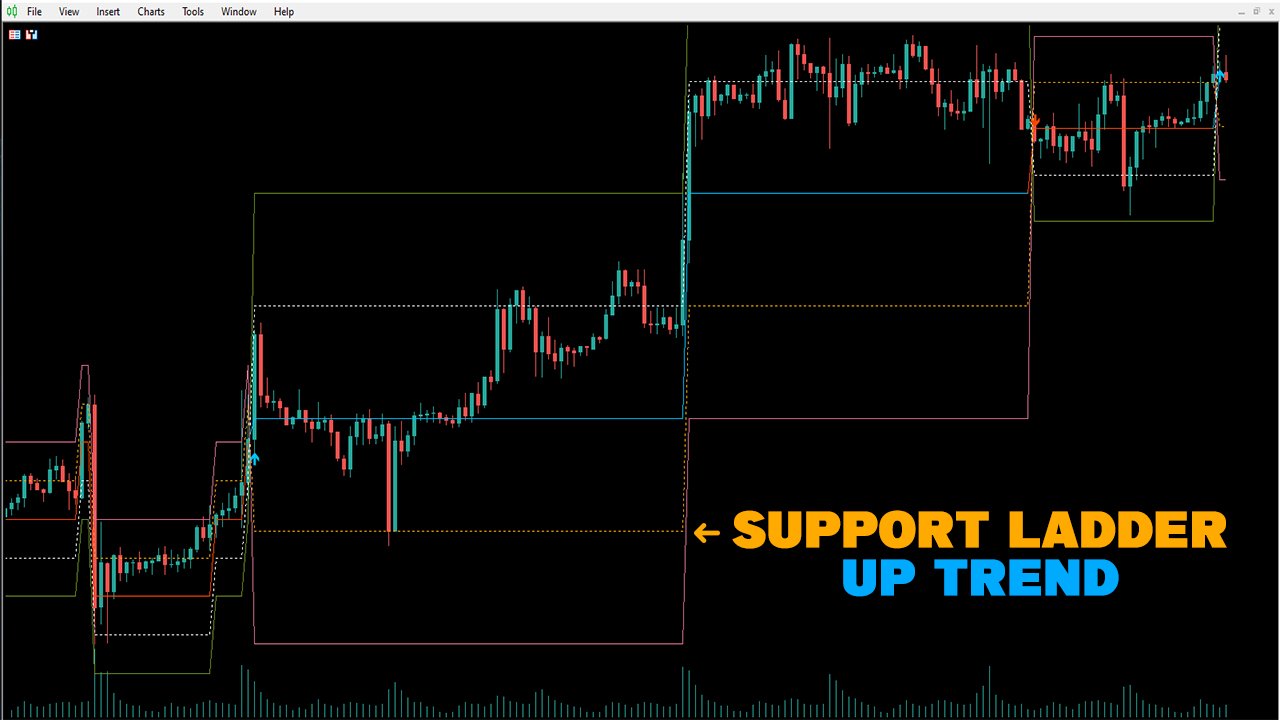
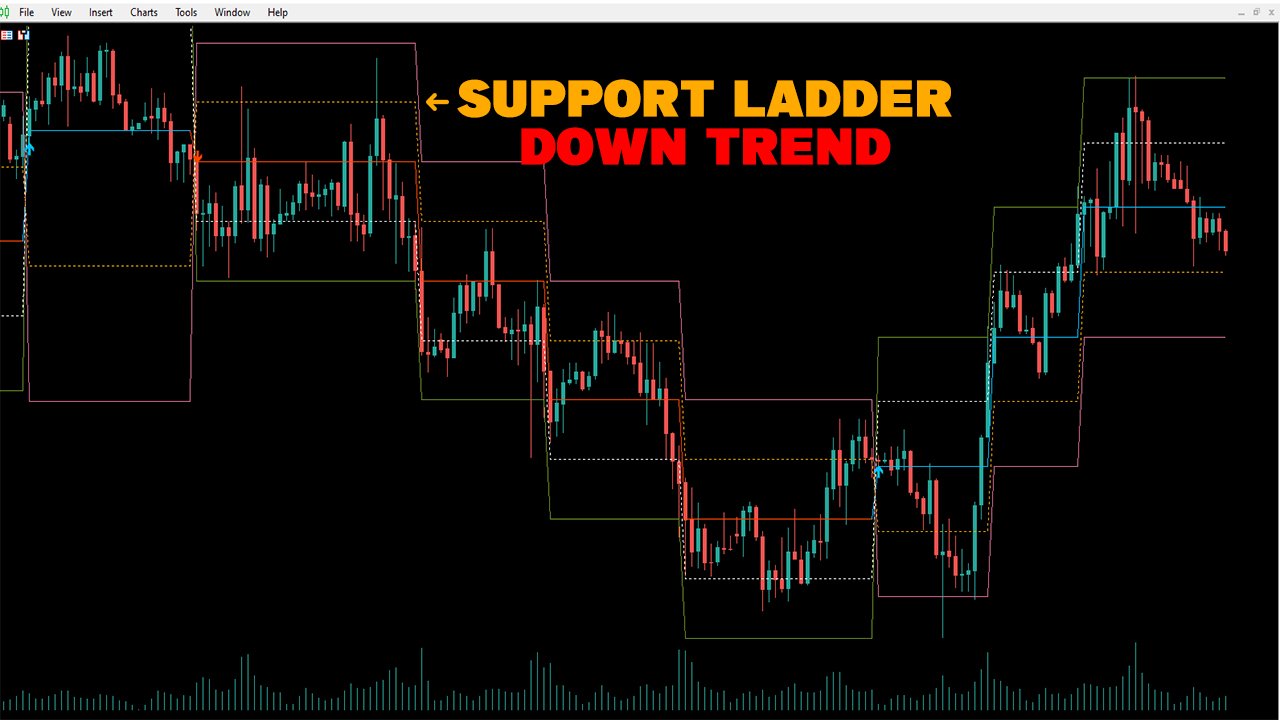
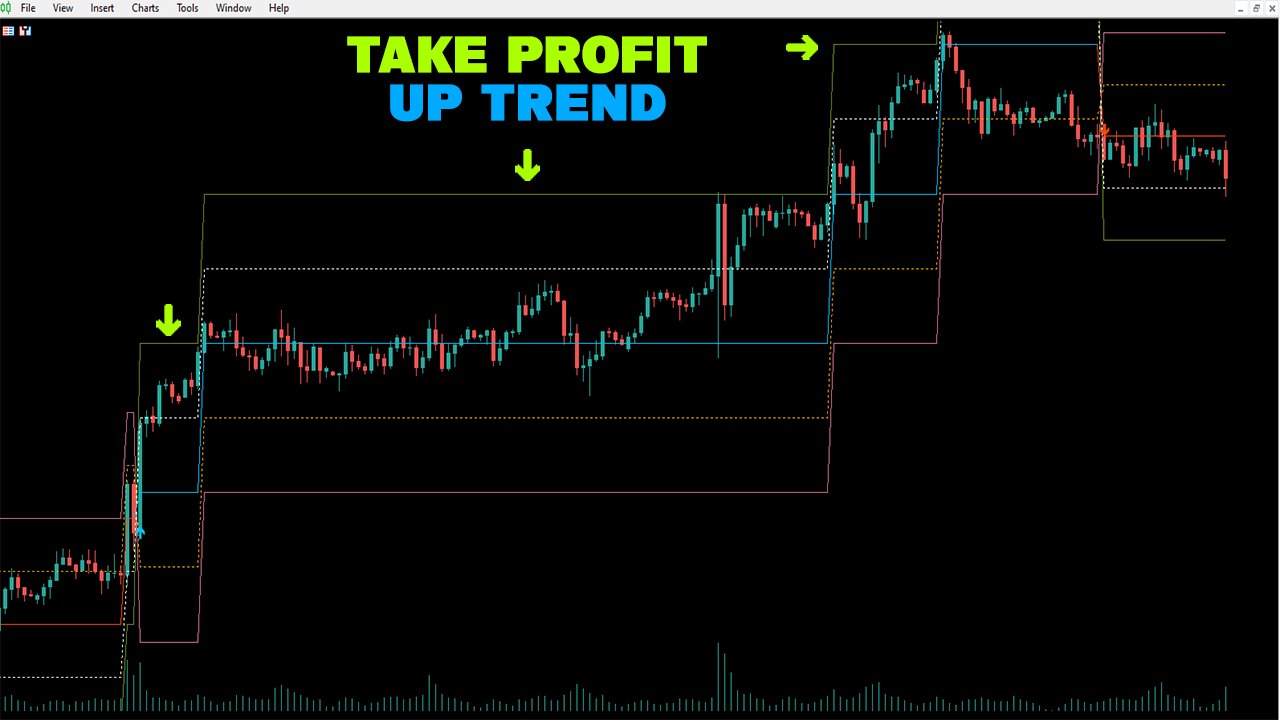
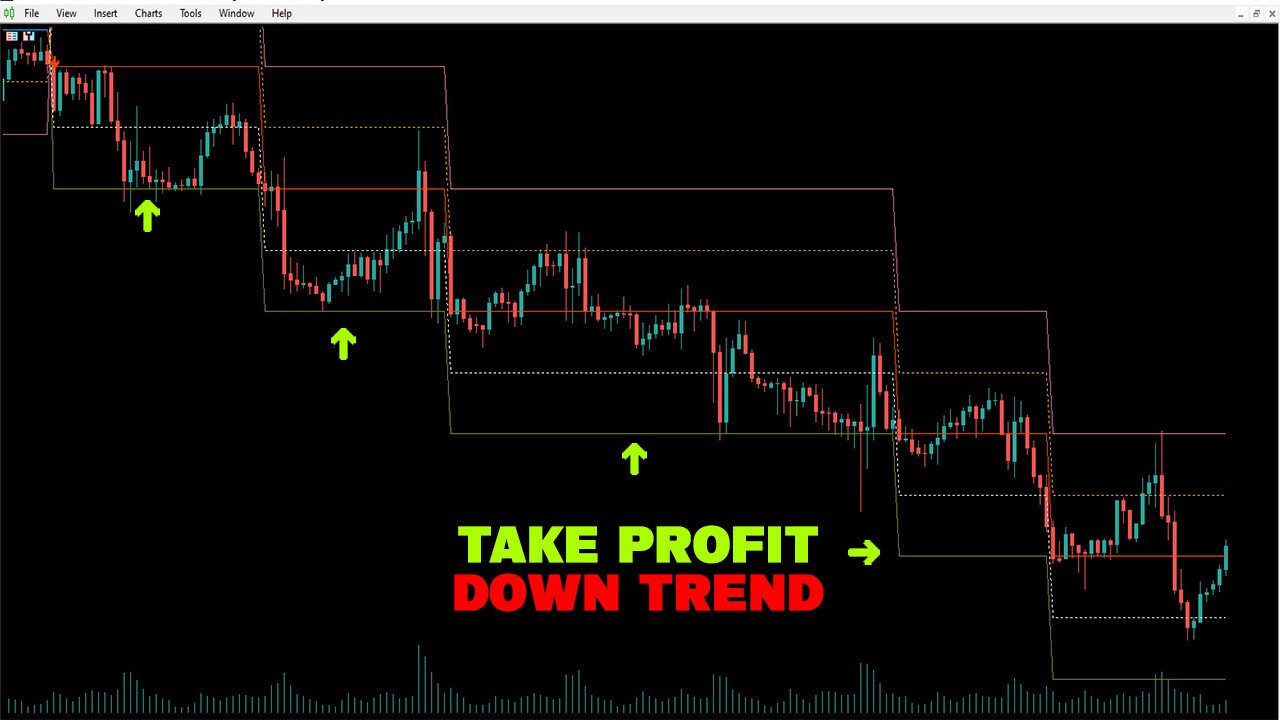
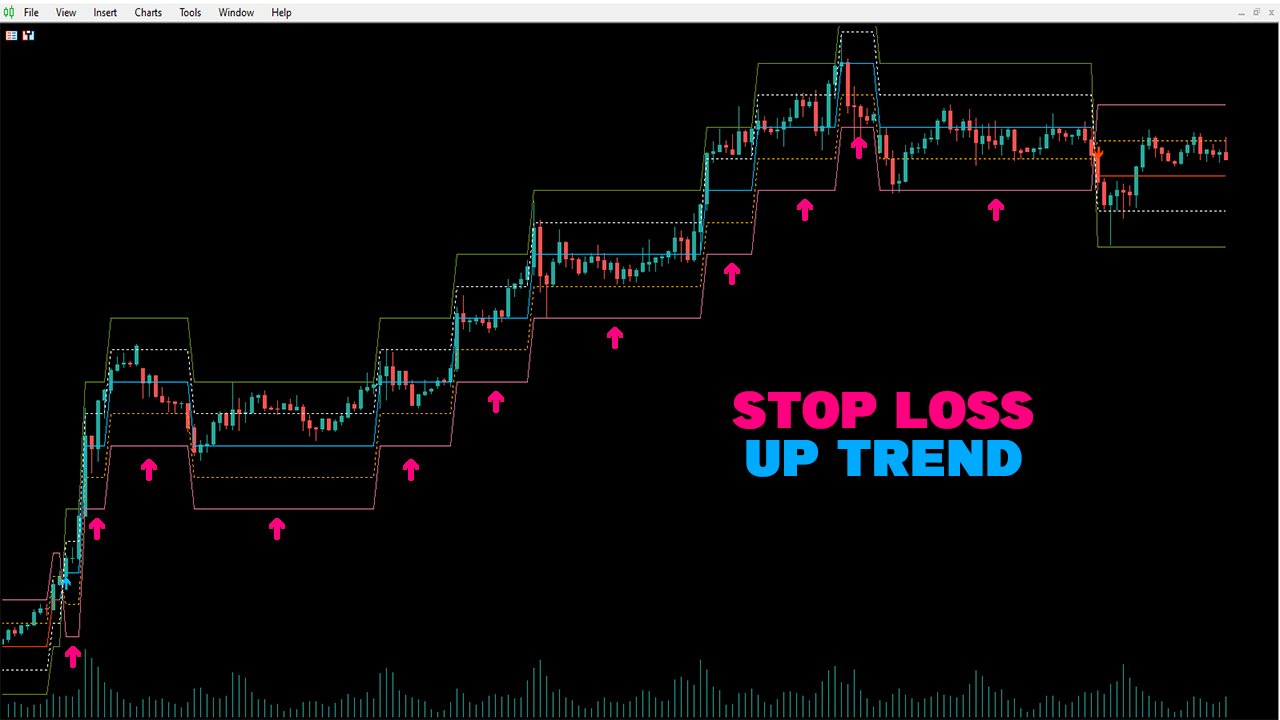
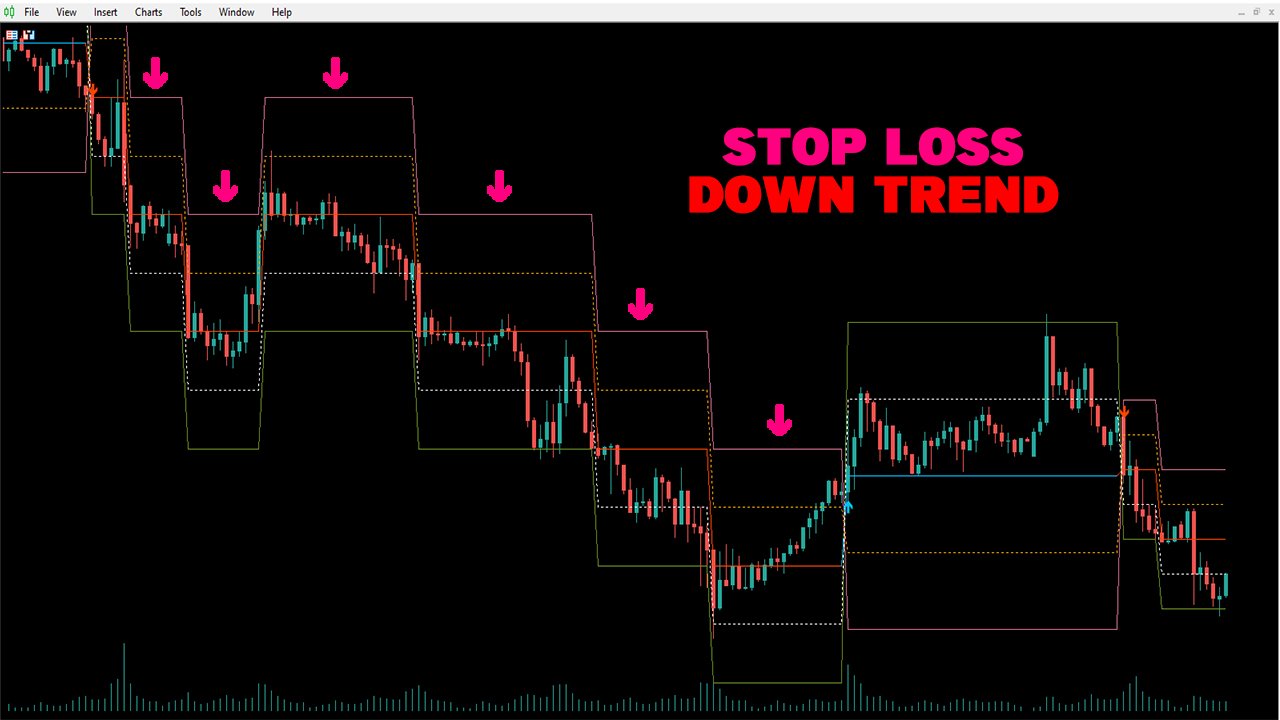
The "Ladder Heaven" algorithm is operated on price depending on the parameters you input and will provide you with signals, trends, entry points, stop loss points, take profit points, support and resistance in the trend That direction.
Helps you easily identify trends, stop losses and take profits in your strategy!
Features:
- Non-repainting, non-redrawing and non-lagging indicators.
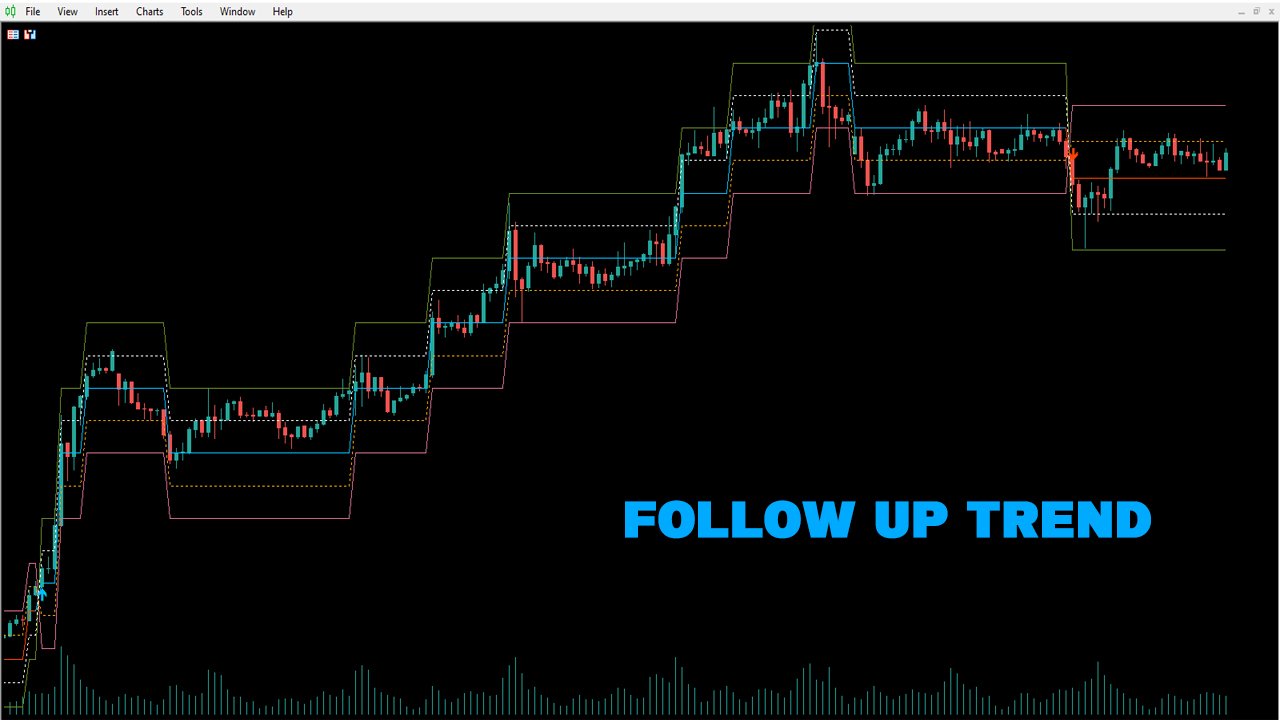
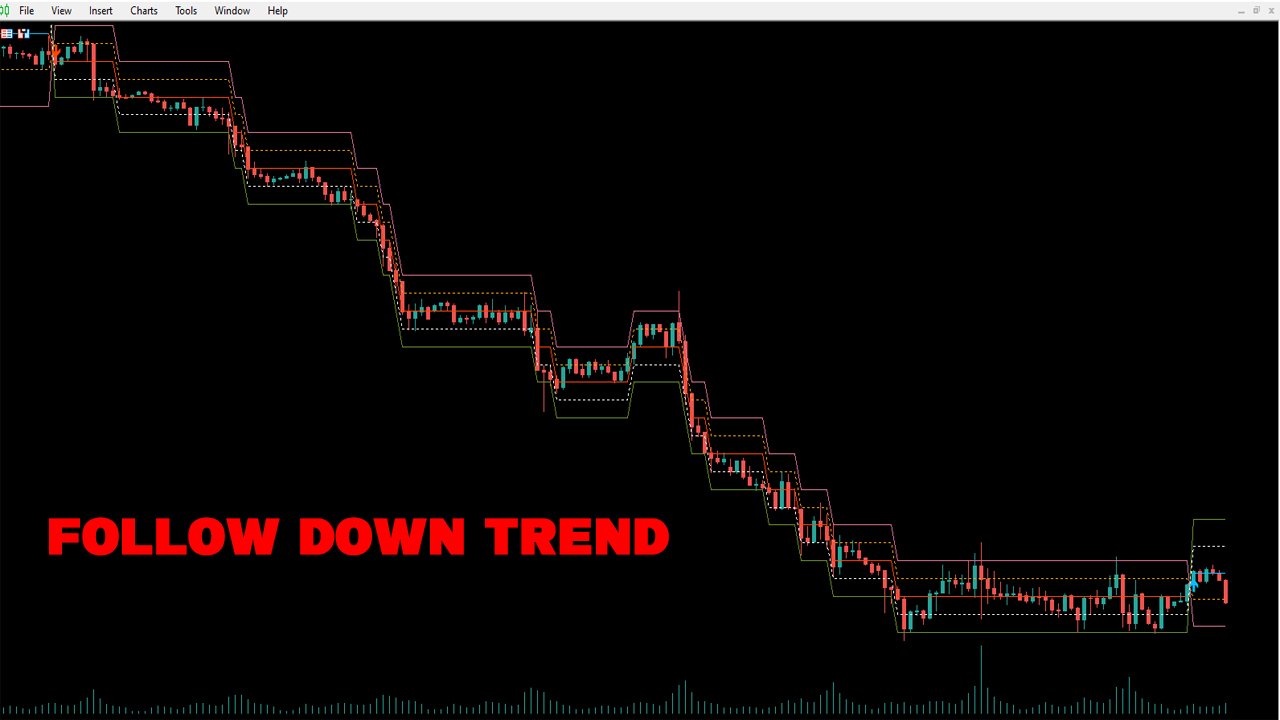
- Used to follow trends.
- Suggests support and resistance points according to the trend.
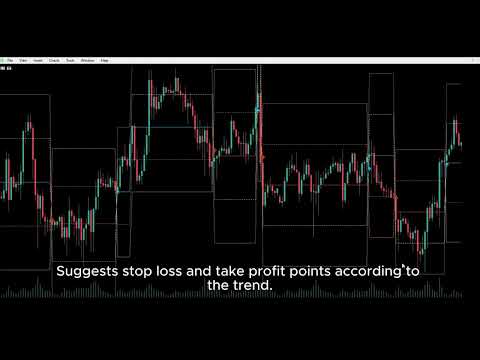
- Suggests stop loss and take profit points according to the trend.
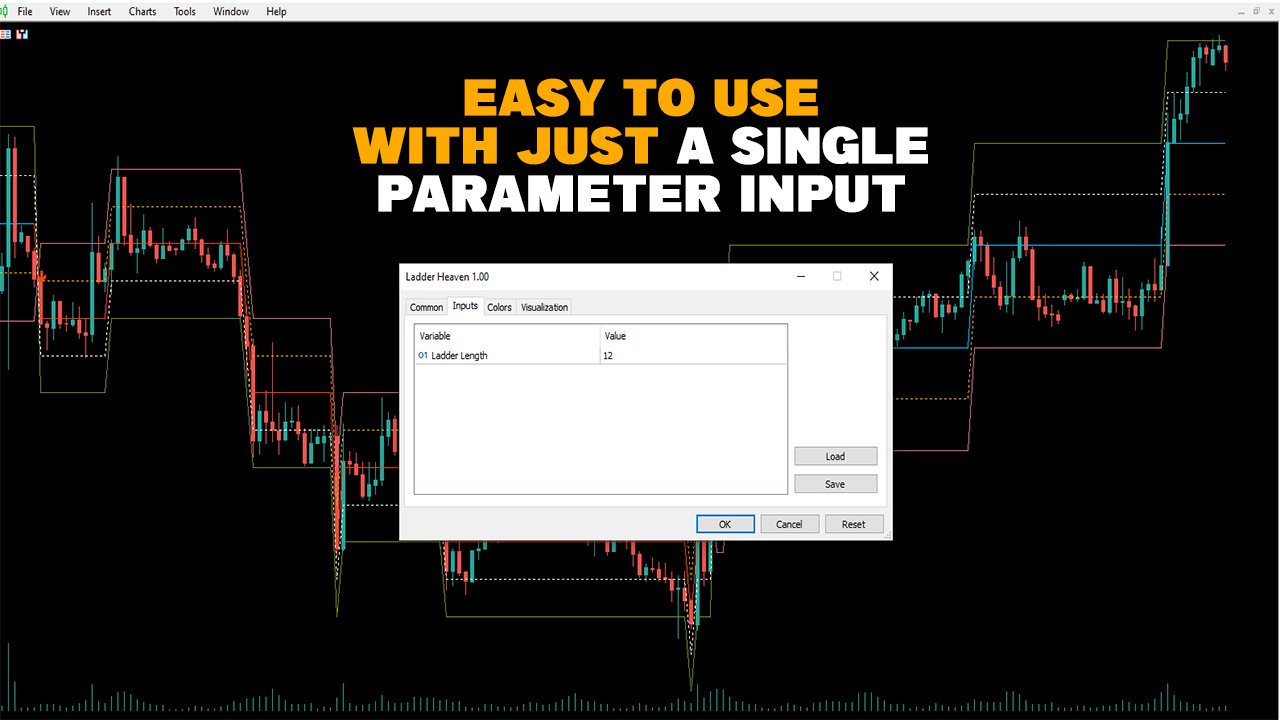
- Easy to use with just a single parameter input.
- Customize input parameters to suit your strategy.
- Can be used for all types of trading such as crypto, forex, cdf, stock and all time frames.
- Can be combined with many other indicators to optimize your trading.Can be combined with many other indicators to optimize your trading.
- Useful for every trader.
Thank you for using!
ユーザーは評価に対して何もコメントを残しませんでした