Camarilla Pivot Points and Central Pivot Range
- インディケータ
- バージョン: 1.0
- アクティベーション: 20

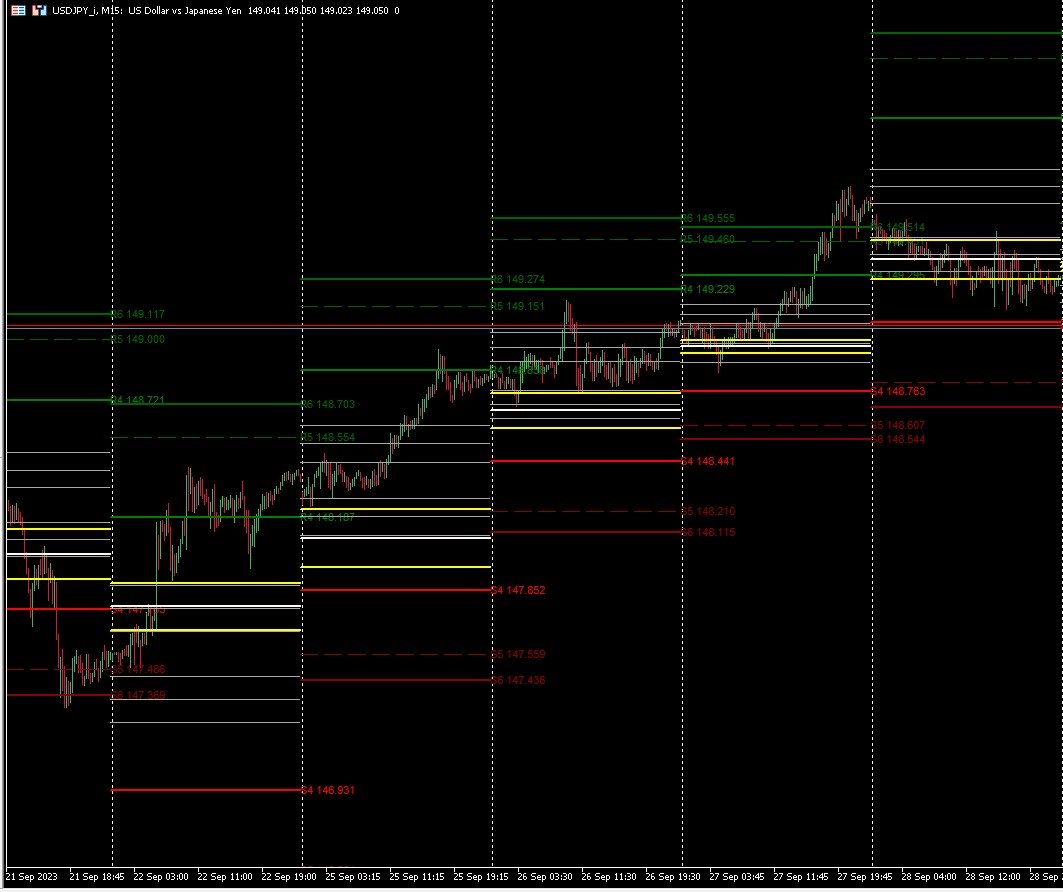
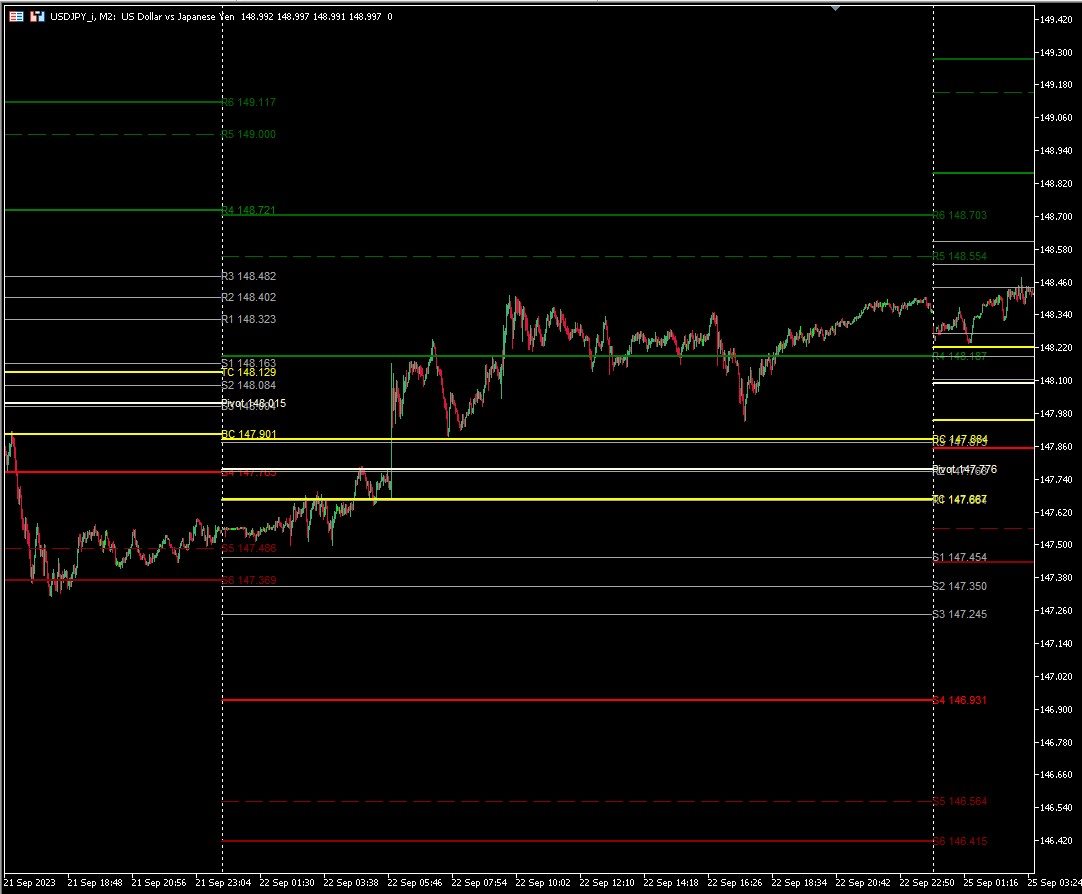
Camarilla Pivot Points is a math-based price action analysis tool that generates potential intraday support and resistance levels.
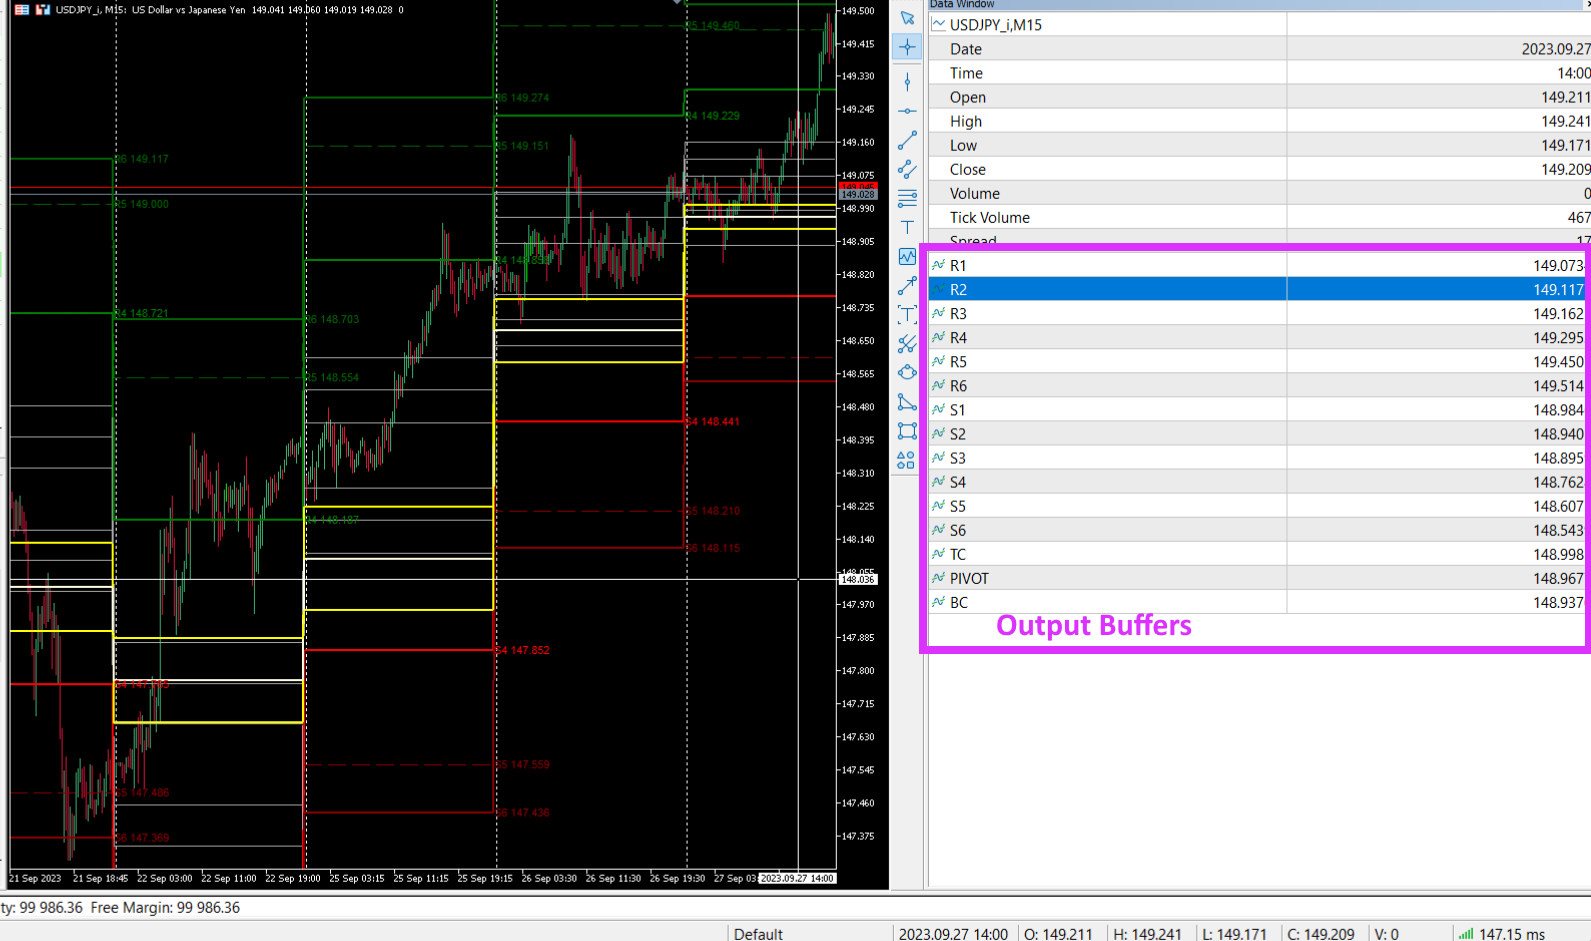
Pivot price values are stored in output buffers within this indicator, enabling any Expert Advisor to utilize this indicator's data for trading purposes.
This indicator offers the potential for developing numerous strategies. To explore some of these strategies, please visit the following websites:
https://www.babypips.com/forexpedia/camarilla-pivot-points
https://www.dailyfx.com/education/support-and-resistance/camarilla-pivot-trading-strategy.html
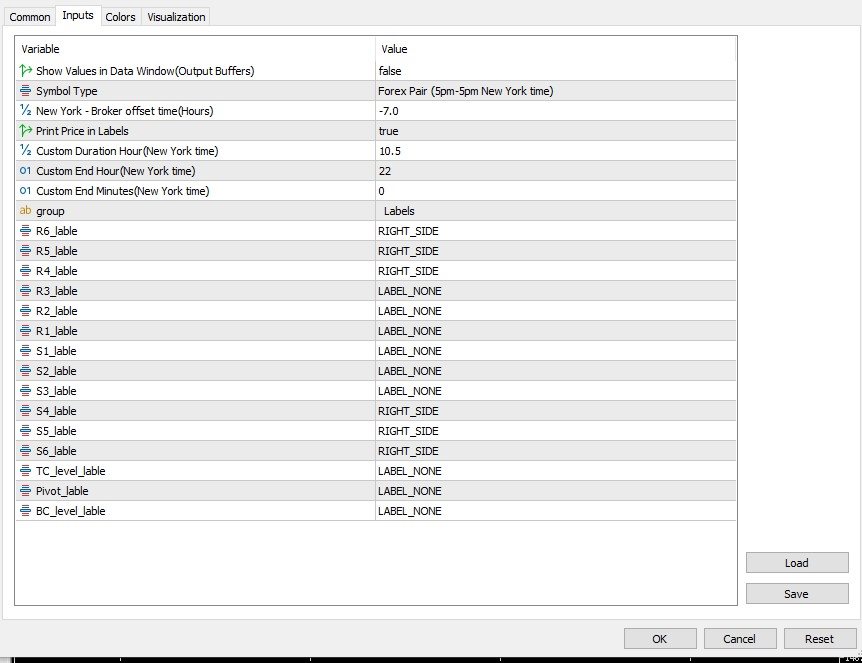
Input parameters and their description:
- Show Values in Data Window (true/false): When you set this parameter to 'true', the indicator generates output data that can be utilized by any Expert Advisor for making trading decisions. If this value is set to 'false,' the indicator produces more visually appealing plots and is particularly well-suited for manual trading.
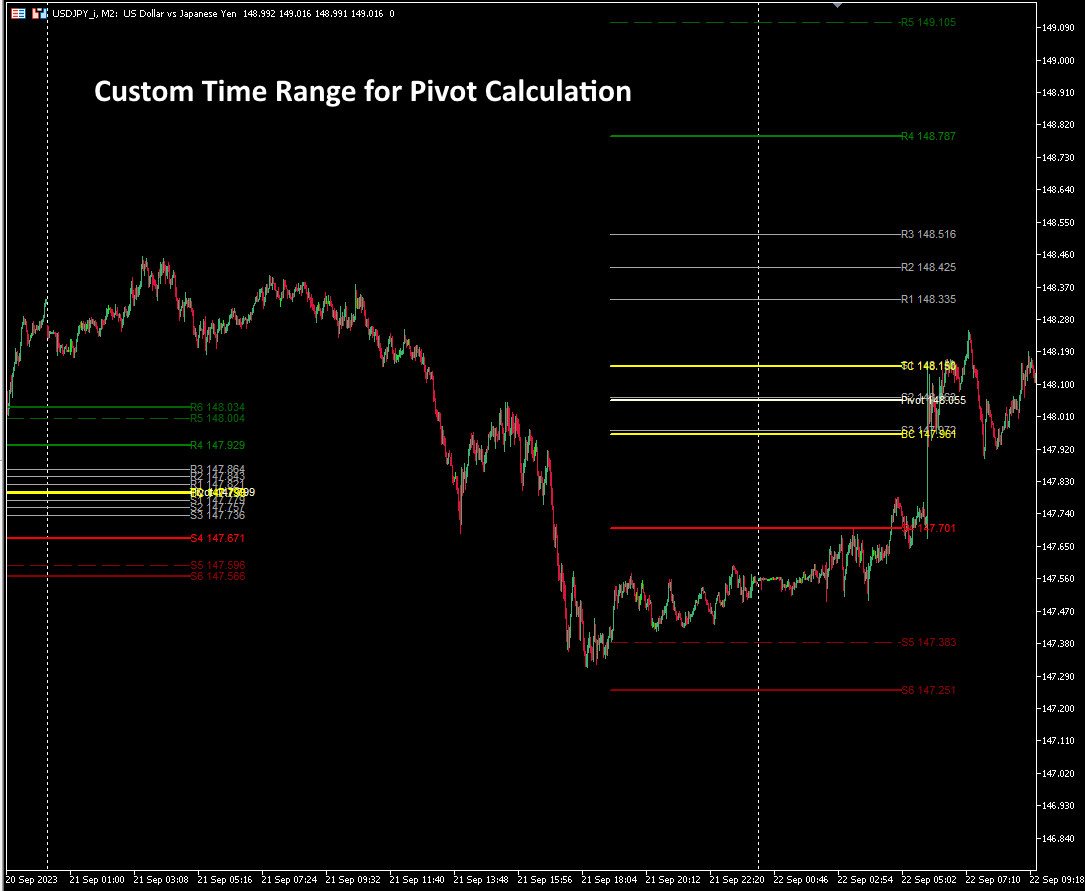
- Symbol Type: You can choose from different symbol types, each of which determines the time period for calculating pivot points. Pivot points are computed based on the open, high, low, and close prices within a specific time range from the previous day:
a) Stock/ETF (9:30 am - 4:00 pm New York time) b) Forex Pair (5:00 pm - 5:00 pm New York time) c) Index/Gold/Silver (6:00 pm - 6:00 pm New York time) d) Custom Time Range: In this mode, you can specify your preferred time range for pivot point calculation.
- New York - broker offset: Since all calculations are tied to New York time, it is essential to accurately input the time offset between New York time and your broker's time
- Print Price(true/ false): Print pivot prices near them or not.
- Custom Period Hour, Custom End Hour, Custom End Minutes: If you have chosen 'Custom Time Range' as the symbol type, you will need to input these parameters
MT5 version is also available as my market product.
Please don't hesitate to reach out if you encounter any issues, have any recommendations, or if you are interested in freelance opportunities related to this product.