Five TT Round Numbers Indicator
- インディケータ
- バージョン: 2.0
- アクティベーション: 5

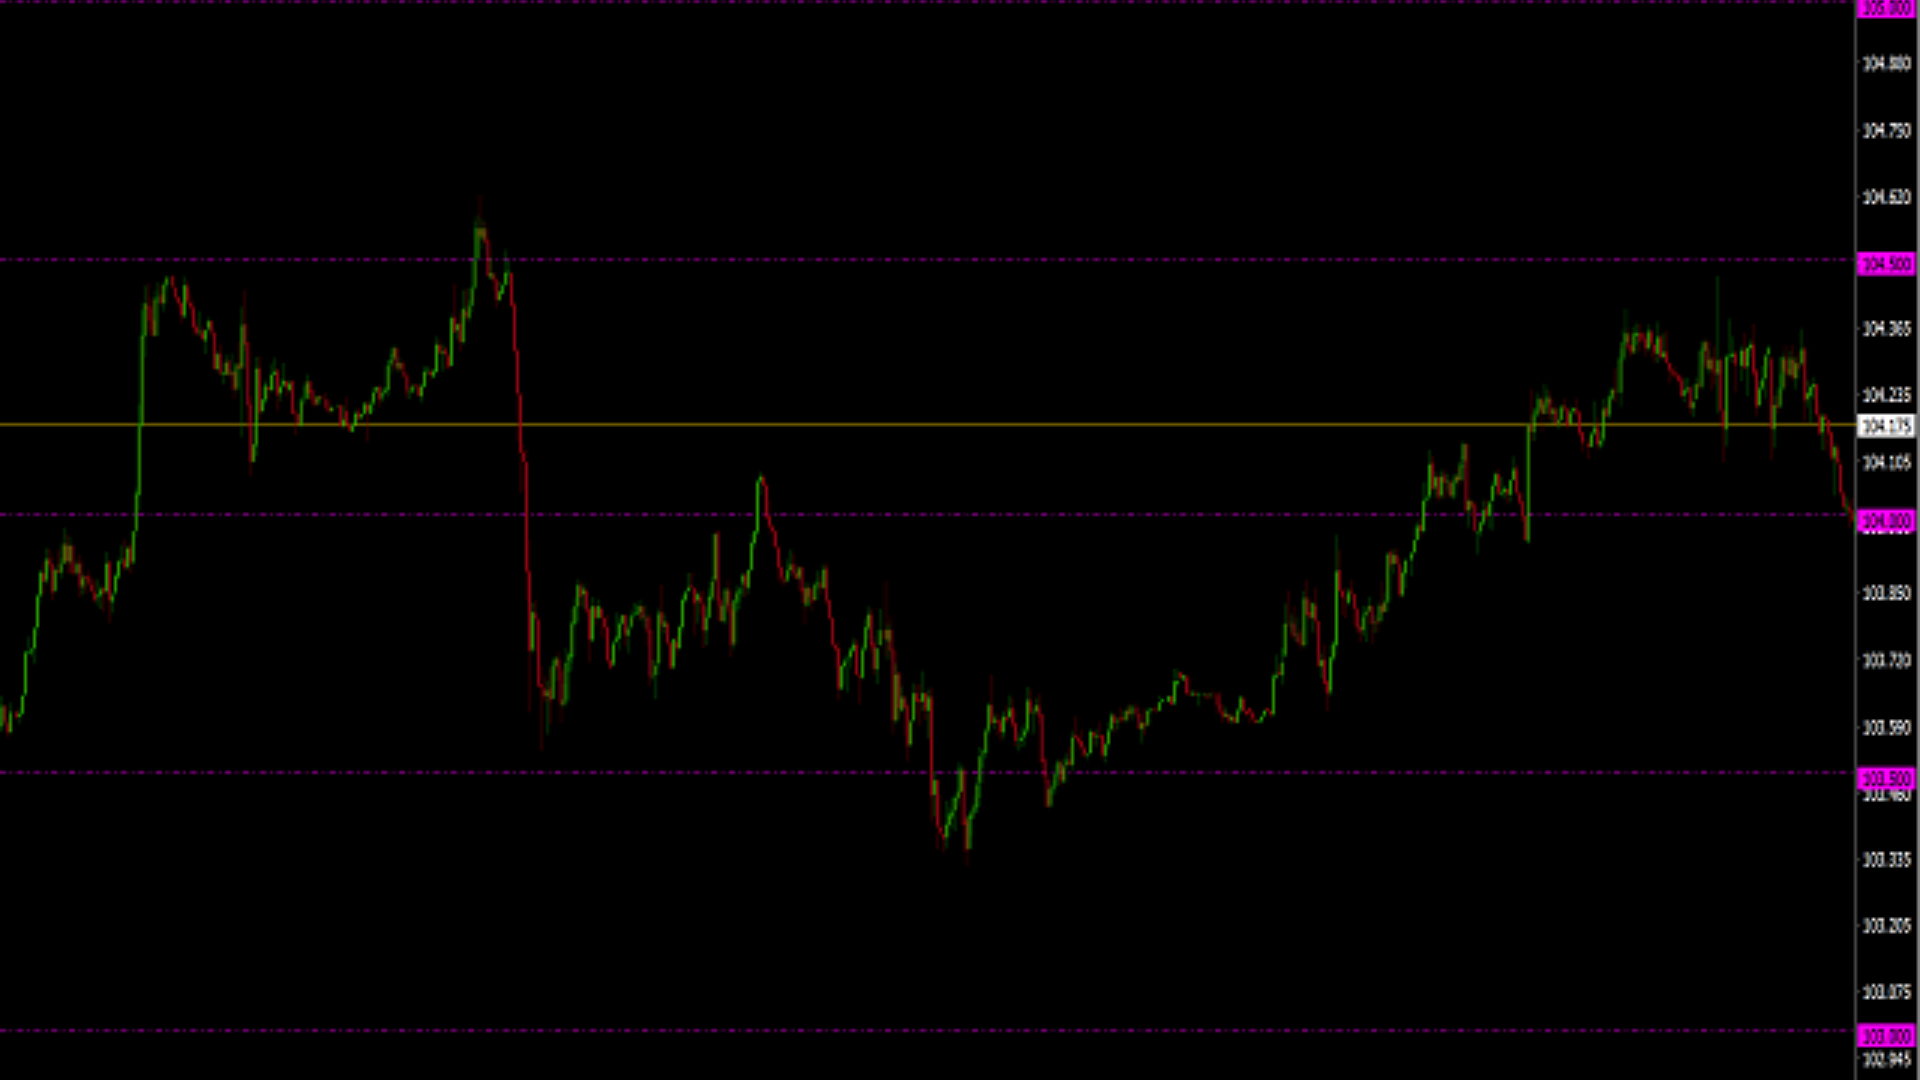
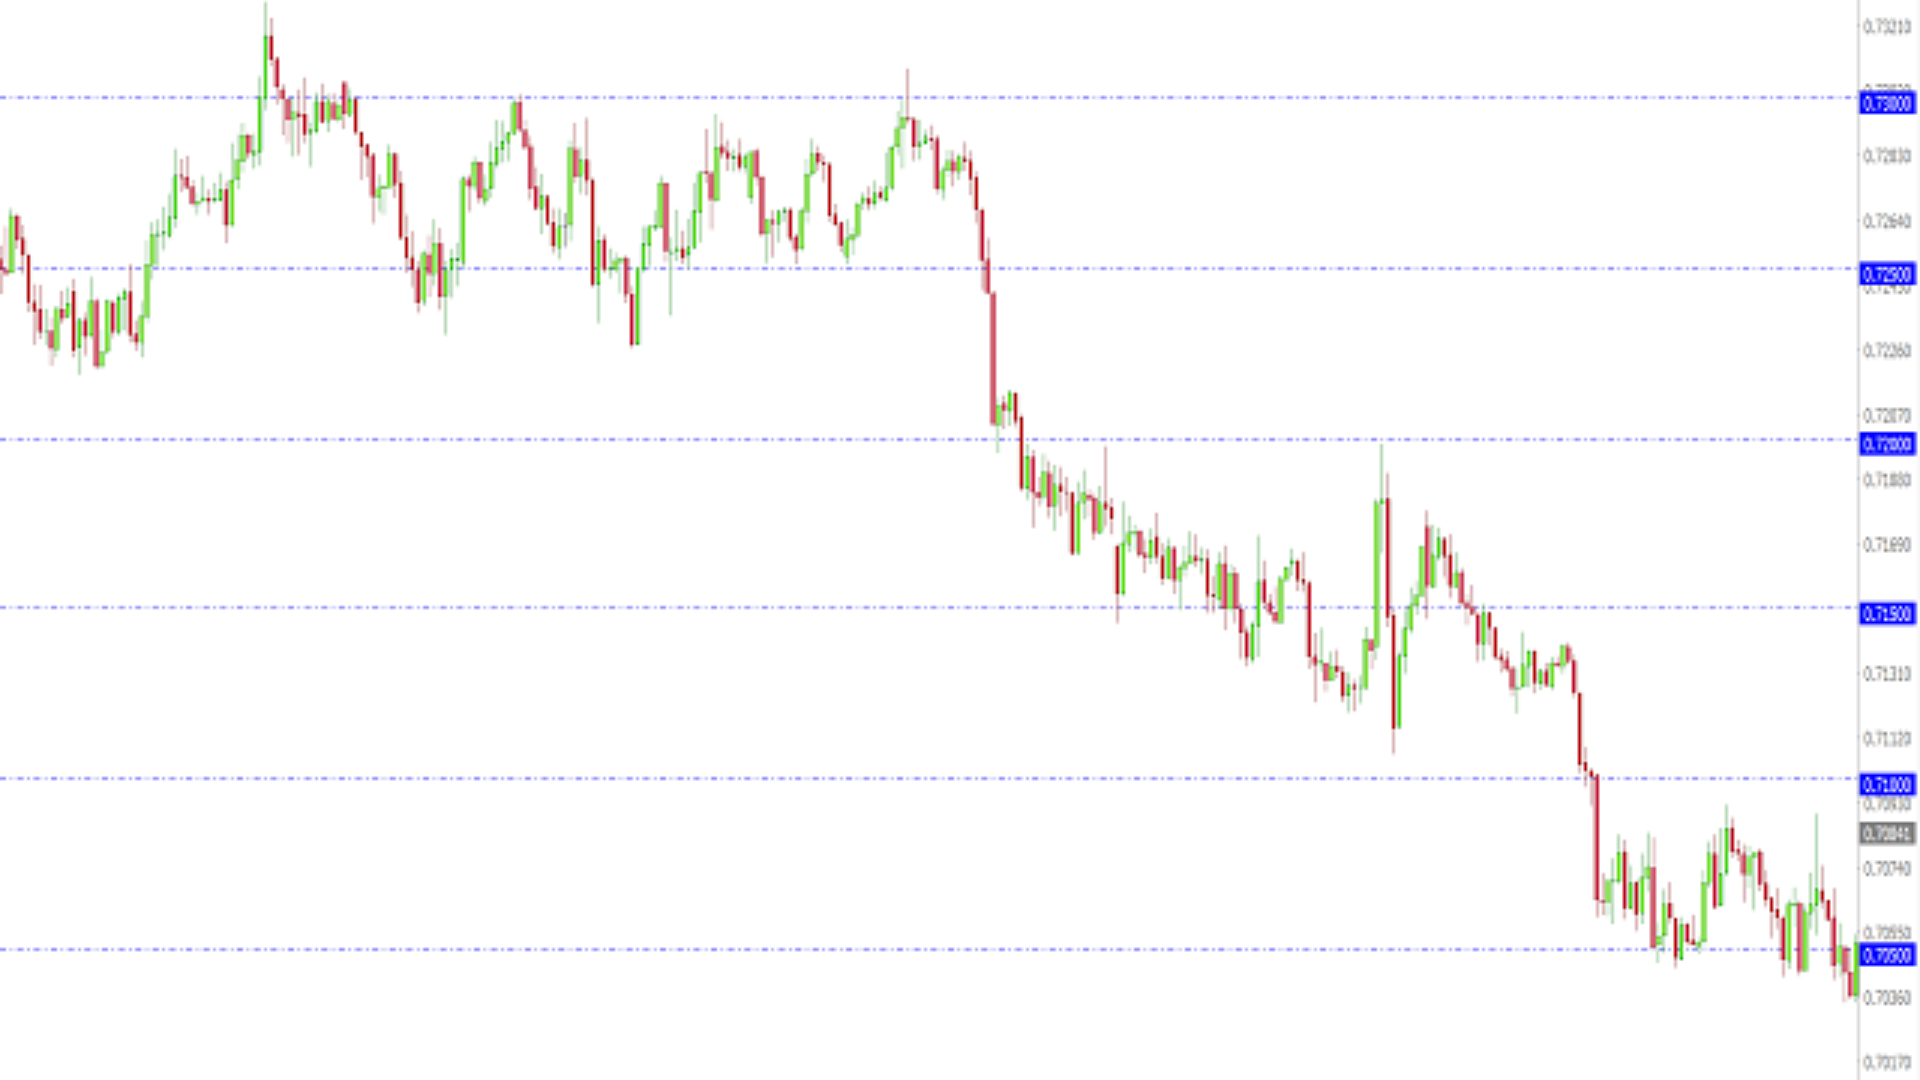
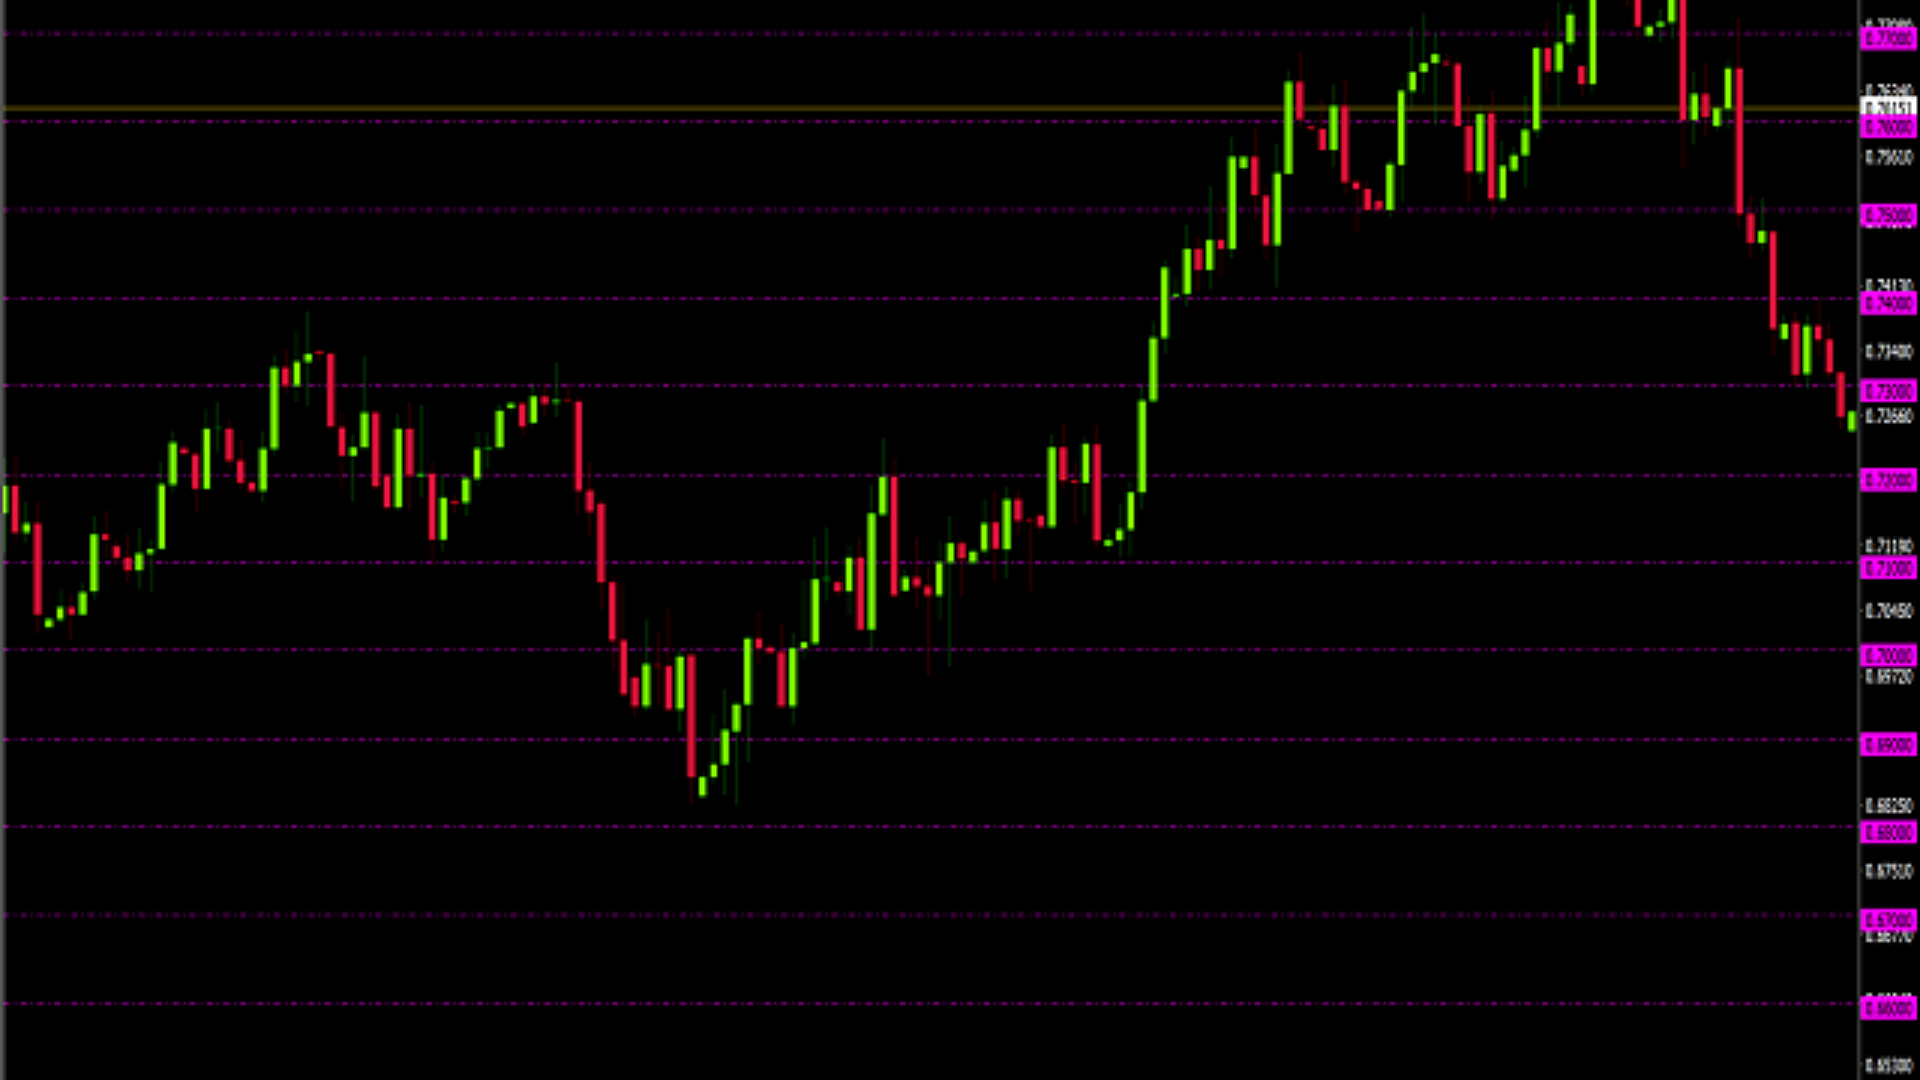
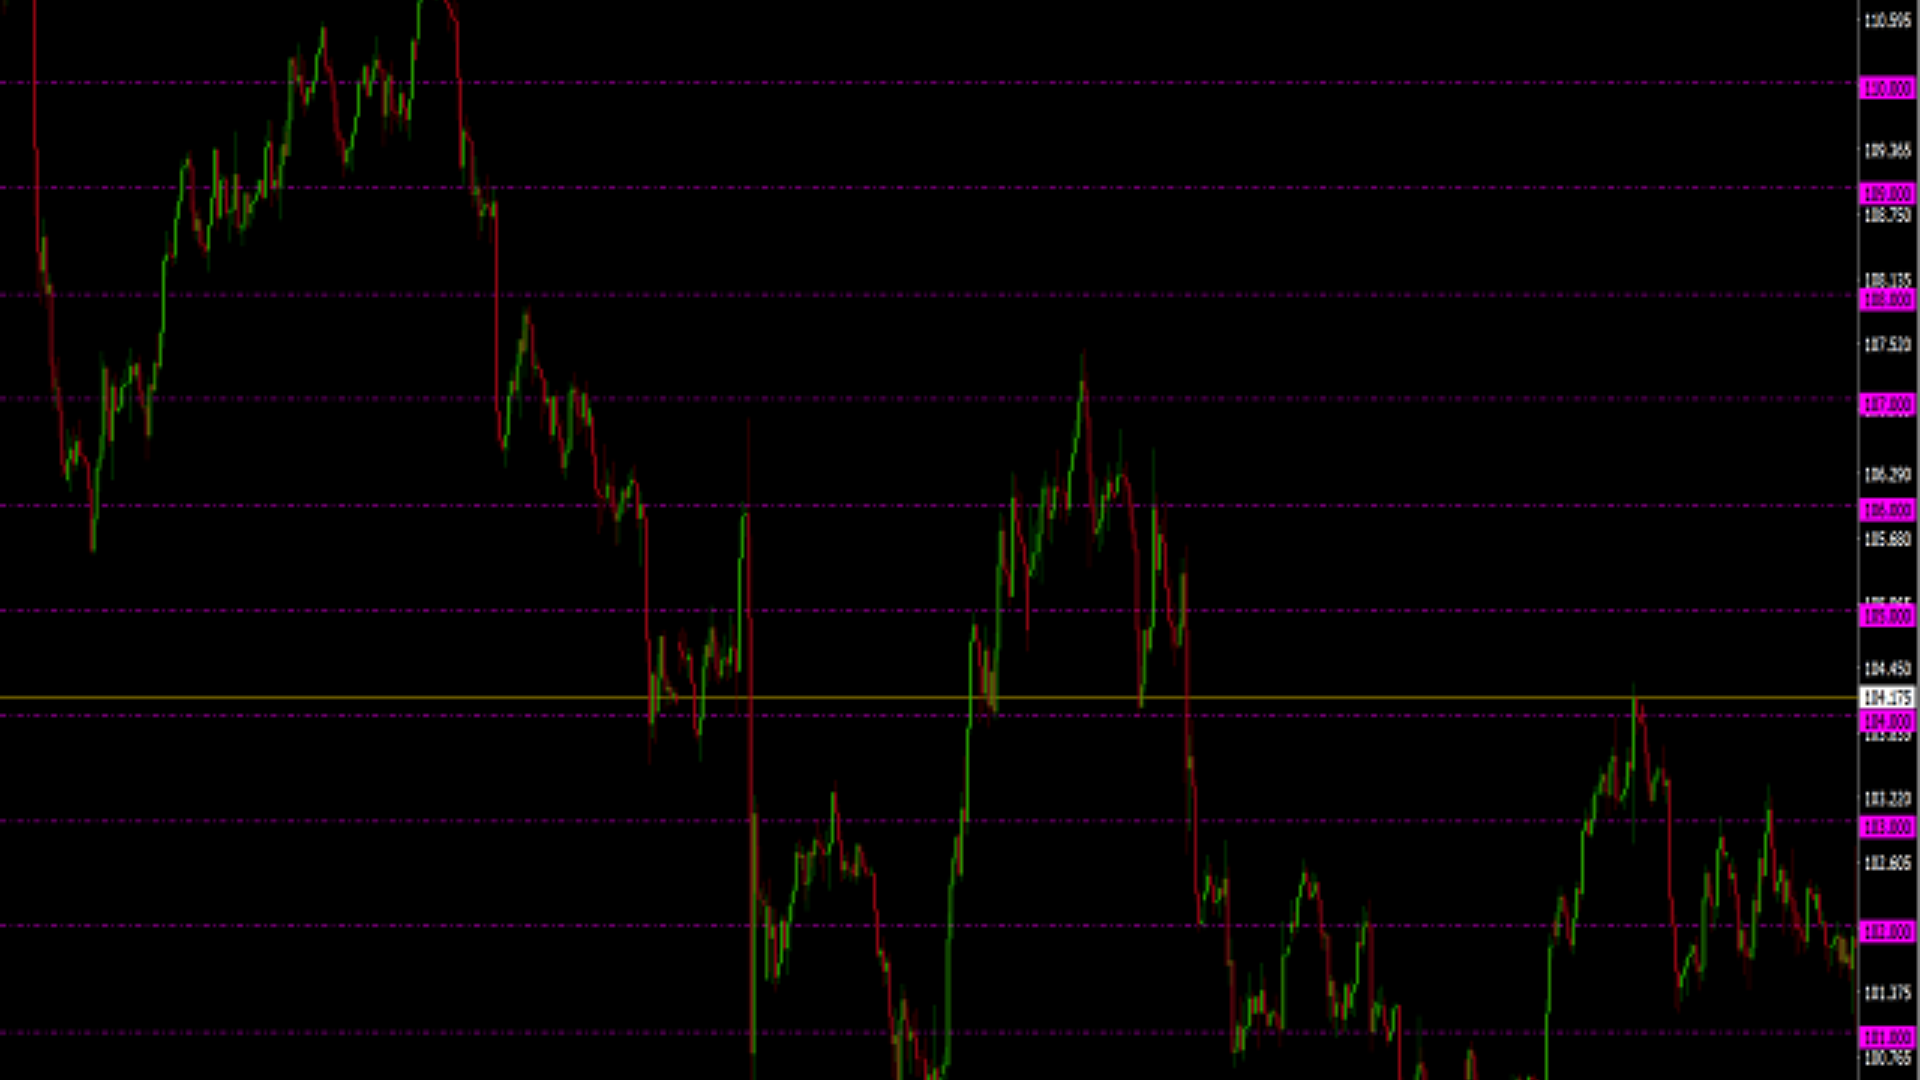
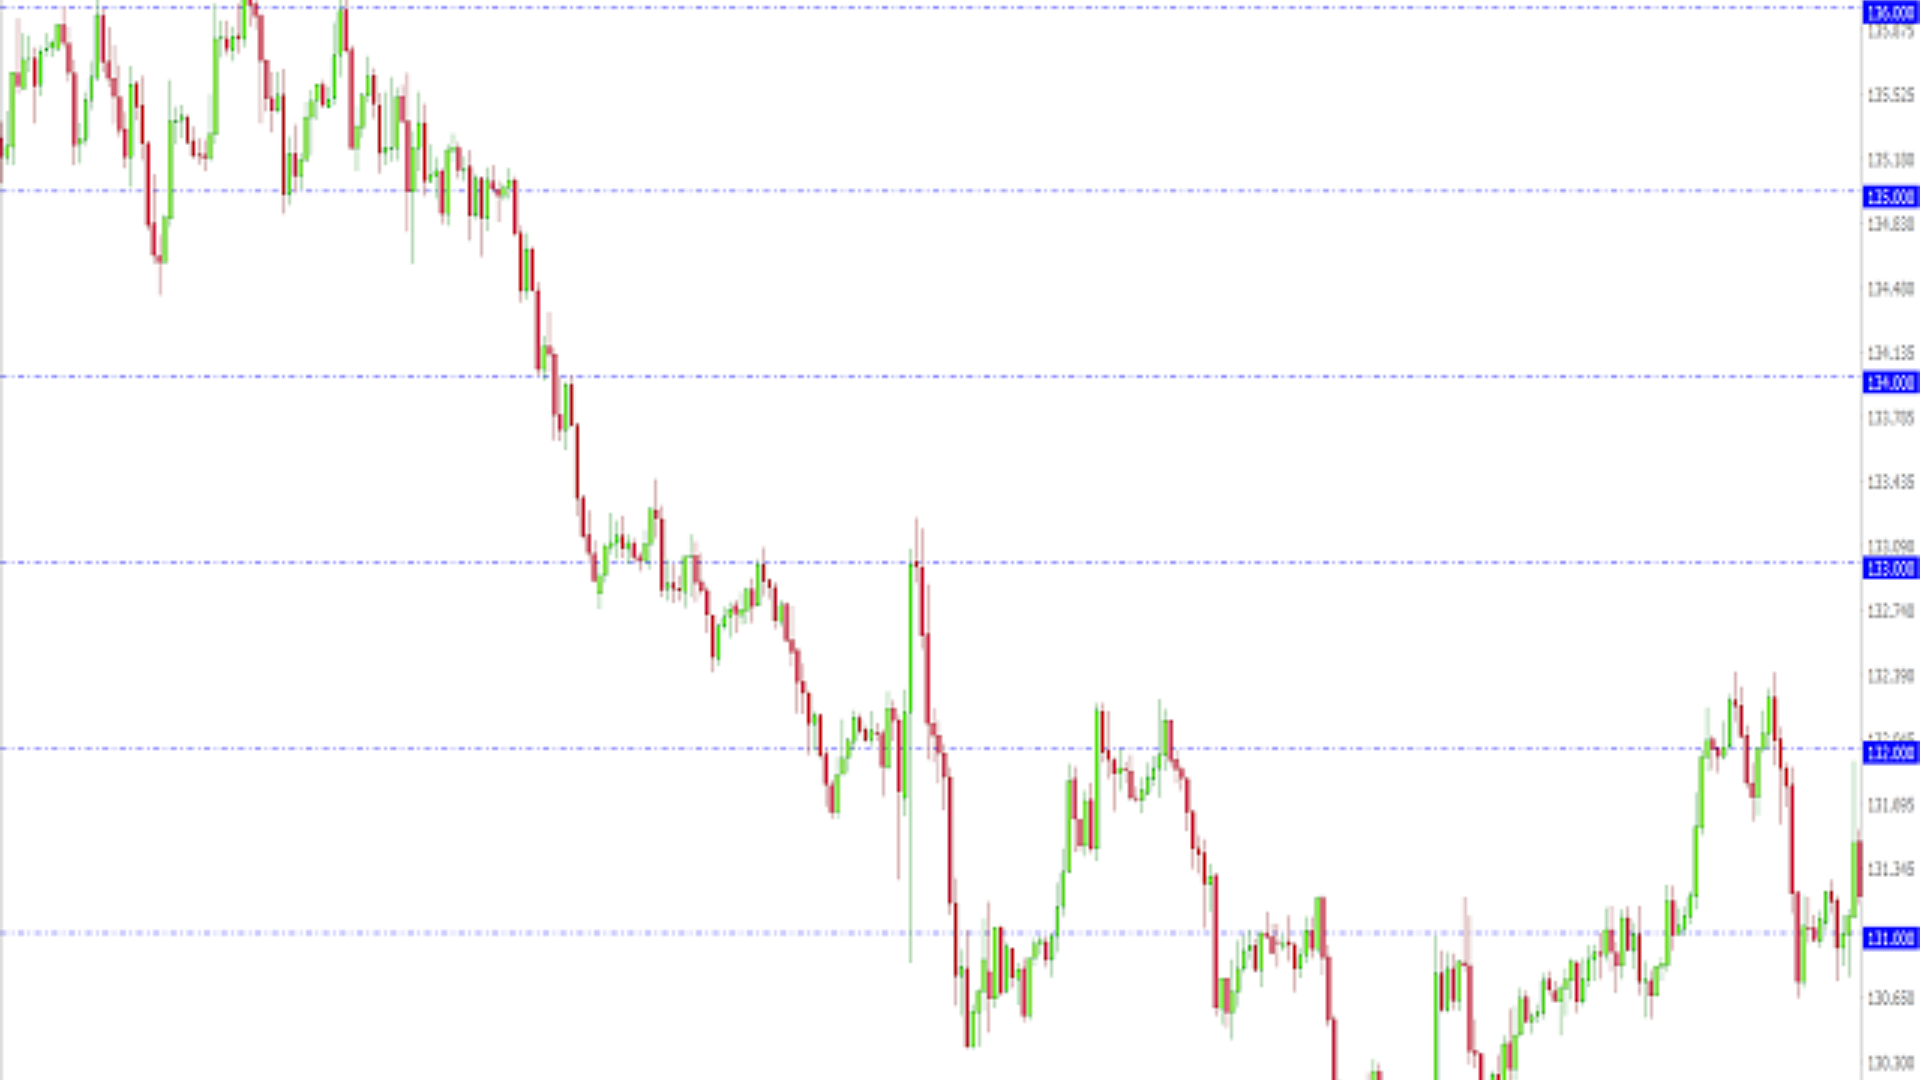
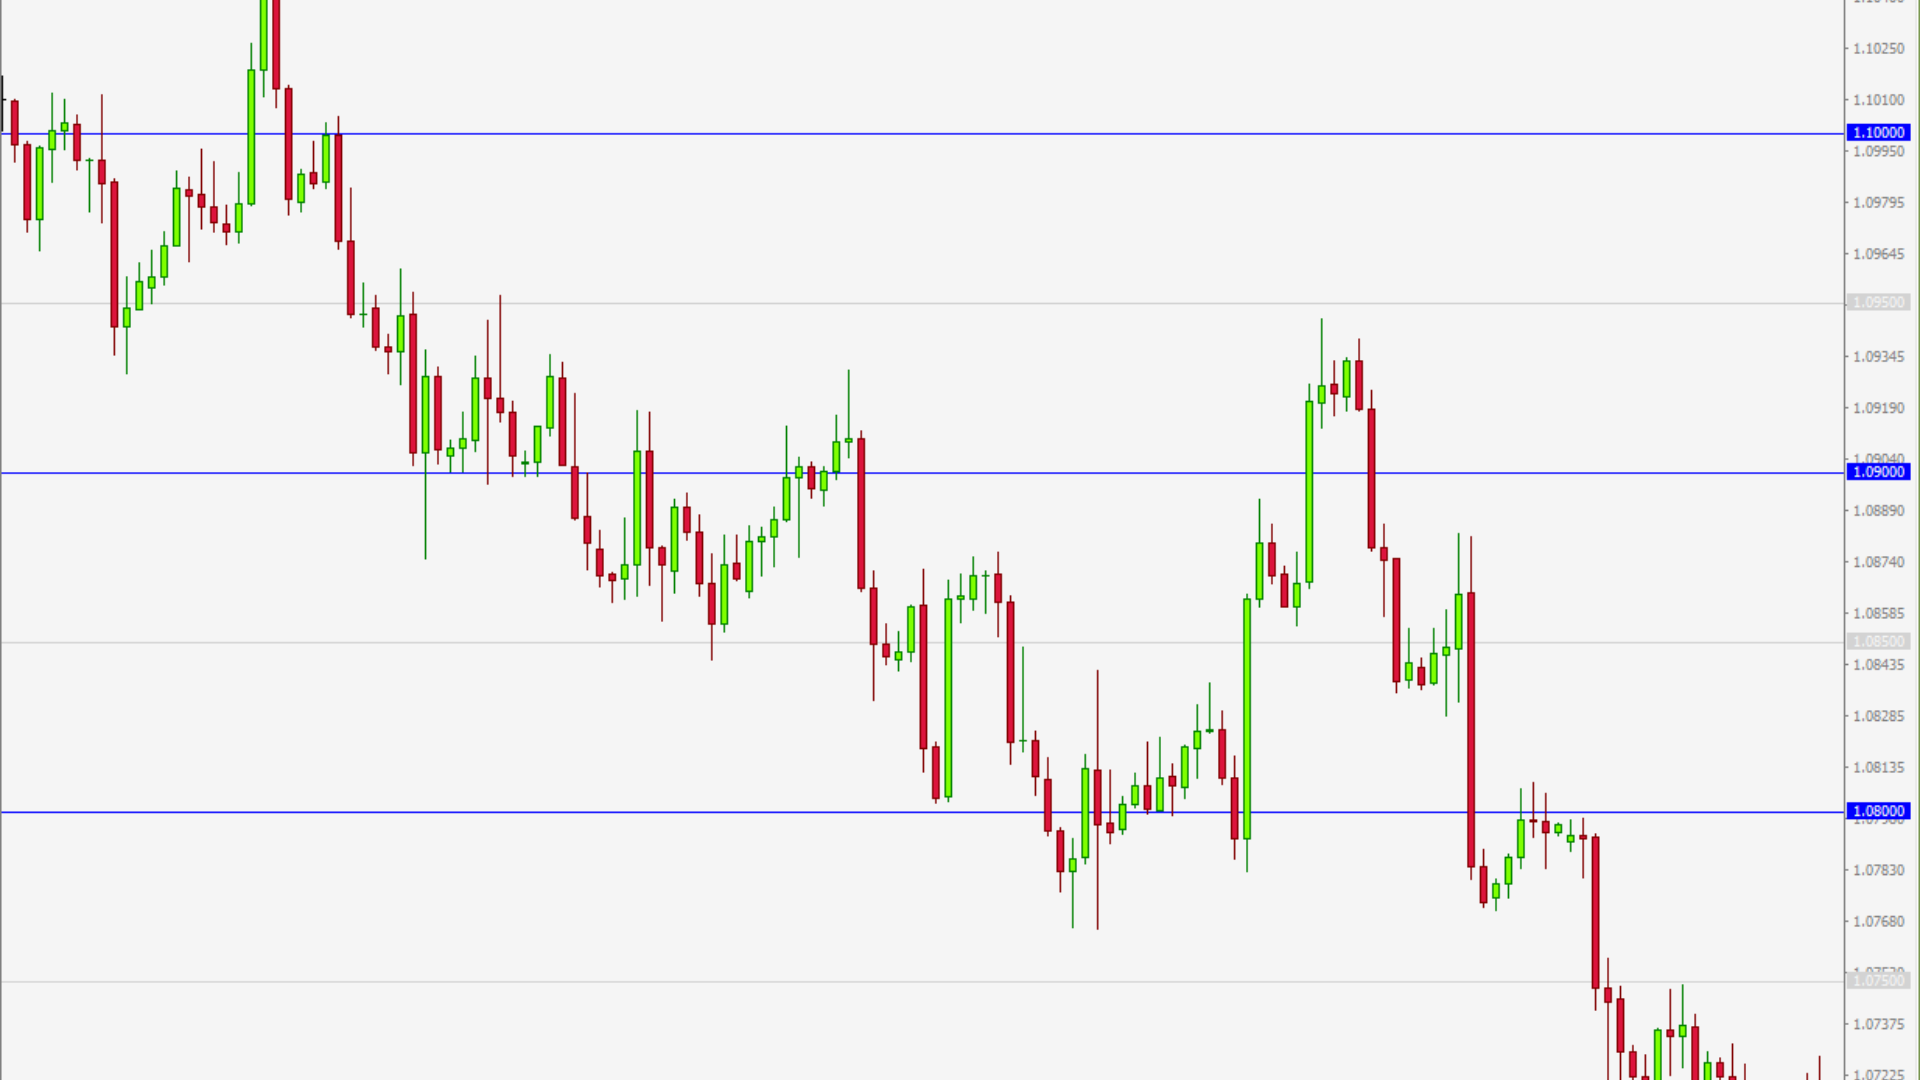
Like Support and Resistance levels, Round Numbers refer to price levels ending in one or more zeros, such as 125.00, 1.0350, 0.8750, 74.50, etc. These are psychological levels where financial institutions and traders expect price to either stall, retrace or breakthrough. On a price chart these figures are generally considered to rule off levels at the 50 and 100 mark.
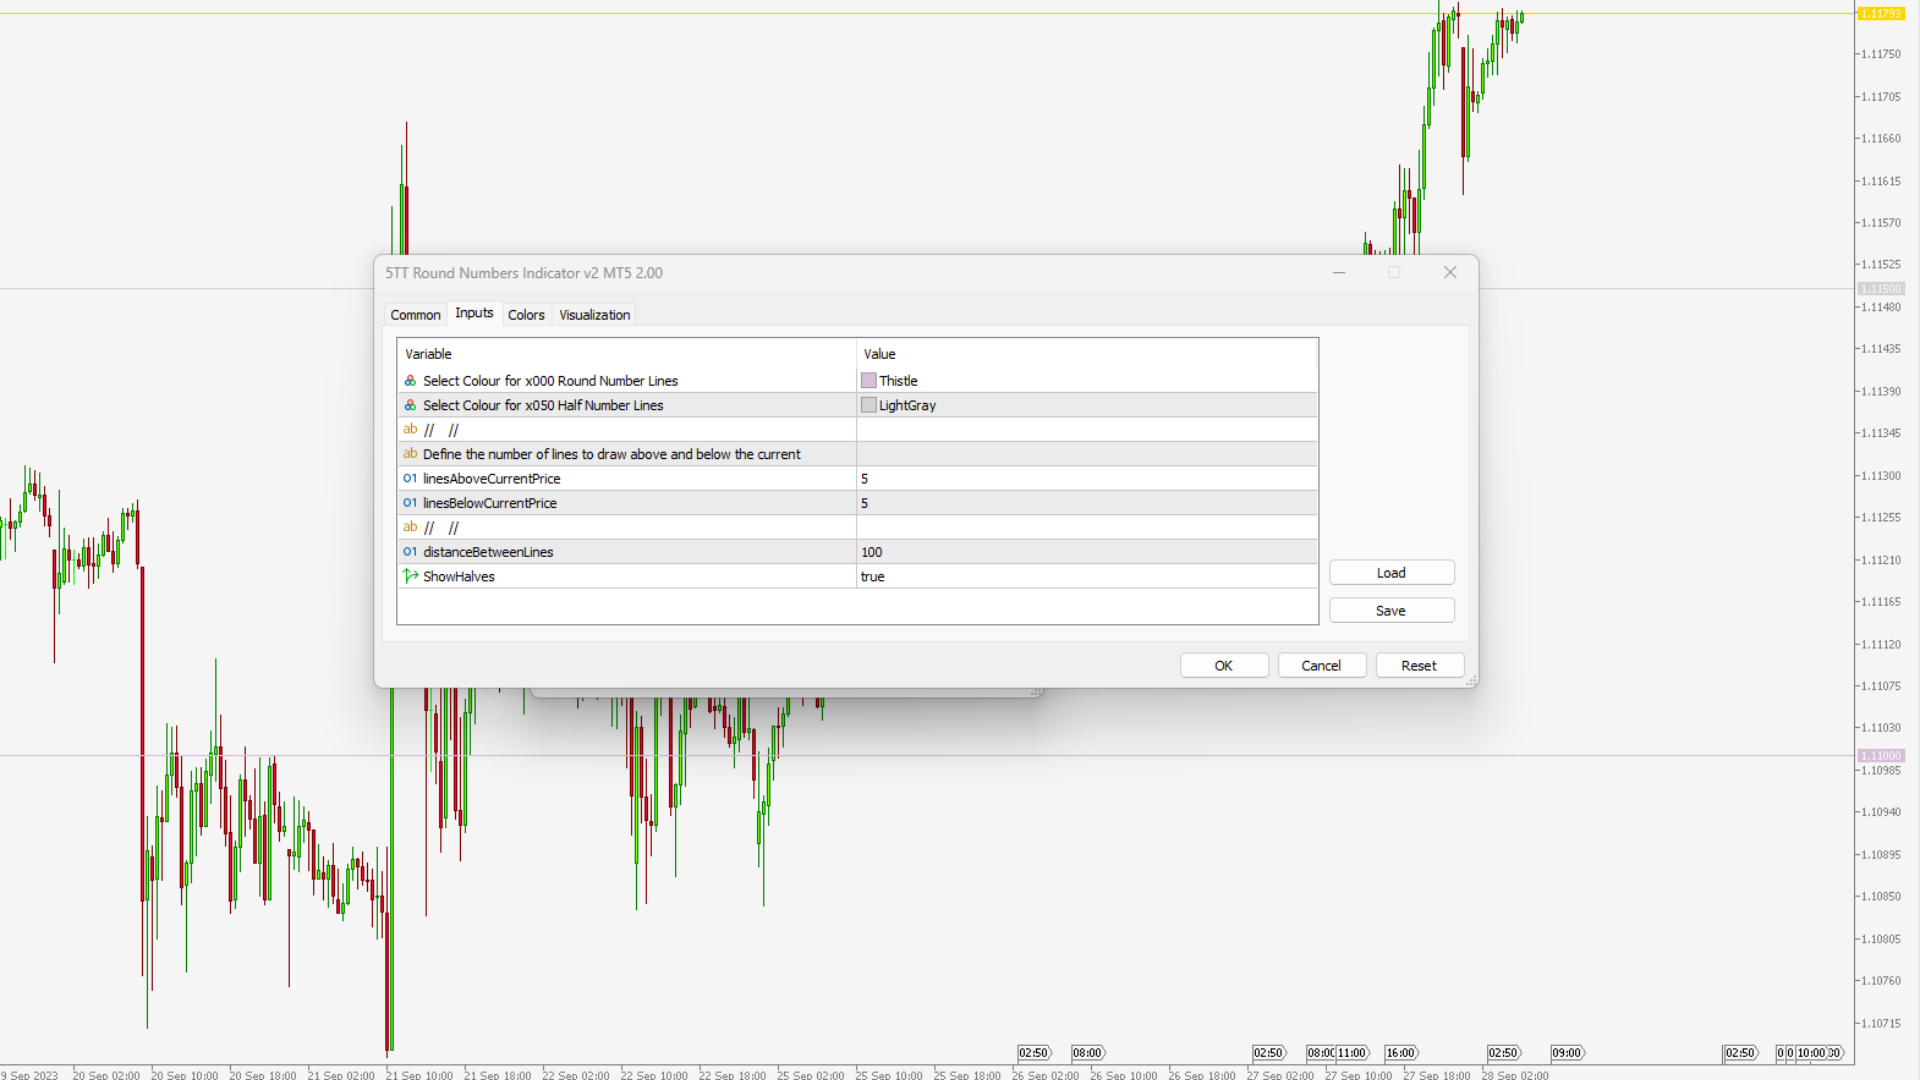
5TT Round Numbers Indicator makes it absolutely easy for the trader to identify these levels on the chart without the laborious and time-consuming exercise of manually drawing these lines themselves.
The Indicator in split seconds draws these lines on any chart and more interestingly, as price advances, the Indicator also draws lines at levels which were previously not visible.