YouTubeにあるマーケットチュートリアルビデオをご覧ください
ロボットや指標を購入する
仮想ホスティングで
EAを実行
EAを実行
ロボットや指標を購入前にテストする
マーケットで収入を得る
販売のためにプロダクトをプレゼンテーションする方法
MetaTrader 5のためのエキスパートアドバイザーとインディケータ - 62

CATAPULT This is a one-of-a-kind expert based on trend. It is based on the successful grid expert, with the help of a multilayer perceptron, the entry point has been refined. Several auxiliary proprietary indicators have been added. The Expert Advisor opens trades variably. How to use the EA
The EA has been optimized for the best performance. Just attach the EA to EUR/USD chart and let it operate by itself. All the required settings have been considered after careful back testing and live te
FREE

Multi Diver EA trades symbols from Marketwatch . The strategy is based on the daily ranges and also on the RSI indicator. Risk management as well as breakeven and trailing stop accompany your positions and protect you from larger losses! You can use an indicator filter to weed out unwanted symbols. EA has been tested in EURUSD, USDCAD, USDJPY, XAUUSD and US30 H1 in the strategy tester and defaulted to these symbols. Please suggest your ideas in discussion. I will implement this as quickly as pos
FREE

Heiken Ashi Smoothed – The Ultimate Trend Filtering Indicator for MT5 Enhance Your Trading with Smoother Trends! The Heiken Ashi Smoothed indicator is a powerful tool designed for traders who want clearer trend signals while eliminating market noise. Unlike traditional Heiken Ashi candles, this smoothed version provides fluid, lag-free price action , making it perfect for swing trading, trend following, and long-term analysis. Key Features: Crystal-Clear Trends – Filters out market noise for
This EA is created by calculating price movements within a time frame according to the time frame in the chart. If the price movement has shown a very active market condition, then the EA will open a transaction according to the specified signal. There are two criteria for market conditions, namely the first is based on market trends and the second is based on price reversals/Pull Back. Specifically for risk management, multiple lots are also provided if you experience losses by taking into acco

The indicator plots two lines by High and Low prices. The lines comply with certain criteria. The blue line is for buy. The red one is for sell. The entry signal - the bar opens above\below the lines. The indicator works on all currency pairs and time frames It can be used either as a ready-made trading system or as an additional signal for a custom trading strategy. There are no input parameters. Like with any signal indicator, it is very difficult to use the product during flat movements. You
FREE

If you love this indicator, please leave a positive rating and comment, it will be a source of motivation to help me create more products <3 Key Takeaways StochRSI is an oscillator that measures the RSI level relative to its high-low range over a period of time. It is more sensitive than the traditional RSI and can highlight overbought or oversold conditions in the market. StochRSI is typically used to generate more frequent and timely trading signals compared with the traditional RSI. StochRSI
FREE

BlueArmor ETH V2 Sample – FREE Version!
BlueArmor ETH V2 – Sample Version is a high-performance Expert Advisor designed for ETHUSD trading on the H1 timeframe. Engineered for intraday and swing strategies, this EA combines robust backtesting optimized using ICMarkets data with adaptive risk management to cater to both assertive and conservative traders.
This sample edition includes an adjustable trailing stop loss , empowering you to lock in profits with precision and flexibility. To encour
FREE
S 500 Precision Block インジケーター – 無料のオーダーブロック可視化ツール このインジケーターは、トレーダーが市場の動きをより深く理解し、戦略的な意思決定を行うための強力なツールです。実績のある**「S 500 Precision Block」エキスパートアドバイザー(EA) から直接抽出されたもので、S&P 500のM30チャート上に 強気および弱気のオーダーブロック**を正確に表示します。純粋なプライスアクション分析に焦点を当てており、複雑な追加インジケーターに頼ることなく、主要なサポートとレジスタンスレベルを視覚的に強調します。これにより、市場の構造を明確に把握し、取引の機会を見つけやすくなります。 重要事項: このインジケーターは、 S&P 500のシンボルとM30の時間枠に特化して開発および最適化 されています。そのため、その信頼性の高い機能と精度は、この特定の構成でのみ保証されます。最適な結果を得るためには、推奨される設定でのご使用をお願いいたします。 自動取引にご興味がありますか? これらのオーダーブロックを 全自動で取引したい 方のために、 「
FREE

Heikin Ashi Candlestick Indicator for MT5 This custom Heikin Ashi indicator provides a smooth visual representation of market trends by filtering out short-term noise, making it easier to identify potential reversals and trend continuations. Unlike regular candlesticks, Heikin Ashi candles are calculated using averages, resulting in more stable and readable chart patterns. Key Features: Clear and smoothed visualization of price action. Compatible with all timeframes and instruments. Lightwe
FREE

MT4 version Overview The Lowess Channel indicator is a smoothed trend-following tool designed to help traders identify the direction of the trend , detect flat or ranging markets , and spot breakouts from consolidation zones. It creates a central smoothed line with upper and lower channel boundaries, adapting to market noise while maintaining clarity. How It Works The indicator builds a channel around a smoothed price line. The central line reflects the current trend. The upper and lower bounda
FREE

。。。。。。。。。。。。。。。。。。。。。。。。。。。。。。。。。。。。。。。。。。。 This indicator is based on Bollinger Bands indicator. It helps user clearly know the Band is expand or contract.
The method of use is the same as the traditional Brin channel index. Users can use different color areas to distribute forest channel indicators in expansion or contraction stage. -------------------------------------------------------------------------------------------
FREE

This utility EA will display simple renko, hence the name essential renko. The renko will be shown in a new tab and using custom symbol.
Please do note (especially for those who new to Renko), that Renko does not follow timeline as it will follow price movement.
That's why it has a lot of potential where you can attach any EA that you want and use any custom indicator in this new custom symbol for renko. Always use M1 timeframe.
Most of the time you don't need to change anything. But if you d
FREE

The indicator draws daily support and resistance lines on the chart, as well as the Pivot level (reversal level).
Adapted to work in MT5
The standard timeframe for calculating support and resistance levels is D1. You can choose other timeframes according to your strategy (for example, for M1-M15, the optimal timeframe for calculations is H1)
The function for calculating support and resistance levels has been updated; in this calculation option, fibonacci levels are taken into account, respec
FREE

The technical indicator Trend Strength Analyzer measures the deviation of the price of an instrument from average values over a specific period of time. A comparative analysis of the relative strength of bulls and bears underlies the indicator. If bulls prevail, an upward trend. If bears are stronger - a downward trend.
Settings:
Strike Energy (2 solid lines) = 14.
Influence Power (2 dotted lines) = 50. The TSA oscillator is effective in an active market. The most commonly used indicator
FREE

Risk Per Trade Manager MT5 is a one-shot, smart execution Expert Advisor (EA) built for traders who prioritize precision risk management . Designed for both beginner and advanced users, it places a single trade per session , automatically calculating the lot size based on your defined stop loss and risk percentage. Optional Take Profit (TP) and Trailing Stop features give you full control over how the trade evolves — from entry to exit. Key Features Risk-Based Lot Calculation
Automatically ca
FREE

This expert advisor can enter and exit trades at specific times and on specific weekdays, expressed in GMT Time. It offers weekday selection, trade management settings, a martingale function and money management features. [ Installation Guide | Update Guide | Troubleshooting | FAQ | All Products ] Easy to use and supervise Fully configurable entry and exit times (up to 5 trades)
Enable or disable trading weekdays in inputs
Customizable break-even, stop-loss, take-profit and trailing-stop setting
FREE

The Expert Advisor for this Indicator can be found here: https://www.mql5.com/en/market/product/115567 The Contraction/Expansion Breakout Lines with Fair Value Gaps (FVGs) Indicator for MetaTrader 5 (MT5) is a powerful technical analysis tool designed to help traders identify and visualize breakouts at critical levels of contraction and expansion in financial markets. By incorporating Fair Value Gaps (FVGs), this indicator enhances traders' ability to gauge market sentiment and anticipate poten
FREE

The Andean Oscillator is a powerful momentum-based indicator designed to help traders identify trends, reversals, and market strength with high precision. Inspired by traditional oscillators like the MACD and RSI, this unique tool smooths out price fluctuations and provides clearer signals for both entry and exit points.
Key Features: • Momentum & Trend Detection – Helps traders spot bullish and bearish momentum shifts early. • Smoothed Oscillator – Reduces noise and provides more reliable t
FREE
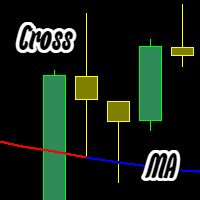
このインジケーターは2色の移動平均線(MA)を表示します: 青色 — 前の足の始値と終値がMAラインの上にある場合。 赤色 — 前の足の始値と終値がMAラインの下にある場合。 カスタマイズ可能な設定: MAタイプ(単純、指数、平滑、線形); MA期間; MAの色変更時のアラート。 不具合があればお知らせください。修正します。 bar cross Moving cross candle cross Moving cross bar cross MA cross candle cross MA cross bar cross Moving Average cross candle cross Moving Average cross bar このインジケーターは2色の移動平均線(MA)を表示します: 青色 — 前の足の始値と終値がMAラインの上にある場合。 赤色 — 前の足の始値と終値がMAラインの下にある場合。 カスタマイズ可能な設定: MAタイプ(単純、指数、平滑、線形); MA期間; MAの色変更時のアラート。 不具合があればお知らせください。修正します。
cr
FREE

CustomRSI50 - レベル50のカスタムRSIインジケーター 説明 CustomRSI50は、人気のある相対力指数(RSI)に基づくカスタム技術指標です。このインジケーターは、多くのトレーダーがモメンタム分析で重要視するレベル50に特に焦点を当て、RSIの明確でカスタマイズ可能な視覚化を提供します。 主な特徴 設定可能なRSI期間 強調表示された50レベルの参照ライン カスタマイズ可能な適用価格タイプ 別ウィンドウでの表示 解釈が容易な0から100までの固定スケール カスタマイズ可能なパラメータ RSI_Period: RSI計算の期間を設定できます(デフォルト:14) applied_price: 計算に使用する価格タイプを選択できます(デフォルト:終値) CustomRSI50の使用方法 MetaTrader 5の任意のチャートにインジケーターを適用します。 RSI期間と価格タイプを好みに応じてカスタマイズします。 50レベルに対するRSIの動きを観察します: 50を上回る値は上昇モメンタムを示します。 50を下回る値は下降モメンタムを示します。 シグナルの解釈と上位サイク
FREE

Wyckoff fans, enjoy!
Ideally to be used with the Weis Waves indicator, but it can be easily used alone, the Waves Sizer puts the range (in resulting Price movement) done by the Price on its market swings. You can control how accurate or loose will be the swings. This tool is very helpful for visually know how much the Price has traveled in your Timeframe. This way you can confront this level of effort with the resulting Volume, etc... Weis Waves indicator:
https://www.mql5.com/en/market/produc
FREE

Introducing the "Fibonacci Retracement EA": A free, educational tool designed for new and aspiring traders. This Expert Advisor helps you understand a classic trading strategy by visually demonstrating its logic directly on your chart. It is based on a simple yet effective trend-following strategy. It uses the "EMA200" as a filter to determine the main trend (uptrend or downtrend). It then waits for the price to retrace to a specific "Fibonacci level" (default is 61.8%) before opening an order.
FREE

The indicator displays the size of the spread for the current instrument on the chart. Very flexible in settings. It is possible to set the maximum value of the spread, upon exceeding which, the color of the spread label will change, and a signal will sound (if enabled in the settings). The indicator will be very convenient for people who trade on the news. You will never enter a trade with a large spread, as the indicator will notify you of this both visually and soundly. Input parameters: Aler
FREE

**Experience Smarter Trading with FVG Super Signal**
Unlock simpler, more decisive trading with **FVG Super Signal**, an advanced MT5 indicator from the WinWiFi Robot Series. This powerful tool uniquely combines the Fair Value Gap (FVG) technique with robust trend-following logic.
* **Clear Signals:** Delivers intuitive Buy/Sell alerts, simplifying your trading decisions. * **Universal Compatibility:** Works seamlessly across all assets and timeframes. * **Highly Versatile:** Ideal for all tr
FREE

(Feel free to download this at absolutely no cost, if you like it I have a scalping manager here: https://www.mql5.com/en/market/product/101312 )
[Feel free to suggest on improvements that can be implemented. This EA will forever remain free.]
Timeframe: 5 Min upwards (The 1 minute timeframe has very short candles, stoploss cannot be set) Currencies: Multi
Settings: Lotsize: the trading volume for the EA How long a position will be held: 900 000 milliseconds for the 5 minute time or an equav
FREE
Volatility Distance Indicator The Volatility Distance Indicator measures in real time the distance between current price and the moving averages you choose, expressed in points . Its purpose is to provide a clear, objective, and quantitative view of the market’s expansion relative to its equilibrium zones , allowing you to instantly assess whether price is in a phase of overextension, compression, or neutrality . Key Features: Point-based measurement: displays the exact distance between current
FREE

Free forever simple pip meter for MT5 with customizable font color. Display profit or loss in both points count and currency value. Supports 4 currency symbols ($,€,£ ,¥). For unsupported currencies, it shows a 3-character currency short form. Enhance your trading interface with clarity and precision. Easy to use and tailored for diverse Forex traders. Perfect for MT5!
FREE

Product Name: Anchor auto TP and SL Trade Manager MT5 Your manual trade will be managed automatically. Turns single trades into smart grids with auto-sync TP/SL.
Anchor Auto TP and SL Trade Manager is a powerful trade assistant designed for manual traders who use averaging or recovery strategies. Stop calculating grid levels manually! This EA turns your manual trade into an automated "Anchor." If the market moves against you, the EA automatically builds a recovery grid based on your specific S
FREE

This indicator calculates the difference between the SELL aggression and the BUY aggression that occurred in each Candle, plotting the balance of each one graphically. Note: This indicator DOES NOT WORK for Brokers and/or Markets WITHOUT the type of aggression (BUY or SELL).
Be sure to try our Professional version with configurable features and alerts: Delta Agression Volume PRO
Settings
Aggression by volume (Real Volume) or by number of trades (Tick Volume) Start of the Aggression Delta
FREE

AnCap's Agnostic is a versatile Expert Advisor designed for automated trading on MetaTrader 5. This EA dynamically adapts to market trends using a combination of Relative Vigor Index (RVI) for longer period trend detection in user selectable timeframe and Relative Strength Index (RSI). It incorporates two separate Moving Averages (SMA) and MACD indicators for entry signals for both bearish and bullish trends detected based on RVI.
It employs a risk-managed approach with simple trailing stop l
FREE
TradeSystem 取引する日にバーを選択します。このバーが閉じると、ロボットはろうそくの安値で2つの注文を送信し、もう1つはキャンセルされます StopLoss ストップは、買いの場合は安値より1ティック下、売りの場合は高値より1ティック上になります TakeProfit テイクはstopLossの範囲に必要な量を設定でき、戦略の最適化でコストをかけることができます 最適化 このロボットにはリスクリターンを取得するための入力があるため、メタトレードの戦略最適化で実行して、取引するシンボルの最適な入力を取得できます TradeSystem torihiki suru hi ni bā o sentaku shimasu. Kono bā ga tojiru to, robotto wa rōsoku no yasune de 2tsu no chūmon o sōshin shi, mō 1tsu wa kyanseru sa remasu StopLoss sutoppu wa,-gai no baai wa yasune yori 1 tikku-ka, uri no baai
FREE
Equity monitor
This is a simple means change informer. I wrote it for myself, maybe someone will need it...
1. Displays the change in funds for the day. Every day, when the terminal is first launched, it remembers the current funds and monitors changes throughout the day.
2. The first day of the month, well remembers the money and, within months, to monitor changes.
3. Well, it displays the profit of the open position.
To work, you need to create 4 global variables: gvarEqityDay , gvarEq
FREE

Script to load history of a symbol on determined timeframe (default M1).
It is extracted from the MQL5 documentation:
https://www.mql5.com/en/docs/series/timeseries_access
Adapted by Renato Fiche Junior #melhoresferramentas #renato #larissasihle #aguiatraders
Parâmetros de Entrada
- Start datetime : the initial datetime from the history will be loaded - Timeframe to be loaded: period that will be loaded
FREE

Simple utility to help identify local time of price movements. This way you can analyze better and prepare for future movements. Just point to the candle and it will display the time of the candle in your local time zone.
See my other products in the MQL market: https://www.mql5.com/en/users/jdelgadocr/seller Thanks for checking them out. If you have a need for something not too complex, let me know.
FREE

Introducing the Professional Arka STM Signal Indicator
With Arka Candle Close Time – 100% Free Version Fast, Accurate, and Unmatched in Identifying Trading Opportunities
This indicator is the result of combining advanced price action analysis with specialized market algorithms, delivering clear, timely, and profitable signals. Completely Free – No Installation or Usage Limits
️ An automated trading bot, fully synchronized with it, is also ready to run. The Power of ARKA STM Signa
FREE

What is this indicator?
このFX検証ソフトは MT5でリアルトレードのように過去検証するためのインジケーター です。 共通の垂直線を移動するごとに、 全てのチャートの表示位置を共通の垂直線を基準に同期します 。 チャートモードを切り替えれば、 リアルトレードのように過去検証することも、チャート全体を見て過去検証することも可能 です。
How to set up
1. 対象の通貨ペアのチャートを過去方向に最後までスクロールして ヒストリカルデータを全てダウンロード します。 2. このインジケーターを各チャートの メインウィンドウにインストール します。 3. このインジケーターのプロパティ画面のインプットタブで 各パラメーターをカスタマイズ します。
How to use
1. 共通の垂直線を同期したい位置のローソク足に重ねて チャート位置を同期 します。 2. 必要に応じて チャートモードを変更 します。 3. 各チャートを比較して チャートパターンを検証 します。
Unique objects Common Thread : 各チャートの位置を同期
Reverse TradeCopier for Followers can copy trades from an account that is running Reverse TradeCopier for Source . Features: Copies trades from one source (master) account to multiple following (slave) accounts. Allow investor (read only) password for source (master) account. There are no complicated settings and input parameters, everything is easy. Works with different brokers. Works with different quotes symbols (EURUSD_FX, eurusd_m, etc.). Can copy orders from 4-digit quotes platform to 5-
FREE
GLEBシリーズ、バージョン1.0。分棒用の簡単なスライダープログラム。 アクティブな取引時間を含む多くの設定。 ベイディールに基づいて、セルディールを接続できます。 説明: 1.ストラテジースイッチ:キー「スピード」(オン/オフ) 2.トレンドコントロール:シャドウコントロール(オン/オフ) 3.バーのトレンドコントロールの深さ:Shdwcntrlのシャドウハイ 4.スプレッドコントロール:スプレッドコントロール(オン/オフ) 5.スプレッドリミッター:ボリュームスプレッドコントロール(ポイント) 6.ストップロスの自動計算:自動計算SLおよびTP(オン/オフ) 7.ストップロス範囲を自動的に縮小:ストップロス範囲を縮小(オン/オフ) 8.ストップロス低減率:低減率SL(1-max、1.5、2、... low) 9.タイク利益削減率:削減率TP(1-max、1.5、2、... low) 10. taik利益の自動追求:AUTO継続取引(オン/オフ) 11.ストップロスがトリガーされたときにセールを開始します:SLロス-売り(オン/オフ)
取引システムは開発中です。フィードバックを残
FREE

Indicator IRush uses a modified version of a popular indicator RSI (Relative Strength Index) to look for entries on a daily chart or lower. The indicator has been set up and tested with the major symbols: AUDUSD, EURUSD, GBPUSD, USDCAD, USDCHF, and USDJPY. An automated trading with this indicator is implemented in the expert advisor Intraday Rush . This expert advisor can open, trail and close its trades. Check it out, it may be exactly what you are looking for!
A Correct Reading of IRush
The c
FREE

Sapphire Strat Maker Alt is an EA builder ( Expert Advisor Builder) . With it you can easily create new strategies and optimize them to find the bests parameters to improve your results at maximum. The objective is to bring the capabilities of MQL5 to everyone, even if you don't know how to code. Check out the Pro Version clicking here - Sapphire Strat Maker .
With this Expert Advisor you can create strategies by combining the indicators provided by the EA. A few of the functionalities ar
FREE

Telegram Signal Sender for MetaTrader 5 This Expert Advisor (EA) provides a streamlined interface between MetaTrader 5 and Telegram. It is designed to automatically forward trading events—including order execution, closure, and modifications—to specified Telegram channels, groups, or private chats in real-time. Developed with a focus on reliability and performance, this utility is suitable for signal providers, prop traders, and individuals who require remote monitoring of their trading accounts
FREE

Liquidity Seeker EA
Why You MUST Have This EA Unlock the power of ICT (Inner Circle Trader) methodology with the most advanced Smart Money Concept trading system available. This EA transforms complex institutional trading concepts into automated precision, giving you the unfair advantage that professional traders use to consistently profit from liquidity manipulation and market structure shifts. START trading WITH market makers using their own playbook. You don't need to do much other than to
FREE
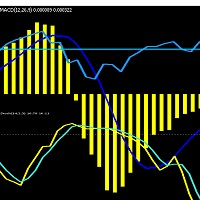
Use Stochastic with oversold and overbought to find trading opportunities. Use RSI to identify strength of trend anf confirm the trend matches the stochastic overbought and oversold. Trade on MACD cross matching the trend identified by Stochastic and RSI. Set stop loss at a recent swing high or swing low. Set take profit as a ratio of stop loss. Exits are on take profit and stop loss only, there is no exit signal.
FREE
ステップバイステップ「トレーリングストップ」
このユーティリティを使用すると、「トレーリング ストップ」ツールを使用する際に、価格に従って「ストップ ロス」を移動するステップを設定できます。 「MetaTrader」ターミナルで利用可能な「通常の」「トレーリング ストップ」とは異なり、「ストップ ロス」の動きを 1 ピップ単位で設定できますが、この「トレーリング ストップ」は任意の増分で設定されます。 この設定により、価格が一方向に長時間移動した後、小さな修正のために反転し、その後再び同じ方向に移動し続ける場合に、偽のトレンド反転中にポジションを閉じることを回避できます。 可変の「ストップロス」移動ステップで「トレーリング ストップ」ツールの作業を管理しやすくするために、ツールの操作を実装するスクリプトは、開発者の Dmitry Fedoseev によって既存の取引パネル「eInTradePane」に適合されています。 トレーディング パネルのソース コードは、 https://www.mql5.com/en/code/220 で自由に入手できます。 「トレーリングストップ」が追加さ
FREE

StopLevel メーターはSTOPLEVELレベルを制御します。レベルが変わると、アラートで合図します。 STOPLEVEL- ストップ注文を出すための現在の終値からのポイントでの最小オフセット、またはポイントでの最小許容ストップロス/テイクプロフィットレベル。 STOPLEVELのゼロ値は、ストップロス/テイクプロフィットの最小距離に制限がないこと、またはトレーディングサーバーが端末に送信できない動的レベル制御のための外部メカニズムを使用していることを意味します。 2番目のケースでは、STOPLEVELは実際には「フローティング」です。 インジケーター設定: color_-レベルのゾーンの色 draw_bars-レベルゾーンを表示するためのバーの数 width_price-価格ラベルの厚さ
FREE

This indicator automatically draws horizontal lines at 00s, 20s, 50s and 80s levels. If you trade ICT concepts and are an ICT Student, then you know that these levels are used as institutional support/resistance levels and/or fibonacci retracement anchor points. Features
Draws horizontal lines at 00, 20, 50 and 80 levels above and below current market price . Choose the amount of levels to show on chart Customizable line colors Recommended for forex currency pairs. Saves time looking for thes
FREE

Cybertrade ATR Trend Zone - MT5 The indicator shows, by calculating the ATR (Average True Range), the zone of probable price resistance. Indicated to be used as a probable exit point of an operation.
It works on periods longer than the period visible on the chart. All values are available in the form of buffers to simplify possible automations. This indicator is the same one we use in our EA. Also check out our other products.
FREE
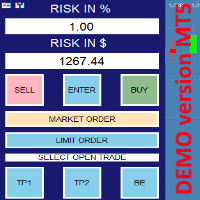
this is DEMO VERISON (for demo acc.) of TRADING OVERLAY with PARTIAL take profit ("virtual TP") and % risk lot size
--- full version available on my 'seller page' as well as version for MT4 Take better control of your trades with ease ! Easy lot size calculation with easy SL/TP setting. Your trading will be much more comfortable with this tool!
Main goal with this tool is very SIMPLE and FAST operation! Works like any EA, add it to selected chart and trade !
Features: start tra
FREE

Genaral: Not martingale, not a grid; Use on EURUSD Use on M5
Signals: There is a good rational algorithm. Work of two indicators: 2 DeMarker (from 2 timeframes) (you can set a separate Timeframe for each indicator)
Stop Loss/Take Profit: There is a good money management system (there are several type for trailing stop loss); There is virtual levels of Stop Loss / Take Profit; There is smart lot (percent by risk) or fix lot
Important: EA can work on closed candles, and on current candles;
FREE

The Color Candles Indicator uses custom colors to highlight candles that follow the main market trend, based on the Moving Average. This simplifies the analysis of price movements, making it clearer and more direct. When the price is above the rising Moving Average, candles are highlighted indicating a BUY opportunity. When the price is below the declining Moving Average, candles are highlighted indicating a SELL opportunity.
Input Parameters : Period Method Applied Price
The moving averages
FREE
MGH ZigZag Fibonacci – Version 1.3 MGH ZigZag Fibonacci is a fully automated trading system for MetaTrader 5, specifically designed for Gold (XAUUSD) on the M15 timeframe. This EA combines the internal ZigZag structure with the Fibonacci Retracement framework to create an accurate mechanism for detecting high-probability swing points, reversals, trend continuation zones, and support breakout patterns. It also features multi-layered momentum filtering and a stop-loss mechanism. V
FREE

About the indicator: DALA Forecast is a universal tool for predicting the dynamics of time series of any nature. For prediction, modified methods of nonlinear dynamics analysis are used, on the basis of which a predictive model is built using machine learning methods. To get the trial version of the indicator, you can contact me in private messages.
How to use the indicator: Apply the indicator to your chosen financial instrument or indicator with the settings you need. The prediction will be
FREE

Traders Toolbox Premium はオールインワンツールです それらの戦略と計算を自動化するために、一般的な取引戦略に関する広範なトレーニングに基づいて作成されました。 (Jason Kisoglooによって設計およびプログラムされました) 特徴: 19個々の信号 -これらの信号の それぞれ は、ニューラルネットワークスタイルの構成でバイアスされ、最終的な/全体的な結果を構成します。 各信号には独自の設定が あり 、必要に応じてカスタマイズまたは最適化できます。 包括的なオン - 画面 - ディスプレイ -包括的な情報とツールチップを備えた6つのスナップアウェイパネル。 (パネルの境界線をクリックして、折りたたんだり、離したりします...設定は機器ごとに自動的に保存されます): 信号パネル -バイアス情報と信号の詳細を含む信号分析を表示します。 ニュースパネル -アップ、さらにはニュース来 トン の に基づいて 予測 の イベントへのカウントダウンと現在の機器に影響を。 (内部M T5 エコノミックカレンダーと 外国為替ファクトリースクレー

Protect Your Profits. Limit Your Losses. Trade With Confidence.
The ultimate tool for professional traders and prop firms. EquityGuard PRO doesn’t just stop losses before they exceed your daily limit—it also locks in profits automatically with its optional Auto-TakeProfit feature. Maximum Protection: closes trades or locks your account when hitting the daily loss limit.
Auto-TakeProfit: set your targets and let the system secure gains—emotion-free.
Foolproof Trading: no more overtrading,
FREE

The Magic LWMA indicator is of great help in determining trend direction. It can be an excellent addition to your existing strategy or the basis of a new one. We humans can make better decisions when we see better visually. So we designed it to show a different color for rising and falling trends. Everyone can customize this in the way that suits them best. By setting the Trend Period, we can optimize it for longer or shorter trends for our strategy. It is great for all time frames.
IF YOU NEE
FREE

EA Hiloseven é baseado em 2 médias móveis simples, máximas e mínimas dos últimos 7 períodos. MODO TENDÊNCIA: Compra no fechamento da vela acima da média das máximas. Fecha a negociação com stoploss ou fechamento da vela abaixo da máxima de 7 períodos. A venda ocorre de maneira inversa. MODO CONTRA TENDÊNCIA: Compra no fechamento da vela abaixo da média das mínimas. Fecha a negociação com stoploss ou fechamento da vela acima da mínima de 7 períodos. A venda ocorre de maneira inversa. -----------
FREE

This is an OLD indicator which was rather efficient to be paired with MA Cross, Bollinger Bands, Dochian Channel and many other strategies and this provides you with market change of BEAR and BULL trends. Since there isn't much listed in MT5 Market, I would like to share my very own indicator for your usage. Please feel free to comment or criticize for better and improvement of the indicator listed.
FREE

This strategy uses Bollinger Bands and the Relative Strength Index (RSI) to identify potential trade opportunities. It is designed for both mean-reversion and trend-following approaches, making it suitable for various market conditions. How It Works: Bollinger Bands assess volatility and identify overbought/oversold conditions. RSI gauges momentum and confirms potential market reversals. Trade Entry: Buy: When the price reaches or falls below the lower Bollinger Band, and the RSI is below 30 (i
FREE

A very useful Price Action point is the previous day Closing VWAP. We call it Big Players Last Fight . This indicator will draw a line showing on your chart what was the last VWAP price of the previous trading session. Simple and effective. As an additional bonus, this indicator saves the VWAP value on the Public Terminal Variables, so you EA could read easily its value! Just for the "Prefix + Symbol name" on the variables list and you will see!
SETTINGS How many past days back do you want to s
FREE

このプロジェクトが好きなら、5つ星レビューを残してください。 機関が大きなボリュームを取引するので、それらが試してみることは珍しくありません
特定のパーセンテージレベルでポジションを守る これらのレベルは、あなたが使用できる自然なサポートと抵抗として役立ちます
取引を入力するか、ポジションに対する危険性を認識する。 このオシレータは、以下の比率の変動を示します。 日。 週。 月 日 クォーター。 生年月日 サポートと抵抗をトレースするサブウィンドウで。
FREE
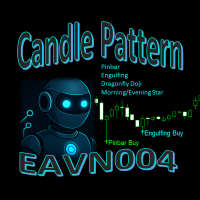
EAVN004 – Trading with Pinbar, Engulfing, Dragonfly Doji, and Morning Star Candlestick Patterns In the world of financial trading, simplicity is sometimes the key to effectiveness . EAVN004 is designed based on the principle of identifying well-known candlestick patterns such as Pinbar , Engulfing , Dragonfly Doji , and Morning Star . These patterns help traders detect potential trend reversals and make informed decisions to open BUY or SELL positions. EAVN004 offers customizable settings for St
FREE
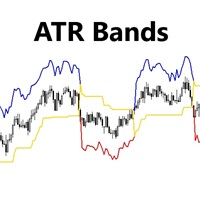
Indicator Shows ATR bands and Trailing Stop Line. Use it in your trend following strategy to improve your stop loss trailing and Trend. Adjust ATR Period and ATR Factor for your Symbol. This indicator has 3 outputs: 0- Upper Channel Data 1- Lower Channel Data 2- Main Line Data Please call me if you need more input parameters or modified version of this indicator.
FREE

Ultimate Grid Trader - The Ultimate Gold Trading EA The Ultimate Grid Trader is a powerful, fully automated Expert Advisor (EA) designed to trade XAUUSD (Gold) using a smart combination of RSI, Bollinger Bands, Stochastic, and ATR indicators . This EA follows a grid trading strategy , allowing traders to maximize profits by dynamically reinforcing positions while maintaining effective risk management. How It Works: Utilizes multiple RSI indicators across different timeframes to confirm trend dir
FREE

Main: Not martingale, not a grid; Working on all symbols;
Signals: There is a good rational algorithm. Work of two indicators: Stochastic and OsMA (you can set a separate Timeframe for each indicator)
Stop Loss/Take Profit: There is a good money management system (there are several type for trailing stop loss); There is virtual levels of Stop Loss / Take Profit; There is smart lot (percent by risk) or fix lot
Important: EA can work on closed candles, and on current candles; Quickly opti
FREE
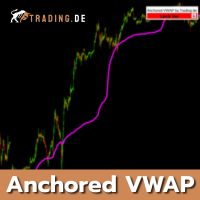
Specially developed Anchored VWAP for MetaTrader 5 (MT5) from Trading.de. To match our day trading strategy, you can place an Anchored VWAP in your chart. The Volume Weighted Average Price indicator can be adjusted in color and also fixed on the chart. It is possible to choose real volume as well as no real volume in the settings. The indicator is best suited for day trading in a 1-minute chart, as you learn in training at Trading.de.
You can use "E" on your Keyboad to lock/unlock the AVWAP, to

The Average Price indicator calculates the average prices of BUY (LONG) and SELL (SHORT) open positions, taking into account the size of open positions, commissions and swaps.
The indicator builds the average line of LONG open positions, after crossing which, from the bottom up, the total profit for all LONG positions for the current instrument becomes greater than 0.
The indicator builds the average line of SHORT open positions, after crossing which, from top to bottom, the total profit for a

Equity Risk Manager EA is a smart, compliance-focused tool designed to protect your trading capital by monitoring equity performance in real time. It automatically blocks new trades when your profit or loss thresholds are reached, based on your selected period — daily, weekly, or monthly. No more accidental overtrading or commission losses: once your target is hit, the EA alerts you and halts further entries. Ideal for disciplined traders who value risk control, clarity, and automation.

SMC Precision AI – Institutional Smart Money Concept Indicator for MetaTrader 5 Unlock the edge of institutional trading with SMC Precision AI – an advanced AI-powered Smart Money Concept (SMC) indicator built for serious traders who want precision, clarity, and high-probability trade setups.
Key Features:Smart Money Concepts (SMC) – Identifies key liquidity zones, order blocks, mitigation zones, and market structure shifts used by institutions.
AI-Powered Signals – Enhanced by real-time AI l

Crash 1000 Scalping Indicator for the Crash 1000 Deriv Synthetic Index. Introduction The Crash 1000 Scalping Indicator is a specialized tool designed for the Crash 1000 index on the Deriv Synthetic market. This indicator is particularly useful for scalping on the M1 timeframe, helping traders to identify precise entry and exit points for buy positions. It is designed to be non-repainting, providing clear signals with audible alerts and push notifications, and is compatible with mobile devices th

Vulcan FX is an expert advisor (EA) designed for trading EURUSD on the H1 timeframe, integrating dynamic trade execution with structured risk management. It supports both dynamic and fixed lot sizing, featuring a trailing stop mechanism with configurable step pips, trailing profit pips, take profit pips, and break-even pips to manage risk and secure gains. The EA can manage up to 100 open positions, allowing traders to execute trades in both directions or restrict activity to sell-only mode. Bu
MetaTraderマーケットは、他に類のない自動売買ロボットやテクニカル指標の販売場所です。
MQL5.community ユーザーメモを読んで、取引シグナルのコピー、フリーランサーによるカスタムアプリの開発、支払いシステムを経由した自動支払い、MQL5Cloud Networkなど、当社がトレーダーに対して提供するユニークなサービスについて詳しくご覧ください。
取引の機会を逃しています。
- 無料取引アプリ
- 8千を超えるシグナルをコピー
- 金融ニュースで金融マーケットを探索
新規登録
ログイン