 MetaTrader 5
 エキスパート
 インディケータ
 ライブラリ
 ユーティリティ
 ウィジェット
 ルール
YouTubeにあるマーケットチュートリアルビデオをご覧ください
ロボットや指標を購入する
仮想ホスティングで
EAを実行
EAを実行
ロボットや指標を購入前にテストする
マーケットで収入を得る
販売のためにプロダクトをプレゼンテーションする方法
MetaTrader 5のためのテクニカル指標 - 232
 テクニカル指標からのシグナルは、株式および外国為替市場での取引の開始と終了に重要な役割を果たします。指標の本質は、将来の価格変動を予測することを目的とした金融銘柄価格の数学的変換です。
テクニカル指標をテストして、市場の動きとそれからの利益をより正確に予測します。

Footprint MLP transforms tick-level market activity into footprint features and uses a multilayer perceptron machine learning model to learn nonlinear relationships between order flow and future price behavior. It captures temporal context through lagged inputs, rolling statistics, multi-timeframe features, and paired-symbol data, with configurable training, chronological validation, and feature selection.
Three Learning Modes
Base Learn trains a model using the configured parameters; training

Footprint GBDT is a machine-learning system that applies Gradient-Boosted Decision Trees to market data represented through tick-derived footprint features. Lagged observations, rolling statistics, and multi-timeframe inputs provide temporal context, while configurable training, chronological validation, feature selection, and paired-symbol data support model development and evaluation.
Three Learning Modes
Base Learn trains a model using the configured parameters; training runs across multi

Alpha Buy Sell Signal KPG - ユーザーガイド (MT5) Alpha Buy Sell Signal KPGは、MetaTrader 5向けのトレンドフォローおよびモメンタム分析をサポートするために設計されたインジケーターです。チャート上に明確な買いシグナルと売りシグナルを表示し、動的なトレンドリボンとマルチタイムフレームダッシュボードを組み合わせて、トレーダーが市場の方向性とモメンタムの強さを視覚的に把握できるようにします。
このインジケーターは、現在のトレンドバイアスをチャート上に直接表示することで意思決定をサポートするように設計されています。これには、動的なトレンドライン、色分けされたリボン、および現在の市場状況に基づくシグナルの推定強度を反映するパワースコア(Power Score)が含まれます。また、確定足で新しいシグナルが出現すると、音声アラーム、画面のポップアップ、スマートフォンへの通知をトリガーします。
買いシグナルと売りシグナルは色付きの矢印として表示されます。各矢印には、推定シグナル強度を反映するパーセンテージ数値(Power Sco
FREE

OVERVIEW
The market structure indicator helps traders easily read market trends, this indicator shows trend continuity and trend reversals, this tool will be very useful for beginners who are just getting to know market structure, the indicator will provide visualization of the patterns that occur
Key Features: BOS pattern The indicator will provide an overview of the Break Of Structure pattern, where the pattern will indicate the continuation of the trend. CHOCH Pattern The indicator will pr

God's Eye God's Eye is an institutional-grade volatility, market structure, and algorithmic liquidity engine built specifically for MetaTrader 5. Unlike typical lagging retail indicators that rely on basic smoothing formulas (like EMAs or Bollinger Bands), God's Eye scans raw historical price action structures across multiple timeframes simultaneously. It maps out institutional liquidity pools, equal high/low stop-loss clusters, and asset-adaptive volatility exhaustion levels with zero lag. Whe

Market Scanner Board shows the trend of many symbols on four timeframes in one clear table, so you see in seconds where the market is moving and where it is quiet. What you see for every symbol Price and day change in % Trend on M15, H1, H4 and D1: UP, DOWN or FLAT (price and fast EMA above or below the slow EMA) Trend bar: how many timeframes agree RSI on H1 (overbought and oversold values are coloured) RANGE: today's range in % of the average daily range (ATR D1). Values above 100 % are highli

SpikeLinker: Análisis Institucional Sin Fronteras SpikeLinker no conoce de límites geográficos ni de clases de activos. Su arquitectura de código híbrida está diseñada para ofrecer una experiencia analítica de nivel institucional en cualquier mercado financiero del mundo , adaptándose de forma automática a la volatilidad y estructura del activo donde lo coloques. Descripción Comercial Global (Lista para tu Web o Tienda) Lleva tu operativa al siguiente nivel sin importar el instrumento que
FREE

Bressert Cycle Signals Like the logic of this tool?
All author's products: https://www.mql5.com/ru/users/musa1994/seller
Trading philosophy: https://developer-mql4-mql5.netlify.app/ Bressert Cycle Signals (BCS) is a professional cyclical indicator for MT5, adapting Walter Bressert's methodology. It combines oscillator phase analysis with precise "Setup & Trigger" entry mechanics, displaying signals directly on candlesticks. What the indicator shows Bressert Oscillator (subwindow):

Weis Wave by Mudasser turns raw tick or real volume into clear up and down waves — so you can read effort vs. result at a glance.
Instead of looking at single-bar volume, this indicator stacks volume for as long as price keeps moving in the same direction. When the close flips, a new wave begins. The result is a clean histogram of blue (bullish) and red (bearish) volume waves that make climax, effort, and absorption easy to spot.
WHAT YOU GET • Cumulative volume waves based on close direction

MT5用CCIインジケーター(アラート機能付き・リペイントなし) - 最も人気があり、信頼性の高いトレーディング・オシレーターの一つです。 - PCおよびモバイル向けアラート機能を内蔵:買われすぎ/売られすぎゾーンへの出入りを検知し、アラートを通知します(レベル設定はカスタマイズ可能)。 - 仕組み:現在の価格と過去の平均値との乖離を測定します。主要レベル:±200、±100。 - トレード戦略:買われすぎゾーンからの脱出で「売り」シグナル、売られすぎゾーンからの脱出で「買い」シグナルを捉えるのに最適です。 - 重要レベル:±200、±100。 - あらゆる時間足でスムーズに動作し、トレンド相場におけるプライスアクション分析との相性も抜群です。 Click here to see high quality Trading Robots and Indicators! 本製品はMQL5サイト限定のオリジナル商品です。

MID Regime Filter – Adaptive Market Regime Filter ( protection, adaptive filtering, and the 4 market regimes ) Overview The MID Regime Filter is not a classic entry signal indicator. It is a powerful, adaptive market context filter designed specifically for algorithmic traders and Expert Advisor (EA) developers. It analyzes real-time market volatility and directionality to classify the current environment into one of 4 distinct market regimes . This allows your EA to dynamically enable, disab

JC OB Strategy turns your MetaTrader 5 chart into a complete Order Block engine: it finds institutional demand and supply zones, and the moment an Order Block is confirmed it opens a trade plan with ENTRY, STOP LOSS and three take-profit targets on the chart. WHAT IT DOES - Order Block detection (SMC/ICT engine): a bullish OB is a bearish candle followed by a strong bullish confirmation candle that closes above its high; a bearish OB is the mirror image below the low. Optional classic swing-base

Professional Fibonacci tool for MT5 featuring true opacity background zones, smart color gradients, and custom ATAS-style price labels. Detailed Description: Are you tired of the default, rigid Fibonacci tool in MT5 that clutters your charts and hides price action? Color Fibo Pro completely upgrades your charting experience by bringing the modern, clean, and highly customizable visual style of premium order flow platforms (like TradingView or ATAS) directly to your MetaTrader 5. Designed by a pr

Charts247 Price Value Bands MT5 Is price cheap, fair or stretched right now? Fair value with value bands measured from how far price really travels, the share of closes beyond each band, return arrows, a two-close T3 line, confirmed peaks and the M5 Fibonacci. Nothing repaints. Every market swings around a fair value. Most of the time it stays close; now and then it stretches far away, and from there it usually comes back. Charts247 Price Value Bands shows how far is far for the symbol and time

Formexは、平均日次変動幅(ADR)を中心に構築された、複数の要素からなる市場分析指標であり、変動幅分析、市場構造、通貨の強さ、トレンド評価を1つの統合ツールに組み合わせたものです。 Formexは、その中核として過去のADR(平均日次変動率)データを用いて、日々の始値を中心とした動的な価格水準を算出し、表示します。これらの水準は、市場の平均レンジ、現在の価格変動幅、潜在的な反応領域、そして想定される価格目標を構造的に把握するのに役立ちます。 ADR分析には、自動ブレイクアウト検出、ブレイクアウトレベルの視覚的識別、およびオプションのATRベースのブレイクアウトゾーンが含まれています。前日のADR反応を利用して、当日の取引における関連レベルを強調表示することも可能です。 FormexはADRに加え、以下の市場分析要素も組み込んでいます。
ADRマトリックスとシンボル分析 統合されたシンボルパネルでは、マーケットウォッチから直接、複数の銘柄の概要を確認できます。シンボルは、ADR(平均預かり価値)の測定値、またはADR水準への価格の近さに基づいて並べ替えることができます。個々のシン

AlgoTrade Pivot Points draws the daily, weekly, or monthly pivot point, resistance, and support levels on the chart and shows the current price position on a card. It reads data only. What it does Five formulas: Classic, Fibonacci, Camarilla, Woodie and DeMark, based on the previous day's, week's or month's high, low and close (DeMark also uses the open). Levels from R1 and S1 up to R3 and S3, or up to R4 and S4 with Camarilla. Lines for the current period from its start, showing each level's na
FREE
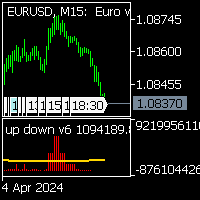
up down v6 for mt5 is no repaint all timeframe and all pairs indicator. red histogram cros trigger that is up point,and put a red point on histogram. and blue histogram cros trigger that is deep point.and put blue point on histogram. this indicator need to sometimes zoom out .for thise pres + button. if newly comes signal is too high makes before invisible.red and blue points are there.to see the signals. indicator is no repaint and can use all time frame and all pairs. only need minimum 500 bar
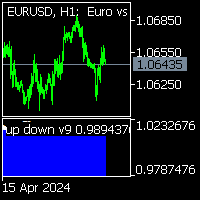
indicator is no repaint trend indicator.for mt5 when white stars up to Red histogram that is probably end of long trades. when White stars up to Blue histogram that is probably end of down trades. indicator can use all pairs and lower than weekly charts, to use weekly chart need to at least 500 bars data on back.and lowering processing value 500. it is also suitable for 1m charts. indicator hold long way to go. there is not too many signals.
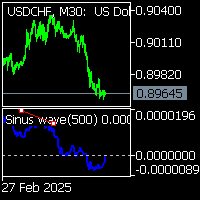
Sinus wave indicator is a extra ordinary oscillator.to find divergency.for mt5 it works all pairs and all timeframes. suitable for experienced and beginner traders.. indicator works on toward of the prices... while sinus wave go up side that means prices will up. and while sinus wave go down that means prices is going down. it gives divegency when trend reversals. there is wave to set default 500. on pictures divergency lines and letters has been drawn by hand.to explain how it works.

The “Kalman Filter Color” indicator was faithfully designed based on the official Python library called pykalman, which in turn was based on the original Kalman filter created by Rudolf Kalman in 1960. The traditional Kalman filter is based on an algorithm that has a wide variety of applications in physics and engineering. It involves the control and prediction of states (prices) based on self-adjusting mechanisms and in the presence of noise. In this case, pykalman has been adapted and optimiz
FREE

AlgoTrade Correlation Matrix shows how the symbols of your list move together, as a colored matrix on a card, with the symbols that move most with and most against the chart symbol. It reads data only. What it does Up to 10 symbols from a comma separated list (by default EURUSD, GBPUSD, USDJPY, AUDUSD, USDCAD, USDCHF, NZDUSD, XAUUSD). The chart symbol is added when it is not in the list. Finds each symbol at your broker, with the chart symbol's prefix and suffix (for example EURUSD.pc). Tabs for
FREE

This indicator automatically detects and visualizes specific market trading sessions (such as the Asian session and custom timeframes) directly on your chart. Here is a brief, professional breakdown of its key functions: Session High & Low Highlighting: It draws a colored background box (rectangle) covering the exact duration of the selected trading session, using the highest and lowest prices formed during that period. Key Structural Levels & Breakout Tracking: The indicator automatically plot
FREE

AlgoTrade ATR Stop Levels displays the average true range (ATR) of the chart symbol and the stop distance: ATR times a multiplier. It draws the stop for a buy and the stop for a sell on the chart, and shows the ATR on four timeframes on a card. It reads data only. What it does The ATR of the last closed bars (14 by default), on the chart timeframe or on M15, H1, H4 or D1. Stop distance equals ATR times the multiplier (1.5 by default), rounded up to whole ticks. Two dashed lines from the newest b
FREE

AlgoTrade Round Number Levels draws round price levels around the price and shows on a card the levels just above and below, the distance to each, and how many times the price visited each one today. It reads data only. What it does Major levels: 100 pips on forex pairs, or a step of about 1% of the price on other symbols (for example 50 on gold). You can also set the step yourself. Minor levels: 50 pips on forex, or a smaller step such as 10 on gold. Quarter levels (25 and 75 pips) can be turne
FREE

This is the test product. Please, DO NOT BUY IT! This is the test product. Please, DO NOT BUY IT! This is the test product. Please, DO NOT BUY IT! This is the test product. Please, DO NOT BUY IT! This is the test product. Please, DO NOT BUY IT! This is the test product. Please, DO NOT BUY IT! This is the test product. Please, DO NOT BUY IT! This is the test product. Please, DO NOT BUY IT!
MetaTraderマーケットは、他に類のない自動売買ロボットやテクニカル指標の販売場所です。
MQL5.community ユーザーメモを読んで、取引シグナルのコピー、フリーランサーによるカスタムアプリの開発、支払いシステムを経由した自動支払い、MQL5Cloud Networkなど、当社がトレーダーに対して提供するユニークなサービスについて詳しくご覧ください。

取引の機会を逃しています。
- 無料取引アプリ
- 8千を超えるシグナルをコピー
- 金融ニュースで金融マーケットを探索