 MetaTrader 5
 Experts
 지표
 라이브러리
 유틸리티
 위젯
 규칙
MetaTrader 5용 기술 지표 - 232
 기술 지표의 시그널은 주식 및 외환 시장에서 거래를 개시 및 종료하는 데 중요한 역할을 합니다. 지표의 본질은 미래의 가격 변화를 예측하기 위한 금융 시그널 값의 수학적 변형입니다.
기술 지표를 테스트하여 시장 행동과 그로 인한 이익을 더 잘 예측할 수 있습니다.

Orderflow Big Trade 추정 델타 히트맵으로 캔들 내부에 숨겨진 매수·매도 압력 포착 일반 캔들 차트 내부 에서 일어나는 결정적인 거래 활동을 놓치고 계신가요? Orderflow Big Trade 는 고도화된 변동폭 및 종가 가중치 알고리즘을 사용하여 그룹화된 가격대별 매수 및 매도 압력을 추정합니다. 단순 거래량에만 의존하는 대신, 프라이스 액션 동역학을 명확한 시각적 델타 맵으로 변환하여 기관의 물량 흡수(Absorption), 모멘텀 돌파, 갇힌 트레이더(Trapped Traders), 그리고 주요 구간의 수용 및 거절을 즉각 식별할 수 있도록 돕습니다. [ 무료 데모 버전 다운로드 ] 지금 바로 실제 차트에서 모든 기능을 테스트해보세요. 구매 전 설정 변경, 시각적 명확성 확인, 본인의 매매 전략과의 적합성을 부담 없이 경험하실 수 있습니다. 트레이딩 핵심 강점 캔들 내부 델타 추정: 캔들의 고저 범위와 종가 위치를 분석하여 특정 가격 클러스터

Shows how much time is left until the current candle closes, right next to the price, plus the live spread and the broker's server time. The spread turns red when it is above your limit. Free indicator, works on every timeframe and every symbol. Many entries are made on the candle close, and a wide spread can turn a good entry into a bad one. MetaTrader 5 does not show either on the chart. This indicator adds both, in a clean way, and updates them every second. HOW IT WORKS Right of the last can
FREE

A Malaysian SnR (MSNR) indicator that draws A, V, gap and OCL levels from three timeframes, keeps track of which levels are still fresh, and reads the MSNR storyline for you. The MSNR radar watches your Market Watch and shows which symbol sits at a fresh D1 or H4 level right now. Every level and every storyline turn is confirmed on a closed candle, so the levels you see on past candles are the same levels the chart showed live. What you get All MSNR level types: A levels (resistance), V levels (

O SilverRiscoGANHO é um indicador desenvolvido para MetaTrader 5 que facilita o planejamento das operações, permitindo calcular e visualizar o Stop Gain, Stop Loss dinâmico e o risco financeiro envolvido em cada negociação. Com recursos oferecidos para diferentes ativos e mercados, o indicador oferece maior flexibilidade operacional, ajudando o trader a compreender melhor os possíveis resultados financeiros de suas operações antes da execução. Principais vantagens Stop Gain: auxilia na definiçã

Footprint LSTM is a machine-learning indicator that applies a Long Short-Term Memory (LSTM) network to sequential market data enriched with tick-derived footprint features. As a gated recurrent architecture, the LSTM maintains a persistent cell state regulated by differentiable forget, input, and output gates. This mechanism allows the network to selectively retain, update, or discard information across arbitrary time horizons, enabling it to capture complex temporal dependencies in order flow

Footprint RNN is a machine-learning system that applies a Recurrent Neural Network to sequential market data enriched with tick-derived footprint features. As a recurrent model, the RNN processes observations in chronological order and maintains a hidden representation that is updated at each time step. This allows the model to capture temporal structure in order flow, liquidity behavior, and market microstructure from historical sequences. The indicator combines configurable training workflows

Market Trend & Breakout Filter with Push Alerts is a powerful and advanced MetaTrader 5 (MT5) indicator designed to identify true market trends and high-probability breakout opportunities while effectively filtering out market noise and false signals. Unlike standard indicators that constantly fluctuate between neutral and ranging states, this tool utilizes a strict Trend Latch Logic . Once a trend (Uptrend or Downtrend) is established, it remains locked until all strict criteria for a full tre

Footprint MLP transforms tick-level market activity into footprint features and uses a multilayer perceptron machine learning model to learn nonlinear relationships between order flow and future price behavior. It captures temporal context through lagged inputs, rolling statistics, multi-timeframe features, and paired-symbol data, with configurable training, chronological validation, and feature selection.
Three Learning Modes
Base Learn trains a model using the configured parameters; training

Footprint GBDT is a machine-learning system that applies Gradient-Boosted Decision Trees to market data represented through tick-derived footprint features. Lagged observations, rolling statistics, and multi-timeframe inputs provide temporal context, while configurable training, chronological validation, feature selection, and paired-symbol data support model development and evaluation.
Three Learning Modes
Base Learn trains a model using the configured parameters; training runs across multi

OVERVIEW
The market structure indicator helps traders easily read market trends, this indicator shows trend continuity and trend reversals, this tool will be very useful for beginners who are just getting to know market structure, the indicator will provide visualization of the patterns that occur
Key Features: BOS pattern The indicator will provide an overview of the Break Of Structure pattern, where the pattern will indicate the continuation of the trend. CHOCH Pattern The indicator will pr

God's Eye God's Eye is an institutional-grade volatility, market structure, and algorithmic liquidity engine built specifically for MetaTrader 5. Unlike typical lagging retail indicators that rely on basic smoothing formulas (like EMAs or Bollinger Bands), God's Eye scans raw historical price action structures across multiple timeframes simultaneously. It maps out institutional liquidity pools, equal high/low stop-loss clusters, and asset-adaptive volatility exhaustion levels with zero lag. Whe

Market Scanner Board shows the trend of many symbols on four timeframes in one clear table, so you see in seconds where the market is moving and where it is quiet. What you see for every symbol Price and day change in % Trend on M15, H1, H4 and D1: UP, DOWN or FLAT (price and fast EMA above or below the slow EMA) Trend bar: how many timeframes agree RSI on H1 (overbought and oversold values are coloured) RANGE: today's range in % of the average daily range (ATR D1). Values above 100 % are highli

Bressert Cycle Signals Like the logic of this tool?
All author's products: https://www.mql5.com/ru/users/musa1994/seller
Trading philosophy: https://developer-mql4-mql5.netlify.app/ Bressert Cycle Signals (BCS) is a professional cyclical indicator for MT5, adapting Walter Bressert's methodology. It combines oscillator phase analysis with precise "Setup & Trigger" entry mechanics, displaying signals directly on candlesticks. What the indicator shows Bressert Oscillator (subwindow):

Weis Wave by Mudasser turns raw tick or real volume into clear up and down waves — so you can read effort vs. result at a glance.
Instead of looking at single-bar volume, this indicator stacks volume for as long as price keeps moving in the same direction. When the close flips, a new wave begins. The result is a clean histogram of blue (bullish) and red (bearish) volume waves that make climax, effort, and absorption easy to spot.
WHAT YOU GET • Cumulative volume waves based on close direction

MT5용 CCI 지표 (알림 기능 포함, 리페인트 없음) - 가장 인기 있고 신뢰할 수 있는 트레이딩 오실레이터 중 하나입니다. - PC 및 모바일 알림 기능 내장: 과매수/과매도 구간 진입 및 이탈 시(사용자 설정 레벨 기준) 알림이 발생합니다. - 작동 원리: 현재 가격과 과거 평균 가격 간의 차이를 측정합니다. 주요 레벨: +/-200, +/-100. - 트레이딩 전략: 과매도 구간에서 벗어날 때 매수(Buy) 신호를, 과매수 구간에서 벗어날 때 매도(Sell) 신호를 포착하는 데 매우 유용합니다. - 주요 레벨: +/-200, +/-100. - 모든 시간 프레임에서 원활하게 작동하며, 추세 시장에서 '프라이스 액션(Price Action)'과 결합하여 사용하면 매우 효과적입니다. Click here to see high quality Trading Robots and Indicators! 본 제품은 MQL5 웹사이트에서만 독점적으로 제공되는 오리지널 상품입니다.

MID Regime Filter – Adaptive Market Regime Filter ( protection, adaptive filtering, and the 4 market regimes ) Overview The MID Regime Filter is not a classic entry signal indicator. It is a powerful, adaptive market context filter designed specifically for algorithmic traders and Expert Advisor (EA) developers. It analyzes real-time market volatility and directionality to classify the current environment into one of 4 distinct market regimes . This allows your EA to dynamically enable, disab

JC OB Strategy turns your MetaTrader 5 chart into a complete Order Block engine: it finds institutional demand and supply zones, and the moment an Order Block is confirmed it opens a trade plan with ENTRY, STOP LOSS and three take-profit targets on the chart. WHAT IT DOES - Order Block detection (SMC/ICT engine): a bullish OB is a bearish candle followed by a strong bullish confirmation candle that closes above its high; a bearish OB is the mirror image below the low. Optional classic swing-base

Professional Fibonacci tool for MT5 featuring true opacity background zones, smart color gradients, and custom ATAS-style price labels. Detailed Description: Are you tired of the default, rigid Fibonacci tool in MT5 that clutters your charts and hides price action? Color Fibo Pro completely upgrades your charting experience by bringing the modern, clean, and highly customizable visual style of premium order flow platforms (like TradingView or ATAS) directly to your MetaTrader 5. Designed by a pr

Charts247 Price Value Bands MT5 Is price cheap, fair or stretched right now? Fair value with value bands measured from how far price really travels, the share of closes beyond each band, return arrows, a two-close T3 line, confirmed peaks and the M5 Fibonacci. Nothing repaints. Every market swings around a fair value. Most of the time it stays close; now and then it stretches far away, and from there it usually comes back. Charts247 Price Value Bands shows how far is far for the symbol and time

Formex는 일일 평균 변동폭(ADR)을 중심으로 구축된 다중 구성 요소 시장 분석 지표로, 변동폭 분석, 시장 구조, 통화 강도 및 추세 평가를 하나의 통합 도구로 결합합니다. 포멕스는 본질적으로 과거 ADR 측정값을 사용하여 일일 시가 주변의 동적 가격 수준을 계산하고 표시합니다. 이러한 수준은 시장의 평균 변동 범위, 현재 가격 상승세, 잠재적 반응 영역 및 예상 목표 가격을 구조화된 시각으로 보여줍니다. ADR 분석에는 자동 돌파 감지, 돌파 수준 시각적 식별, 그리고 선택적으로 ATR 기반 돌파 영역이 포함됩니다. 또한 전날 ADR 반응을 활용하여 당일 거래일의 관련 수준을 강조 표시할 수 있습니다. Formex는 ADR 외에도 다음과 같은 추가적인 시장 분석 요소를 포함합니다.
ADR 매트릭스 및 심볼 분석 통합 심볼 패널은 마켓 워치에서 바로 여러 금융 상품의 개요를 제공합니다. 심볼은 ADR 측정값 또는 ADR 수준과의 가격 근접도에 따라 정렬할 수 있습니다. 패널
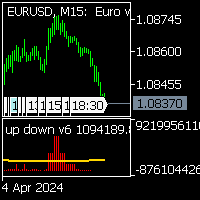
up down v6 for mt5 is no repaint all timeframe and all pairs indicator. red histogram cros trigger that is up point,and put a red point on histogram. and blue histogram cros trigger that is deep point.and put blue point on histogram. this indicator need to sometimes zoom out .for thise pres + button. if newly comes signal is too high makes before invisible.red and blue points are there.to see the signals. indicator is no repaint and can use all time frame and all pairs. only need minimum 500 bar
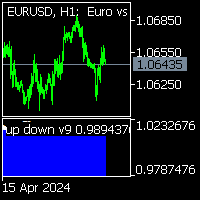
indicator is no repaint trend indicator.for mt5 when white stars up to Red histogram that is probably end of long trades. when White stars up to Blue histogram that is probably end of down trades. indicator can use all pairs and lower than weekly charts, to use weekly chart need to at least 500 bars data on back.and lowering processing value 500. it is also suitable for 1m charts. indicator hold long way to go. there is not too many signals.
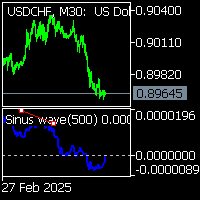
Sinus wave indicator is a extra ordinary oscillator.to find divergency.for mt5 it works all pairs and all timeframes. suitable for experienced and beginner traders.. indicator works on toward of the prices... while sinus wave go up side that means prices will up. and while sinus wave go down that means prices is going down. it gives divegency when trend reversals. there is wave to set default 500. on pictures divergency lines and letters has been drawn by hand.to explain how it works.

AlgoTrade Correlation Matrix shows how the symbols of your list move together, as a colored matrix on a card, with the symbols that move most with and most against the chart symbol. It reads data only. What it does Up to 10 symbols from a comma separated list (by default EURUSD, GBPUSD, USDJPY, AUDUSD, USDCAD, USDCHF, NZDUSD, XAUUSD). The chart symbol is added when it is not in the list. Finds each symbol at your broker, with the chart symbol's prefix and suffix (for example EURUSD.pc). Tabs for
FREE

Smart Money OrderBlocks Pro는 외환, 골드(XAUUSD), 지수 및 암호화폐 시장에서 기관 유동성과 스마트 머니 컨셉(SMC)을 분석하는 무리페인팅(Non-Repainting) 보조지표입니다.
주요 기능: • 리페인팅 없는 기관 오더블록(Order Blocks): ATR 변곡 필터를 통해 미완화(Unmitigated) 매수/매도 오더블록 구간을 자동으로 작도합니다. • BOS 및 CHoCH 시장 구조: 캔들 종가 마감 확정 시 구조 돌파(BOS)와 추세 전환(CHoCH)을 정확히 표시합니다. • 공정가치갭(FVG / Imbalance): 3캔들 유동성 불균형 구간을 자동으로 강조합니다. • 다중 시간대(MTF) 대시보드: M15, H1, H4, D1 추세 방향과 활성 오더블록 개수를 실시간으로 표시합니다. • 실시간 알림 및 모바일 푸시 알림: 새로운 오더블록 생성 시 또는 가격이 활성 오더블록 영역에 진입할 때 즉시 알림을 전송합니다.
입력 파라미터 (I
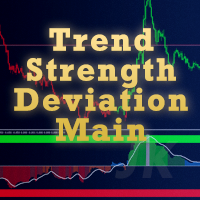
TrendStrengthDeviationMain TrendStrengthDeviationMain is a visual indicator package for MetaTrader 5. It summarizes recent price movement into a trend strength reading between -1 and +1, together with a confirmed trend state. The package contains two indicators that can be used together or on their own: a main-chart candle coloring indicator and a separate-window oscillator. It is an indicator only and does not open, manage or close orders. What is included The main-chart indicator colors each
FREE
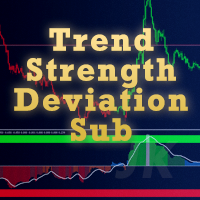
TrendStrengthDeviationSub TrendStrengthDeviationSub is a visual indicator package for MetaTrader 5. It summarizes recent price movement into a trend strength reading between -1 and +1, together with a confirmed trend state. The package contains two indicators that can be used together or on their own: a main-chart candle coloring indicator and a separate-window oscillator. It is an indicator only and does not open, manage or close orders. What is included The main-chart indicator colors each can
FREE

MNFM Risk Monitor MT5 A free, read-only account exposure dashboard for MetaTrader 5. View open positions by symbol, directional lots, floating results and account health in one compact panel. The indicator does not open, modify or close orders and does not enforce risk limits. One clear view of your open exposure Open symbols with buy, sell or combined direction, position count, buy lots and sell lots. P/L + swap, Lots % and P/L % for each symbol, plus totals across all filtered pages. Balance,
FREE

VERO GREZZO| Suite per volumi istituzionali e blocchi di ordini REAL RAW è un indicatore di trading professionale all'avanguardia e ultra-preciso, progettato per i trader d'élite che esigono assoluta trasparenza dal mercato. Realizzato senza smoothing artificiale o filtri matematici ritardati, questo strumento opera al 100% su dati istituzionali grezzi per rivelare le reali tracce del capitale investito, i principali pool di liquidità e le zone di accumulo ad alto volume in cui viene impi

Full description PhuongJ-SessionVWAP is a standalone MetaTrader 5 indicator that turns the session-VWAP and session-volume-profile overlay of the FVG_AutoBot into a reusable tool. It tracks the four reference sessions used by the bot — Sydney, Asia, London and New York — on the Vietnam clock (UTC+7) and follows the DST rules of Sydney, London and New York automatically. For every session the indicator draws a cumulative VWAP line in the session colour and, when enabled, a volume profile built fr
FREE

ShortSRLevels ShortSRLevels is a chart indicator for MetaTrader 5. It draws a compact map of price levels that have not yet been reached by price, together with a limited number of levels that were reached recently. It can also show the high and low of the previous completed day and the high and low of the previous completed week. The indicator does not open, close or manage positions. It does not place orders. It is a visual tool for chart analysis. Levels on the chart Each level is drawn as a
FREE

This is the test product. Please, DO NOT BUY IT! This is the test product. Please, DO NOT BUY IT! This is the test product. Please, DO NOT BUY IT! This is the test product. Please, DO NOT BUY IT! This is the test product. Please, DO NOT BUY IT! This is the test product. Please, DO NOT BUY IT! This is the test product. Please, DO NOT BUY IT! This is the test product. Please, DO NOT BUY IT!
MetaTrader 마켓은 거래 로봇과 기술 지표들의 독특한 스토어입니다.
MQL5.community 사용자 메모를 읽어보셔서 트레이더들에게 제공하는 고유한 서비스(거래 시그널 복사, 프리랜서가 개발한 맞춤형 애플리케이션, 결제 시스템 및 MQL5 클라우드 네트워크를 통한 자동 결제)에 대해 자세히 알아보십시오.
