 MetaTrader 5
 专家
 指标
 程序库
 实用工具
 窗口小部件
 规则
适用于MetaTrader 5的技术指标 - 232
 技术指标的信号外汇和股票市场的开仓交易和平仓交易起着至关重要的作用。指标的本质就是一种交易品种的数学转换,旨在预测未来的价格变化。
测试技术指标可以更有利于预测市场行为并从中获利。

Orderflow Big Trade 透過估算 Delta 熱力圖,揭示 K 線內部的隱藏壓力 您是否錯過了隱藏在標準 K 線 內部 的關鍵交易活動? Orderflow Big Trade 採用先進的高低價位與收盤價加權算法, 估算不同聚合分組價位上的買賣壓力。 它不單單依賴原始成交量, 而是將價格行為動態轉化為清晰直觀的 Delta 熱力圖——幫助您即時識別機構吸收、 突破動能、 被套牢的交易者以及關鍵價位的接受與拒絕。 [ 免費下載 Demo 試用版 ] 立即在您的實時圖表上測試完整功能。在決定購買之前,您可以自由調整參數、評估視覺清晰度,並體驗它如何完美融入您的交易策略中。 核心交易優勢 棒內 Delta 估算: 解析 K 線的高低價範圍與收盤位置, 推算特定價格聚類區間的買壓與賣壓。 收盤價加權技術: 智能提高靠近 K 線收盤價區域的 Delta 權重, 更準確地反映 K 線尾聲的市場控制力。 動能與吸收偵測: 快速判斷激進的市價單是在推動價格突破, 還是撞上了機構的被動掛單流(吸收)。 動態氣泡視覺化: 透過自訂顏色(藍色代表買

在价格旁边直接显示当前 K 线还剩多少时间收盘,同时显示实时点差和经纪商服务器时间。点差超过您设定的上限时会变成红色。 免费指标,适用于任何周期和任何品种。 很多入场都是在 K 线收盘时进行的,而过宽的点差可能把一次好的入场变成坏的入场。MetaTrader 5 在图表上不显示这两项信息。这个指标以简洁的方式把两者都加上,并每秒更新一次。 工作原理 在最后一根 K 线右侧,有一小段文字随价格移动:剩余时间和点差,例如 "<- 04:02 0.8 pips"。 在图表角落,一个方框显示 "M5 candle closes in: 04:02"、点差和服务器时间。 倒计时由每秒一次的定时器驱动,即使没有新报价也会继续走动。 当点差超过您的上限(默认 2 点)时,会变成红色,方框中显示 "(high)"。 当市场休市、没有新 K 线开始时,倒计时显示 "closed",而不是错误的数字。 功能 任何周期的 K 线倒计时 :短周期显示 分:秒,H1 和 H4 显示 时:分:秒,D1 及以上显示天数 实时点差 :外汇(3 位和 5 位报价品种)以点(pips)显示,黄金、指数和加密货币以点数(p
FREE

A Malaysian SnR (MSNR) indicator that draws A, V, gap and OCL levels from three timeframes, keeps track of which levels are still fresh, and reads the MSNR storyline for you. The MSNR radar watches your Market Watch and shows which symbol sits at a fresh D1 or H4 level right now. Every level and every storyline turn is confirmed on a closed candle, so the levels you see on past candles are the same levels the chart showed live. What you get All MSNR level types: A levels (resistance), V levels (

O SilverRiscoGANHO é um indicador desenvolvido para MetaTrader 5 que facilita o planejamento das operações, permitindo calcular e visualizar o Stop Gain, Stop Loss dinâmico e o risco financeiro envolvido em cada negociação. Com recursos oferecidos para diferentes ativos e mercados, o indicador oferece maior flexibilidade operacional, ajudando o trader a compreender melhor os possíveis resultados financeiros de suas operações antes da execução. Principais vantagens Stop Gain: auxilia na definiçã

Footprint LSTM is a machine-learning indicator that applies a Long Short-Term Memory (LSTM) network to sequential market data enriched with tick-derived footprint features. As a gated recurrent architecture, the LSTM maintains a persistent cell state regulated by differentiable forget, input, and output gates. This mechanism allows the network to selectively retain, update, or discard information across arbitrary time horizons, enabling it to capture complex temporal dependencies in order flow

Footprint RNN is a machine-learning system that applies a Recurrent Neural Network to sequential market data enriched with tick-derived footprint features. As a recurrent model, the RNN processes observations in chronological order and maintains a hidden representation that is updated at each time step. This allows the model to capture temporal structure in order flow, liquidity behavior, and market microstructure from historical sequences. The indicator combines configurable training workflows

Market Trend & Breakout Filter with Push Alerts is a powerful and advanced MetaTrader 5 (MT5) indicator designed to identify true market trends and high-probability breakout opportunities while effectively filtering out market noise and false signals. Unlike standard indicators that constantly fluctuate between neutral and ranging states, this tool utilizes a strict Trend Latch Logic . Once a trend (Uptrend or Downtrend) is established, it remains locked until all strict criteria for a full tre

Footprint MLP transforms tick-level market activity into footprint features and uses a multilayer perceptron machine learning model to learn nonlinear relationships between order flow and future price behavior. It captures temporal context through lagged inputs, rolling statistics, multi-timeframe features, and paired-symbol data, with configurable training, chronological validation, and feature selection.
Three Learning Modes
Base Learn trains a model using the configured parameters; training

Footprint GBDT is a machine-learning system that applies Gradient-Boosted Decision Trees to market data represented through tick-derived footprint features. Lagged observations, rolling statistics, and multi-timeframe inputs provide temporal context, while configurable training, chronological validation, feature selection, and paired-symbol data support model development and evaluation.
Three Learning Modes
Base Learn trains a model using the configured parameters; training runs across multi

OVERVIEW
The market structure indicator helps traders easily read market trends, this indicator shows trend continuity and trend reversals, this tool will be very useful for beginners who are just getting to know market structure, the indicator will provide visualization of the patterns that occur
Key Features: BOS pattern The indicator will provide an overview of the Break Of Structure pattern, where the pattern will indicate the continuation of the trend. CHOCH Pattern The indicator will pr

God’s Eye God’s Eye is a chart-based market-structure and range-planning indicator for MetaTrader 5. It combines daily volatility context with price structure on the active chart timeframe. It is designed to support discretionary analysis and provide data buffers for Expert Advisors; it does not place trades or guarantee trade outcomes.
Daily Range Dashboard God’s Eye calculates an average daily high-low range from completed D1 bars and compares it with price movement from the current daily ope

Market Scanner Board shows the trend of many symbols on four timeframes in one clear table, so you see in seconds where the market is moving and where it is quiet. What you see for every symbol Price and day change in % Trend on M15, H1, H4 and D1: UP, DOWN or FLAT (price and fast EMA above or below the slow EMA) Trend bar: how many timeframes agree RSI on H1 (overbought and oversold values are coloured) RANGE: today's range in % of the average daily range (ATR D1). Values above 100 % are highli

Bressert Cycle Signals Like the logic of this tool?
All author's products: https://www.mql5.com/ru/users/musa1994/seller
Trading philosophy: https://developer-mql4-mql5.netlify.app/ Bressert Cycle Signals (BCS) is a professional cyclical indicator for MT5, adapting Walter Bressert's methodology. It combines oscillator phase analysis with precise "Setup & Trigger" entry mechanics, displaying signals directly on candlesticks. What the indicator shows Bressert Oscillator (subwindow):

Weis Wave by Mudasser turns raw tick or real volume into clear up and down waves — so you can read effort vs. result at a glance.
Instead of looking at single-bar volume, this indicator stacks volume for as long as price keeps moving in the same direction. When the close flips, a new wave begins. The result is a clean histogram of blue (bullish) and red (bearish) volume waves that make climax, effort, and absorption easy to spot.
WHAT YOU GET • Cumulative volume waves based on close direction

适用于 MT5 的 CCI 指标(带提醒功能,无信号重绘) - 最受欢迎且可靠的交易震荡指标之一。 - 内置电脑端及移动端提醒功能:当价格进入或离开超买/超卖区域(基于自定义阈值)时,系统会自动触发提醒。 - 工作原理:衡量当前价格与其历史平均值之间的偏离程度。关键水平:+/-200、+/-100。 - 交易策略:非常适合捕捉交易信号——当价格离开超买区时产生卖出信号,离开超卖区时产生买入信号。 - 关键水平:+/-200、+/-100。 - 适用于任何时间周期;在趋势行情中,与“价格行为”(Price Action)分析结合使用效果极佳。 Click here to see high quality Trading Robots and Indicators! 本产品为原创产品,仅在 MQL5 网站独家提供。!!!!!

MID Regime Filter – Adaptive Market Regime Filter ( protection, adaptive filtering, and the 4 market regimes ) Overview The MID Regime Filter is not a classic entry signal indicator. It is a powerful, adaptive market context filter designed specifically for algorithmic traders and Expert Advisor (EA) developers. It analyzes real-time market volatility and directionality to classify the current environment into one of 4 distinct market regimes . This allows your EA to dynamically enable, disab

JC OB Strategy turns your MetaTrader 5 chart into a complete Order Block engine: it finds institutional demand and supply zones, and the moment an Order Block is confirmed it opens a trade plan with ENTRY, STOP LOSS and three take-profit targets on the chart. WHAT IT DOES - Order Block detection (SMC/ICT engine): a bullish OB is a bearish candle followed by a strong bullish confirmation candle that closes above its high; a bearish OB is the mirror image below the low. Optional classic swing-base

Professional Fibonacci tool for MT5 featuring true opacity background zones, smart color gradients, and custom ATAS-style price labels. Detailed Description: Are you tired of the default, rigid Fibonacci tool in MT5 that clutters your charts and hides price action? Color Fibo Pro completely upgrades your charting experience by bringing the modern, clean, and highly customizable visual style of premium order flow platforms (like TradingView or ATAS) directly to your MetaTrader 5. Designed by a pr

Charts247 Price Value Bands MT5 Is price cheap, fair or stretched right now? Fair value with value bands measured from how far price really travels, the share of closes beyond each band, return arrows, a two-close T3 line, confirmed peaks and the M5 Fibonacci. Nothing repaints. Every market swings around a fair value. Most of the time it stays close; now and then it stretches far away, and from there it usually comes back. Charts247 Price Value Bands shows how far is far for the symbol and time

MNFM Trade Reports New in version 1.10 Current page and total pages are shown between the navigation arrows. Opening a symbol, magic or comment filter refreshes account data. Filter headings show the active open/closed scope and available value count. Available symbols come from open trades and loaded closed history, subject to the active filters. New in version 1.08 A fixed TOTAL row sums all filtered trades across every page: trade count, lots, realized net, floating net, commission/fees, swap
FREE
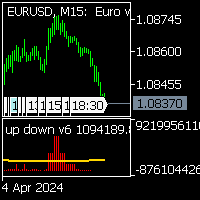
up down v6 for mt5 is no repaint all timeframe and all pairs indicator. red histogram cros trigger that is up point,and put a red point on histogram. and blue histogram cros trigger that is deep point.and put blue point on histogram. this indicator need to sometimes zoom out .for thise pres + button. if newly comes signal is too high makes before invisible.red and blue points are there.to see the signals. indicator is no repaint and can use all time frame and all pairs. only need minimum 500 bar
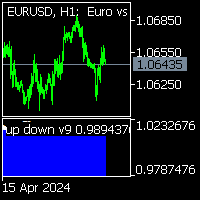
indicator is no repaint trend indicator.for mt5 when white stars up to Red histogram that is probably end of long trades. when White stars up to Blue histogram that is probably end of down trades. indicator can use all pairs and lower than weekly charts, to use weekly chart need to at least 500 bars data on back.and lowering processing value 500. it is also suitable for 1m charts. indicator hold long way to go. there is not too many signals.
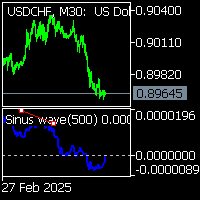
Sinus wave indicator is a extra ordinary oscillator.to find divergency.for mt5 it works all pairs and all timeframes. suitable for experienced and beginner traders.. indicator works on toward of the prices... while sinus wave go up side that means prices will up. and while sinus wave go down that means prices is going down. it gives divegency when trend reversals. there is wave to set default 500. on pictures divergency lines and letters has been drawn by hand.to explain how it works.

AlgoTrade Correlation Matrix shows how the symbols of your list move together, as a colored matrix on a card, with the symbols that move most with and most against the chart symbol. It reads data only. What it does Up to 10 symbols from a comma separated list (by default EURUSD, GBPUSD, USDJPY, AUDUSD, USDCAD, USDCHF, NZDUSD, XAUUSD). The chart symbol is added when it is not in the list. Finds each symbol at your broker, with the chart symbol's prefix and suffix (for example EURUSD.pc). Tabs for
FREE

Smart Money OrderBlocks Pro 是一款专为外汇、黄金 (XAUUSD)、股指与加密货币交易者打造的机构订单流与聪明钱概念 (SMC) 指标。
核心功能: • 无重绘机构订单块 (Order Blocks):基于 ATR 机构位移脉冲自动识别看涨(需求区)与看跌(供给区)订单块,并在价格回踩缓解(Mitigated)后自动清除。 • BOS 与 CHoCH 市场结构:严格在 K 线收盘确认后标记结构突破 (BOS) 与趋势特性改变 (CHoCH),绝不重绘。 • 公允价值缺口 (FVG / Imbalances):自动绘制三根 K 线构成的机构流动性失衡区。 • 多周期 (MTF) 仪表盘:在图表左上角实时显示 M15、H1、H4 与 D1 趋势方向及当前未缓解订单块数量。 • 实时弹窗与手机 Push 推送通知:当形成新订单块或价格触及活跃订单块区域时立即提醒。
输入参数说明 (INPUT PARAMETERS): • InpSwingPeriod:波段结构高/低点周期 K 线数(默认:5)。 • InpHistoryBars:加载图表时扫描的历史 K 线
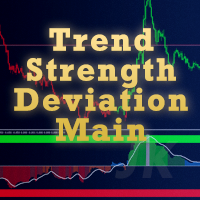
TrendStrengthDeviationMain TrendStrengthDeviationMain 是一套用于 MetaTrader 5 的可视化指标,把近期的价格变化整理为一个介于 -1 与 +1 之间的趋势强度读数,并给出经过确认的趋势状态。产品包含两个指标,可以一起使用,也可以单独使用:一个用于主图K线着色,一个用于独立副图窗口。本产品是指标,不会开仓、管理或平仓。 产品内容 主图指标按当前趋势状态为每根K线着色,多头状态和空头状态各使用一种由使用者设定的颜色。状态切换前需要经过一个确认水平,因此当读数接近零时,颜色不会频繁来回变化。 副图指标以彩色柱状图显示趋势强度读数。读数为正表示买方方向占优,为负表示卖方方向占优,绝对值反映占优程度。柱状图颜色随读数强度分档变化。可选显示的内容包括一条平滑参考线、零线、正负两侧的强势水平与极端水平,以及这两条水平线之间的着色区域。数据窗口中还提供若干辅助读数,便于人工核对。 趋势状态发生变化时,可以按设置在终端弹出提示,提示中包含当前品种与周期。 使用方法 在 MetaTrader 5 中安装产品后,把任意一个指标加载到图表即可;也
FREE
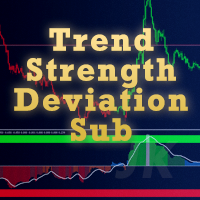
TrendStrengthDeviationSub
TrendStrengthDeviationSub 是一套用于 MetaTrader 5 的可视化指标,把近期的价格变化整理为一个介于 -1 与 +1 之间的趋势强度读数,并给出经过确认的趋势状态。产品包含两个指标,可以一起使用,也可以单独使用:一个用于主图K线着色,一个用于独立副图窗口。本产品是指标,不会开仓、管理或平仓。 产品内容 主图指标按当前趋势状态为每根K线着色,多头状态和空头状态各使用一种由使用者设定的颜色。状态切换前需要经过一个确认水平,因此当读数接近零时,颜色不会频繁来回变化。 副图指标以彩色柱状图显示趋势强度读数。读数为正表示买方方向占优,为负表示卖方方向占优,绝对值反映占优程度。柱状图颜色随读数强度分档变化。可选显示的内容包括一条平滑参考线、零线、正负两侧的强势水平与极端水平,以及这两条水平线之间的着色区域。数据窗口中还提供若干辅助读数,便于人工核对。 趋势状态发生变化时,可以按设置在终端弹出提示,提示中包含当前品种与周期。 使用方法 在 MetaTrader 5 中安装产品后,把任意一个指标加载到图表即可;也可以
FREE

MNFM Risk Monitor MT5 A free, read-only account exposure dashboard for MetaTrader 5. View open positions by symbol, directional lots, floating results and account health in one compact panel. The indicator does not open, modify or close orders and does not enforce risk limits. One clear view of your open exposure Open symbols with buy, sell or combined direction, position count, buy lots and sell lots. P/L + swap, Lots % and P/L % for each symbol, plus totals across all filtered pages. Balance,
FREE

VERO GREZZO| Suite per volumi istituzionali e blocchi di ordini REAL RAW è un indicatore di trading professionale all'avanguardia e ultra-preciso, progettato per i trader d'élite che esigono assoluta trasparenza dal mercato. Realizzato senza smoothing artificiale o filtri matematici ritardati, questo strumento opera al 100% su dati istituzionali grezzi per rivelare le reali tracce del capitale investito, i principali pool di liquidità e le zone di accumulo ad alto volume in cui viene impi

Full description PhuongJ-SessionVWAP is a standalone MetaTrader 5 indicator that turns the session-VWAP and session-volume-profile overlay of the FVG_AutoBot into a reusable tool. It tracks the four reference sessions used by the bot — Sydney, Asia, London and New York — on the Vietnam clock (UTC+7) and follows the DST rules of Sydney, London and New York automatically. For every session the indicator draws a cumulative VWAP line in the session colour and, when enabled, a volume profile built fr
FREE

ShortSRLevels ShortSRLevels 是一款用于 MetaTrader 5 的图表指标。它在图表上绘制一组尚未被价格触及的参考价位,同时可显示少量最近已被触及的价位,也可显示上一完整交易日和上一完整交易周的高低参考位。 本指标不开仓、不平仓、不管理持仓,也不发送订单,仅用于图表分析。 图表上显示的内容 每个价位以一条水平线表示。线从该价位开始可用的图表K线处起,向右延伸,并略微超出最后一根K线。价位绘制后保持其原始价格不变。当价格首次到达或越过该价位时,线在该K线处停止,该价位转入已触及组,并以更细的线和更浅的颜色绘制。 可选细轨会在每个价位周围添加一条窄带。可选星形标记用于标示参考极值出现的K线。每条线右端的小刻痕便于在图表内容较多时阅读。颜色根据图表背景自动选择,因此在浅色和深色主题下都保持可读。将鼠标停在线上可查看提示,其中包含价格、来源时间、可用时间和当前状态。所有时间均按服务器时间显示。 数据窗口中提供两个计数,分别表示当前K线上未触及的上方价位数量和未触及的下方价位数量。 日线与周线参考位以单独的一组线绘制,并在新的一天或新的一周完成后替换。 提醒选项
FREE

GOAT Currency Strength shows which of the 8 major currencies (USD, EUR, GBP, JPY, CHF, CAD, AUD, NZD) are really driving the market right now, so you trade the strongest against the weakest instead of guessing. How it works
For each of the 28 major pairs the indicator measures the rate of change over a chosen period on a chosen timeframe. The change is credited to the base currency and debited from the quote currency. Each currency's score is the average over all its pairs, mapped to a 0–100 sc
FREE

The Liquidity Sweep Filter is an institutional-grade Smart Money Concepts (SMC) & Order Flow indicator designed for MetaTrader 5. It tracks market trend direction using adaptive smoothed deviation bands while dynamically mapping resting stop-loss liquidity (Swing Highs and Swing Lows). When price hunts and absorbs these liquidity pools, the indicator flags the event with on-chart Sweep Dots , measures the absorbed volume via Volume Badges , and displays an anchored Volume Profile for the current

Triple Body ZigZag MTF Triple Body ZigZag MTF is a multi-timeframe ZigZag indicator for MetaTrader 5. It displays up to three independently configurable ZigZag lines on a single price chart. Unlike a conventional ZigZag based on candle highs and lows, this indicator calculates swing points using candle bodies: Body High = max(Open, Close) Body Low = min(Open, Close) Main Features Up to three independent ZigZag lines displayed simultaneously. Individual timeframe selection for each ZigZag. Two al
FREE

看清平静的市场何时苏醒。Market Thermometer 带有苏醒提醒和五种均线。不重绘。
任何品种,任何周期。2 分钟即可加载到图表。可在策略测试器中免费测试。
Get more indicators here
Baselines, volatility filters and oscillators. No repaint.
为什么需要它 您开了一单,价格几乎不动,信号在沉睡的市场中逐渐失效。市场没有足够的能量去配合您的信号。平静的市场会消耗您的时间和点差。 您将获得 Fabii Elder Market Thermometer 显示市场是在沉睡还是已经苏醒,让您在波动范围扩大时再交易。 一个柱状图显示四种状态:沉睡(白色)、平静(红色)、活跃(绿色)、爆发(青柠色),让您一眼读懂市场。绿色和红色不代表价格方向。 苏醒、爆发、沉睡以及上穿均线的提醒,支持弹窗、声音或推送,让您不必盯着图表。 五种均线:指数 (EMA)、简单 (SMA)、威尔德 (RMA)、加权 (WMA) 或 Ocean 自然 (NMA) 均线,让您调整反应速度。 为您的 Expert Advisor 提
FREE

Impuls Model: draw the pattern, see what the market did next Most traders say “I’ve seen this setup before.” Impuls Model checks whether that is true. Draw the move you have in mind straight on the chart: a chain of connected trend lines, up, down, up, up, as many legs as you need. Press START. The indicator goes through your chosen history and finds every place where price formed a similar shape, whatever its size. A small move on M15 and a big swing on H4 are treated as the same pattern. What

Higher-Timeframe Candle Levels. Clearer Market Context. Ashinton Candle Levels Pro is a multi-timeframe chart indicator designed to help traders identify and monitor the high and low prices of previously closed candles from a selected reference timeframe. Whether you're analysing the daily range while trading on the 15-minute chart or monitoring weekly levels while working on lower timeframes, the indicator keeps important higher-timeframe price levels visible directly on your chart. Instead of

VELTIS Stress Scope
StressScope is a risk panel for MetaTrader 5. It looks at all of your open trades together and shows how much they could lose as one package over the time you usually keep trades open. It replays your exact positions over past market periods, shows which trade causes most of the risk, whether your trades are really spread out or are one bet, and whether a bad period could break the daily or overall loss limit of your account. The indicator does not open, close or change trade
FREE

WZY 鲸落结构线(MetaTrader 5)
让主图更清楚,让结构更有价值。
WZY 鲸落结构线是一款为主图看盘设计的视觉化结构工具。它把重要的支撑与阻力背景整理到价格图表上,减少手动画线和反复清理标记,让你在行情快速变化时依然保持清晰视野。
当市场节奏加快,注意力就变得更加宝贵。WZY 会把当前值得关注的结构保留在视线里:较新的区域使用更醒目的渐变色,已经形成的区域保留为历史背景,整张图仍然保持干净、有层次、容易阅读。
你会获得
- 更清晰的主图工作区:价格、K 线和结构保持在同一张图里。 - 更快的行情背景:不用在拥挤的图表中反复寻找市场曾经反应过的位置。 - 清楚的优先级:较新的有效区域更醒目,较早的区域作为背景参考。 - 适合个人习惯的视觉呈现:可以使用内置配色,也可以调整成自己的看盘风格。 - 能融入多种分析流程:适合配合价格行为、波段分析、突破规划、趋势观察和多周期研究。 - 更少的手工维护:把时间留给行情判断,减少反复画线和整理标记。
适合这样的交易者
- 喜欢用主图观察结构,不想依赖堆满窗口的信号面板; - 希望在活跃交易时段持续保留支撑和阻力背景;

GOAT Gold Sniper trades one clear idea on XAUUSD: the New York opening range , taken only in the direction of the higher-timeframe market structure. One setup per day at most, with Entry, Stop Loss, TP1 and TP2 drawn on every signal and an honest statistics panel that tracks every past signal on your own chart. How a signal is formed (closed bars only, no repaint) Range: the high and low of the New York opening range (default 09:30 - 10:30 New York time) are marked with a box. Trend: the higher-

Synthetic Power Meter: Ваш навигатор по рынку за 1 секунду Synthetic Power Meter — это умный и компактный дашборд, который оценивает реальную силу валют и мгновенно выдает готовую торговую идею. Ключевые преимущества: Работает у ЛЮБОГО брокера: В отличие от аналогов, он не запрашивает цены кросс-курсов у терминала. Он математически синтезирует все 28 пар на основе 7 надежных мажоров. Никаких ошибок "Symbol not found", даже на демо-счетах с ограниченным набором инструментов. Наглядная сил
FREE

KJ TRENVIQ Session & Liquidity Professional Trading Sessions, Liquidity Levels & Market Structure Indicator for MetaTrader 5 Understand where liquidity is forming, how price interacts with important levels, and when market structure changes. KJ TRENVIQ Session & Liquidity is a professional MT5 indicator designed to combine trading session analysis, liquidity visualization, and market structure events in one clean chart interface. Key Features Trading Session Analysis Asian, London, and New York

Shows the session and daily levels where liquidity sits, marks when price sweeps them, and highlights fair value gaps. Non-repainting.
AurumEdge Sweep Radar draws the key reference levels many intraday traders watch, and tells you when price runs through one of them and is pushed back.
WHAT IT SHOWS - Asian session high and low, with the Asian range shaded - Previous day's high and low (PDH / PDL) - Liquidity sweeps: an arrow when a candle trades beyond one of these levels and closes back ins

Volume Price Action Matrix Volume Price Action Matrix is a technical indicator that combines Price Action, Volume Analysis, Market Structure and ATR to identify important market reactions directly on the chart. Instead of relying on volume spikes or candlestick patterns alone, the indicator evaluates how price behaves around recent highs and lows, helping traders recognize potential absorption, rejection and breakout acceptance. Key Features Volume Absorption Detection – Identifies potential bul

Labels swing highs and lows (HH, HL, LH, LL), marks breaks of structure and changes of character, and shows the higher-timeframe trend. Non-repainting.
AurumEdge Trend Compass reads market structure for you, so you can see at a glance whether the market is making higher highs and higher lows, or lower highs and lower lows.
WHAT IT SHOWS - Swing labels: HH (higher high), HL (higher low), LH (lower high), LL (lower low) - BOS (break of structure): price closes beyond the last swing in the direc

DeFoeji Quarterly Dual Cycle Quarterly Theory, your way: choose AMDX or XAMD on every level. Most Quarterly Theory tools lock you into one phase order. This indicator lets you decide. Pick AMDX (Accumulation, Manipulation, Distribution, Continuation/Reversal) or XAMD (Continuation/Reversal, Accumulation, Manipulation, Distribution) separately for the Weekly, Daily and 90-minute cycles, then let the built-in statistics show which model fits your symbol. Key features Dual-model engine: AMDX or XAM
FREE

Why Trade Like the Average Traders When You Can Snipe at 5-Minutes TF With a Powerful Sniper tool which Gives Good Returns ?
The market gives us the biggest short term but definite moves on the lower timeframes. But finding the exact moment to enter on a time frame like 5-minute chart is almost impossible—unless you know exactly where the "Big Money" is waiting.
Meet the 5 Minutes Super Sniper. A top-down analyzing tool whic

Daily, weekly and monthly pivot levels in Classic, Fibonacci, Camarilla or Woodie style, drawn before the session starts, with clear labels and prices.
AurumEdge Level Grid draws the pivot levels many traders use for support, resistance and targets. Every level is calculated from the previous period, so it is on the chart before price gets there.
WHAT IT SHOWS - Pivot (P), resistance R1 to R3 and support S1 to S3 (Camarilla adds R4 and S4) - Daily, weekly and monthly pivots, each with its own

流沙
捕捉那些停滞不前的突破,防患于未然
价格突破波段高点或低点后,会在稍稍偏离的位置停滞。当价格收盘价回到该水平线内时,流沙会用清晰的箭头标记出突破失败的点位:蓝色代表买入,红色代表卖出。
识别停滞回落的突破,忽略那些真正爆发的突破
在图表上用沙色显示“停滞区域”
仅使用已收盘的K线,因此箭头永不重绘
每次提醒都会包含入场点、止损点和止盈点
简洁的仪表盘,包含点差、K线计时器和最后信号
突破停滞时可选择性地发出提醒
弹出窗口、声音和推送提醒
工作原理
1. 水平位
Quicksand 会追踪图表上最新确认的高点和低点。
2. 突破
一根K线收盘价突破该水平位。非常大的突破K线会被忽略,因为真正的突破如果持续上涨,就不是 Quicksand 的设置。
3. 卡住
接下来的K线无法突破该水平位。它们会保持在水平位附近,Quicksand 会记录每根卡住的K线。
4. 回落 至少出现3根卡住的K线后,一根K线收盘价回到该水平位的另一侧。这就是你的信号:
向上突破失败 → 卖出
向下突破失败 → 买入
如果价格回落到足够远的距离,则说明突破是真实的,
FREE

Shades the area where a pullback is most likely to turn, before price gets there, and grades it by how many independent tools agree on that area.
AurumEdge Turning Zones finds the latest significant swing and marks its pullback zone. It then checks whether other tools point to the same area, and makes the zone brighter when they do.
WHAT IT SHOWS - The latest significant swing (a dotted line from its start to its end) and its pullback levels: 38.2%, 50%, 61.8%, 78.6% and 100% - The turning zo

Short description:
Session Volume Profile with POC, Value Area and naked POCs, low-volume (LVN) operative zones and breakout signals filtered by area. No repaint. Full description: Matteo Confluence Suite brings the core market profile tools into a single indicator: the session volume profile, the previous day’s key levels and the low-volume zones where price tends to react. On top of these it generates LONG and SHORT signals only when price is in the right area. Session Volume Profile Volume h

Marks rejection candles that form at meaningful price areas, graded A, B or C by how many areas agree. Confirmed on the candle close: never repaints.
AurumEdge Rejection Signal looks for candles with a long wick that pushed into an area and was pushed back. It only shows them when they form somewhere meaningful.
THE AREAS IT CHECKS - Daily pivot levels (P, R1 to R3, S1 to S3) - The pullback zone of the latest swing (61.8% to 78.6% by default) - The outer Bollinger Bands
THE GRADE - A: the wi

This News Dashboard will show at the chart and make you easy to predict price go.
Dashboard :
Release news Upcoming News NFP CPI PPI FOMC US VS GOLD A-F (Actual - Forecast) F-P (Forecast - Previous)
News TO Watch Today - this signal is even more interesting because it show market prediction
*There are many more parts of the next indicator. Also other indicators that help you in trading. You can get it in our store.

免费在图表上显示您真实的交易统计。Account Stats Panel 并排显示今天、本周、本月和全部时间的数据:净利润、收益率、交易次数、胜率、盈利因子、平均盈利和平均亏损。顶部还有余额、净值和持仓盈亏,每秒更新。 大多数交易者其实并不了解自己的数据。我的胜率好吗?平均亏损是否大于平均盈利?这周比这个月好吗?这个面板一眼就能回答,无需打开历史记录或表格。 显示内容 四个时段: 今天、本周(从周一开始)、本月和全部时间。 净利润: 已平仓交易,含隔夜利息和佣金。 收益率: 利润占该时段开始时余额的百分比。 交易次数 和 胜率 。 盈利因子: 总盈利除以总亏损,1.00 以上显示为绿色。 平均盈利 和 平均亏损 。 顶部显示 余额、净值和持仓盈亏 。 功能 账户的所有品种,或只统计当前图表品种。 所有交易、仅手动交易,或某一个 EA 的交易(magic number)。非常适合检查 EA 的真实表现。 可设置交易日开始的服务器小时。 盈利显示绿色,亏损显示红色,数字按列对齐。 可放在图表任意角落和位置,字号 7 到 16。 交易平仓时以及每分钟更新一次。 只读取历史记录,从不开仓或平仓
FREE

AAS Trading Suite — Market Structure, Fibonacci & Volume Profile for MT5 AAS Trading Suite is a multi-timeframe technical analysis indicator for MetaTrader 5 that combines structural price levels, manually positioned Fibonacci grids, reversal zones, Volume Profile and a volume histogram in one interactive chart workspace. The indicator is designed to help traders analyze market structure, identify important price areas and organize their charts before entering and managing trades. Key Features M

Atlas Premium — Multi-Currency Market Dashboard for MetaTrader 5 Atlas Premium is a multi-currency market analysis indicator designed for MetaTrader 5. It brings together currency strength analysis, market monitoring, trend assessment, and trading signal information in a structured on-chart dashboard. Atlas Premium is designed to help traders evaluate market conditions, identify potential trading opportunities, and make more informed trading decisions. Key Features 1. Currency Strength Analysis

Trading Sessions Board shows the forex market sessions (Sydney, Tokyo, London, New York), the ICT killzones, a candle timer and the spread in one clean panel. Free to use. What you see Which sessions are open right now, with a countdown to the next open and close Session overlaps (for example London / New York) highlighted ICT killzones (Asian, London open, New York AM, London close, New York PM) in New York time Candle timer: time left until the current candle closes Current spread in points To
FREE

适用于 MT5 的加密货币与外汇交易指标:HTF DeMarker - 专为技术分析交易者打造的强大工具,助力精准捕捉入场与出场点位。HTF 代表“更高时间周期”(Higher Time Frame)。 - DeMarker 震荡指标线反映了当前价格相对于前期高点和低点的位置。 - 在各类震荡指标中,DeMarker 能够提供最可靠的常规背离信号。 - 指标数值高于 0.7 即进入超买区,低于 0.3 则进入超卖区。 - 内置移动端及桌面端提醒功能。 - 非常适合结合“价格行为”(Price Action)入场策略的多时间周期交易系统,也可与其他指标配合使用。 - 支持在当前图表上直接应用更高时间周期的 DeMarker 指标——这是真正专业的交易方式。 Click here to see high quality Trading Robots and Indicators! 本产品为原创产品,仅在 MQL5 网站独家提供。

StructFlow SMC — Real-Time Momentum & Market Structure See Market Strength Instantly. Understand Momentum. Trade with Clarity. StructFlow SMC is an advanced yet easy-to-use MetaTrader 5 indicator that combines Real-Time Momentum Candles, Smart Money Concepts (SMC), and a Multi-Timeframe Market Strength Dashboard into one powerful trading tool. Designed for traders who want to understand market direction and momentum without complicated analysis. With dynamic candle colors that update as new pric
Range bar charts are unique financial price charts that eliminate the element of time entirely, focusing solely on specific price movements. A new bar is generated only when the price moves by a predefined price increment (or size), regardless of how many minutes, hours, or days that movement takes. Sideways Markets Compresses movement into few or single bars The Advantages Noise Filtration: Smooths out random price fluctuations during flat, low-volume consolidation periods. Clean Trendline

Hourly Volatility Monitor
Understand the hours behind your trading strategy.
Markets do not move at the same pace throughout the day. Hourly Volatility Monitor turns your symbol's historical H1 candles into a clear ranking of all 24 hours, from the largest typical price range to the smallest. Instead of estimating session activity by eye, compare what the broker's historical candles actually show.
The result is a dedicated full-chart dashboard that can be placed on a separate chart or displa

AlgoLens Analyst is a FREE edition built to let you try the AlgoLens approach on your own charts. It is a lightweight on-chart dashboard that reads the market across several timeframes and shows the picture in one clear, movable panel — fast, honest context before you decide, with no signals that promise the impossible. FREE EDITION — WHAT YOU GET Multi-timeframe read: trend and market structure on each timeframe, side by side (M15, H1, H4, D1). Nearby support and resistance: the closest levels
FREE

MetaTrader 5 外汇与黄金市场情绪指标 在一个 MetaTrader 5 仪表盘中查看 28 个主要外汇货币对和 XAUUSD 的买入/卖出情绪。 Forex and Gold Sentiment 是一款 MT5 指标,适合希望比较不同货币和黄金市场方向、又不想逐一切换图表的交易者。它根据价格变化、趋势、动量和波动率计算分析型市场情绪,并以百分比和易于理解的标签呈现结果。 在同一仪表盘中分析外汇和黄金市场 该指标扫描由 USD、EUR、GBP、JPY、CHF、CAD、AUD 和 NZD 组成的 28 个货币对,同时分析 XAUUSD 黄金市场情绪。如果您的经纪商提供相关交易品种,还可使用最多七个额外的黄金交叉盘进行辅助确认。 主要功能 28 个外汇货币对的情绪扫描: 在一个仪表盘中比较主要外汇货币对的市场情绪。 XAUUSD 黄金情绪: 结合整体外汇市场观察黄金,并在经纪商支持时通过其他黄金交叉盘进行确认。 买入/卖出百分比: 通过百分比数值和可视化条形图查看每个市场计算得出的情绪平衡。 直观的方向标签: 以 Strong Buy、Buy、Even、Sell 或 Strong

UT Bot Alerts for MetaTrader 5 A faithful MQL5 port of the legendary UT Bot Alerts indicator, originally created for TradingView by @Yo_adriiiiaan and @HPotter, with the alerts version by @QuantNomad. This indicator plots a dynamic ATR-based trailing stop line and generates buy/sell signals when price crosses it, making it one of the most popular and versatile trend-following tools in the trading community. Features: ATR-based trailing stop line Buy and sell arrow signals Heikin Ashi mode option

This is the test product. Please, DO NOT BUY IT! This is the test product. Please, DO NOT BUY IT! This is the test product. Please, DO NOT BUY IT! This is the test product. Please, DO NOT BUY IT! This is the test product. Please, DO NOT BUY IT! This is the test product. Please, DO NOT BUY IT! This is the test product. Please, DO NOT BUY IT! This is the test product. Please, DO NOT BUY IT!
MetaTrader市场是一个简单方便的网站,在这里开发者可以出售自己的交易应用程序。
我们将帮助您发布您的产品,并向您解释如何为市场准备您的产品描述。市场上所有的应用程序都是加密保护并且只能在买家的电脑上运行。非法拷贝是不可能的。
