 MetaTrader 5
 Experts
 Indicadores
 Bibliotecas
 Utilitários
 Widgets
 Regras
Conheça o Mercado MQL5 no YouTube, assista aos vídeos tutoriais
Como comprar um robô de negociação ou indicador?
Execute seu EA na
hospedagem virtual
hospedagem virtual
Teste indicadores/robôs de negociação antes de comprá-los
Quer ganhar dinheiro no Mercado?
Como apresentar um produto para o consumidor final?
Indicadores Técnicos para MetaTrader 5 - 232
 É com base nos sinais de indicadores técnicos que se aplicam as decisões para abertura ou fechamento de uma transação nos mercados de ações e Forex. A essência dos indicadores reside na previsão de mudanças de preço, com base na conversão matemática de preço e/ou volumes de um instrumento financeiro.
Teste os indicadores técnicos para prever melhor o comportamento do mercado e lucrar com isso.

Market Trend & Breakout Filter with Push Alerts is a powerful and advanced MetaTrader 5 (MT5) indicator designed to identify true market trends and high-probability breakout opportunities while effectively filtering out market noise and false signals. Unlike standard indicators that constantly fluctuate between neutral and ranging states, this tool utilizes a strict Trend Latch Logic . Once a trend (Uptrend or Downtrend) is established, it remains locked until all strict criteria for a full tre

Footprint MLP transforms tick-level market activity into footprint features and uses a multilayer perceptron machine learning model to learn nonlinear relationships between order flow and future price behavior. It captures temporal context through lagged inputs, rolling statistics, multi-timeframe features, and paired-symbol data, with configurable training, chronological validation, and feature selection.
Three Learning Modes
Base Learn trains a model using the configured parameters; training

Footprint GBDT is a machine-learning system that applies Gradient-Boosted Decision Trees to market data represented through tick-derived footprint features. Lagged observations, rolling statistics, and multi-timeframe inputs provide temporal context, while configurable training, chronological validation, feature selection, and paired-symbol data support model development and evaluation.
Three Learning Modes
Base Learn trains a model using the configured parameters; training runs across multi

Alpha Buy Sell Signal KPG - Guia do Usuário (MT5) O Alpha Buy Sell Signal KPG é um indicador projetado para apoiar a análise de acompanhamento de tendências e momentum para o MetaTrader 5. Ele exibe sinais claros de compra e venda no gráfico, combinados com uma fita de tendência dinâmica e um painel de múltiplos timeframes para ajudar os traders a visualizar a direção do mercado e a força do momentum.
O indicador foi projetado para apoiar a tomada de decisões, mostrando o viés de tendência atu
FREE

OVERVIEW
The market structure indicator helps traders easily read market trends, this indicator shows trend continuity and trend reversals, this tool will be very useful for beginners who are just getting to know market structure, the indicator will provide visualization of the patterns that occur
Key Features: BOS pattern The indicator will provide an overview of the Break Of Structure pattern, where the pattern will indicate the continuation of the trend. CHOCH Pattern The indicator will pr

God's Eye God's Eye is an institutional-grade volatility, market structure, and algorithmic liquidity engine built specifically for MetaTrader 5. Unlike typical lagging retail indicators that rely on basic smoothing formulas (like EMAs or Bollinger Bands), God's Eye scans raw historical price action structures across multiple timeframes simultaneously. It maps out institutional liquidity pools, equal high/low stop-loss clusters, and asset-adaptive volatility exhaustion levels with zero lag. Whe

Market Scanner Board shows the trend of many symbols on four timeframes in one clear table, so you see in seconds where the market is moving and where it is quiet. What you see for every symbol Price and day change in % Trend on M15, H1, H4 and D1: UP, DOWN or FLAT (price and fast EMA above or below the slow EMA) Trend bar: how many timeframes agree RSI on H1 (overbought and oversold values are coloured) RANGE: today's range in % of the average daily range (ATR D1). Values above 100 % are highli

SpikeLinker: Análisis Institucional Sin Fronteras SpikeLinker no conoce de límites geográficos ni de clases de activos. Su arquitectura de código híbrida está diseñada para ofrecer una experiencia analítica de nivel institucional en cualquier mercado financiero del mundo , adaptándose de forma automática a la volatilidad y estructura del activo donde lo coloques. Descripción Comercial Global (Lista para tu Web o Tienda) Lleva tu operativa al siguiente nivel sin importar el instrumento que
FREE

Bressert Cycle Signals Like the logic of this tool?
All author's products: https://www.mql5.com/ru/users/musa1994/seller
Trading philosophy: https://developer-mql4-mql5.netlify.app/ Bressert Cycle Signals (BCS) is a professional cyclical indicator for MT5, adapting Walter Bressert's methodology. It combines oscillator phase analysis with precise "Setup & Trigger" entry mechanics, displaying signals directly on candlesticks. What the indicator shows Bressert Oscillator (subwindow):

Weis Wave by Mudasser turns raw tick or real volume into clear up and down waves — so you can read effort vs. result at a glance.
Instead of looking at single-bar volume, this indicator stacks volume for as long as price keeps moving in the same direction. When the close flips, a new wave begins. The result is a clean histogram of blue (bullish) and red (bearish) volume waves that make climax, effort, and absorption easy to spot.
WHAT YOU GET • Cumulative volume waves based on close direction

Indicador CCI com Alertas para MT5 (Sem Repintura) - Um dos osciladores de negociação mais populares e confiáveis. - Alertas integrados para PC e dispositivos móveis: Dispara ao entrar ou sair de zonas de sobrecompra/sobrevenda, com níveis personalizáveis. - Como funciona: Mede a diferença entre o preço atual e sua média histórica. Níveis principais: +/-200, +/-100. - Estratégia de negociação: Ideal para identificar sinais de venda ao sair da zona de sobrecompra e sinais de compra ao sair da zo

MID Regime Filter – Adaptive Market Regime Filter ( protection, adaptive filtering, and the 4 market regimes ) Overview The MID Regime Filter is not a classic entry signal indicator. It is a powerful, adaptive market context filter designed specifically for algorithmic traders and Expert Advisor (EA) developers. It analyzes real-time market volatility and directionality to classify the current environment into one of 4 distinct market regimes . This allows your EA to dynamically enable, disab

JC OB Strategy turns your MetaTrader 5 chart into a complete Order Block engine: it finds institutional demand and supply zones, and the moment an Order Block is confirmed it opens a trade plan with ENTRY, STOP LOSS and three take-profit targets on the chart. WHAT IT DOES - Order Block detection (SMC/ICT engine): a bullish OB is a bearish candle followed by a strong bullish confirmation candle that closes above its high; a bearish OB is the mirror image below the low. Optional classic swing-base

Professional Fibonacci tool for MT5 featuring true opacity background zones, smart color gradients, and custom ATAS-style price labels. Detailed Description: Are you tired of the default, rigid Fibonacci tool in MT5 that clutters your charts and hides price action? Color Fibo Pro completely upgrades your charting experience by bringing the modern, clean, and highly customizable visual style of premium order flow platforms (like TradingView or ATAS) directly to your MetaTrader 5. Designed by a pr

Charts247 Price Value Bands MT5 Is price cheap, fair or stretched right now? Fair value with value bands measured from how far price really travels, the share of closes beyond each band, return arrows, a two-close T3 line, confirmed peaks and the M5 Fibonacci. Nothing repaints. Every market swings around a fair value. Most of the time it stays close; now and then it stretches far away, and from there it usually comes back. Charts247 Price Value Bands shows how far is far for the symbol and time

Formex é um indicador de análise de mercado multicomponente construído em torno da Amplitude Diária Média (ADR), combinando análise de amplitude, estrutura de mercado, força da moeda e avaliação de tendências em uma ferramenta integrada. Em sua essência, a Formex utiliza medições históricas de ADR para calcular e exibir níveis de preços dinâmicos em torno do preço de abertura diário. Esses níveis fornecem uma visão estruturada da faixa média do mercado, da expansão de preços atual, das áreas de

AlgoTrade Pivot Points draws the daily, weekly, or monthly pivot point, resistance, and support levels on the chart and shows the current price position on a card. It reads data only. What it does Five formulas: Classic, Fibonacci, Camarilla, Woodie and DeMark, based on the previous day's, week's or month's high, low and close (DeMark also uses the open). Levels from R1 and S1 up to R3 and S3, or up to R4 and S4 with Camarilla. Lines for the current period from its start, showing each level's na
FREE
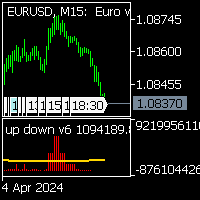
up down v6 for mt5 is no repaint all timeframe and all pairs indicator. red histogram cros trigger that is up point,and put a red point on histogram. and blue histogram cros trigger that is deep point.and put blue point on histogram. this indicator need to sometimes zoom out .for thise pres + button. if newly comes signal is too high makes before invisible.red and blue points are there.to see the signals. indicator is no repaint and can use all time frame and all pairs. only need minimum 500 bar
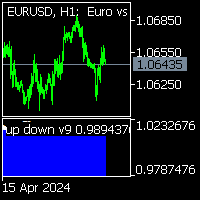
indicator is no repaint trend indicator.for mt5 when white stars up to Red histogram that is probably end of long trades. when White stars up to Blue histogram that is probably end of down trades. indicator can use all pairs and lower than weekly charts, to use weekly chart need to at least 500 bars data on back.and lowering processing value 500. it is also suitable for 1m charts. indicator hold long way to go. there is not too many signals.
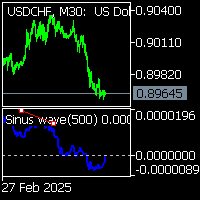
Sinus wave indicator is a extra ordinary oscillator.to find divergency.for mt5 it works all pairs and all timeframes. suitable for experienced and beginner traders.. indicator works on toward of the prices... while sinus wave go up side that means prices will up. and while sinus wave go down that means prices is going down. it gives divegency when trend reversals. there is wave to set default 500. on pictures divergency lines and letters has been drawn by hand.to explain how it works.

The “Kalman Filter Color” indicator was faithfully designed based on the official Python library called pykalman, which in turn was based on the original Kalman filter created by Rudolf Kalman in 1960. The traditional Kalman filter is based on an algorithm that has a wide variety of applications in physics and engineering. It involves the control and prediction of states (prices) based on self-adjusting mechanisms and in the presence of noise. In this case, pykalman has been adapted and optimiz
FREE

AlgoTrade Correlation Matrix shows how the symbols of your list move together, as a colored matrix on a card, with the symbols that move most with and most against the chart symbol. It reads data only. What it does Up to 10 symbols from a comma separated list (by default EURUSD, GBPUSD, USDJPY, AUDUSD, USDCAD, USDCHF, NZDUSD, XAUUSD). The chart symbol is added when it is not in the list. Finds each symbol at your broker, with the chart symbol's prefix and suffix (for example EURUSD.pc). Tabs for
FREE

This indicator automatically detects and visualizes specific market trading sessions (such as the Asian session and custom timeframes) directly on your chart. Here is a brief, professional breakdown of its key functions: Session High & Low Highlighting: It draws a colored background box (rectangle) covering the exact duration of the selected trading session, using the highest and lowest prices formed during that period. Key Structural Levels & Breakout Tracking: The indicator automatically plot
FREE

AlgoTrade ATR Stop Levels displays the average true range (ATR) of the chart symbol and the stop distance: ATR times a multiplier. It draws the stop for a buy and the stop for a sell on the chart, and shows the ATR on four timeframes on a card. It reads data only. What it does The ATR of the last closed bars (14 by default), on the chart timeframe or on M15, H1, H4 or D1. Stop distance equals ATR times the multiplier (1.5 by default), rounded up to whole ticks. Two dashed lines from the newest b
FREE

This is the test product. Please, DO NOT BUY IT! This is the test product. Please, DO NOT BUY IT! This is the test product. Please, DO NOT BUY IT! This is the test product. Please, DO NOT BUY IT! This is the test product. Please, DO NOT BUY IT! This is the test product. Please, DO NOT BUY IT! This is the test product. Please, DO NOT BUY IT! This is the test product. Please, DO NOT BUY IT!
O mercado MetaTrader é um espaço, sem precedentes, para negociar robôs e indicadores técnicos.
Leia o artigo Manual do usuário da MQL5.community para saber mais sobre os serviços exclusivos que oferecemos aos traders: cópia de sinais de negociação, aplicativos personalizados desenvolvidos por freelances, pagamentos automáticos através de sistema de pagamento e a rede em nuvem MQL5.

Você está perdendo oportunidades de negociação:
- Aplicativos de negociação gratuitos
- 8 000+ sinais para cópia
- Notícias econômicas para análise dos mercados financeiros
Registro
Login
Você concorda com a política do site e com os termos de uso
Se você não tem uma conta, por favor registre-se