 MetaTrader 5
 エキスパート
 インディケータ
 ライブラリ
ライブラリ
 ユーティリティ
 ウィジェット
 ルール
ルール
YouTubeにあるマーケットチュートリアルビデオをご覧ください
ロボットや指標を購入する
仮想ホスティングで
EAを実行
EAを実行
ロボットや指標を購入前にテストする
マーケットで収入を得る
販売のためにプロダクトをプレゼンテーションする方法
MetaTrader 5のためのテクニカル指標 - 200
 テクニカル指標からのシグナルは、株式および外国為替市場での取引の開始と終了に重要な役割を果たします。指標の本質は、将来の価格変動を予測することを目的とした金融銘柄価格の数学的変換です。
テクニカル指標をテストして、市場の動きとそれからの利益をより正確に予測します。
テクニカル指標からのシグナルは、株式および外国為替市場での取引の開始と終了に重要な役割を果たします。指標の本質は、将来の価格変動を予測することを目的とした金融銘柄価格の数学的変換です。
テクニカル指標をテストして、市場の動きとそれからの利益をより正確に予測します。 
MT5用 MinTowin クオンツ・トレード・スイート 次回設定価格 79$ MinTowin は、MetaTrader 5 チャート上で高精度なエントリー信号、多層的なトレンド確認、および構造化されたリスク管理を必要とするトレーダー向けに設計された、プロフェッショナルなアルゴリズム市場構造&動的モメンタム分析スイートです。 主な技術的優位性: MinTowin は、独自のボラティリティ拡大メトリクスとマルチタイムフレーム構造同期を組み合わせることで、市場ノイズを排除し、再現性の高いトレンド継続およびブレイクアウト・セットアップを特定します。 主な機能 適応型市場構造フィルター: 市場レジームの転換を検知し、短期スキャルピングの機会を上位足のトレンド方向に同調させます。 機関投資家レベルのリスクエンジン: 価格のスイングポイントとボラティリティ拡大に基づき、構造的なストップロス(Stop Loss)レベルを動的に算出します。 マルチティア利益配分: ポジションの部分決済やトレーリング管理のために、複数の構造的テイクプロフィット(Take Profit)レベルを生成します。 Cybe

Valkyrie is designed for traders who want a structured, visual decision tool for short-term market setups without using an automated trading robot.
The indicator automatically switches between two market modes:
- BB Mean Reversion Mode for ranging or choppy markets - Trend Following Mode when ADX and DI confirm directional momentum
In range conditions, the indicator looks for Bollinger Band reversal and continuation setups using RSI, MACD, candle direction, and volume confirmation. In trendi

Fast & Slow EMA Crossover Indicator Fast & Slow EMA Crossover is a powerful, precise, and highly optimized technical indicator designed for the MetaTrader 5 platform. It helps traders effortlessly identify market trends and spot potential reversal points through the crossover of two Exponential Moving Averages (EMA). Engineered strictly according to MQL5 Automatic Validation standards, this indicator ensures lightning-fast execution, zero chart lag, and rock-solid stability across all timeframes

The Break Even Momentum (BEM) indicator continuously measures the strength of buyers and sellers . When these forces become noticeably balanced and reach a momentary equilibrium, the indicator displays a signal.
The signal may indicate the beginning or end of a trend, a super trend, the generation of subtle support or resistance, or points of mean reversion .
This strategy can be used for entry or exit trades. Furthermore, it allows for the identification of potential profit targets, whether

Market Direction Pro is a professional indicator for MetaTrader 5 that transforms complex market behavior into clear, confirmed direction.The indicator does not redraw signal arrows. Built around a proprietary multi-stage analytical process, it helps traders filter intrabar noise and focus on signals that remain stable after confirmation. Bullish and bearish arrows appear directly on the main price chart, while the dedicated visual interface presents direction, turning points and signal context

CRT & CCT Scanner Dashboard (MT5) The CRT & CCT Scanner Dashboard is a professional, multi-functional MetaTrader 5 indicator designed to automate and optimize multi-asset technical analysis. It scans your entire Market Watch window in real-time to instantly detect price setups based on CRT and CCT methodologies. Key Features: Automated Market Watch Scanning: No more manual chart flipping. The dashboard processes up to 50 symbols simultaneously. Standard & Custom Timeframes: Supports standard tim

# Noise Gate Trend System
**Noise Gate Trend System** does exactly what its name says: it gates out market noise and only lets the real swings through. Around that gate it builds a complete, self-contained trading workstation — it tells you three things at a glance: *what the trend is* , *when to enter* , and *where your stop and targets are* — without a single extra indicator on the chart.
The gate itself is a **twin adaptive volatility range filter** . Price has to travel further than the m

Description: Stay ahead of the market with a clean, professional, and highly optimized Economic News Indicator directly on your MT5 chart. Designed specifically for traders who need real-time news visibility without the chart clutter. Key Features: Customizable Currency Selection: Easy dropdown menu to select up to two currencies (USD, EUR, GBP, JPY, AUD, NZD, CAD, CHF, CNY) to match your trading pairs perfectly. Impact Filters: Display only what matters to you by toggling High, Medium, or Low i

# Premium Signal Toolkit — All-in-One Trend, Signal and Reversal System
**Ten proven analysis engines on one chart, condensed into one arrow and one line you can actually trade.**
Most "all-in-one" indicators fail for the same reason: they draw everything at once and leave you staring at a wall of colour. Premium Signal Toolkit runs ten independent engines in the background, but shows you only what you asked for — and reports the state of everything else in a compact panel in the corner of yo

Overview Overnight Range Box is a visual session indicator for MetaTrader 5. It marks the high and low of a configurable overnight or intraday trading session directly on the chart. The indicator can display completed historical sessions as well as the currently developing range. Session times, colors, labels and extensions can be adjusted to suit different markets, brokers and trading routines. The product is intended for traders who use session structure, overnight highs and lows, range breako

トレンドオラクル&ゼロマックスシステム:インパルス動きを予測する革新的なアルゴリズム 勢いの強い価格爆発の前に市場に参入し、逃げ出す列車を追いかけるようなことはしたくないと思いませんか?
プロフェッショナル向けトレーディングシステム「ゼロマックス」に搭載された、高精度なモメンタム予測指標「トレンドオラクル」をご紹介します。この次世代ツールは、特に金(XAUUSD)のようなボラティリティの高い銘柄を取引する際に、絶対的な明瞭さを必要とするトレーダーのために設計されています。
トレンドオラクルの秘密とは?
トレンドオラクルの最大の特長は、隠れた累積的な保ち合い局面を特定できることです。アルゴリズムが市場データを単一の収束点に圧縮すると、巨大なエネルギーの急上昇が間近に迫っていることを示唆します。
インパルス形成のゼロポイントでエントリーシグナルを受け取ることができ、最小限のストップロスで最大限の利益を得ることができます!
ゼロマックストライアド:3つの指標の相乗効果 ゼロマックスは単なるシグナルではありません。これは完全かつ自己完結型のエコシステムです。3つの

Quantum Delta VWAP — Профессиональный Анализ Объемов и Order Flow Quantum Delta VWAP — это мощный индикатор нового поколения для MetaTrader 5, разработанный для интрадей-скальпинга и систем Smart Money (SMC/ICT). Благодаря скоростному движку Canvas с двойным шлюзом кэширования, он выводит объемы на экран в реальном времени без задержек, лагов и мерцания . Индикатор идеально подходит для торговли золотом (XAUUSD), валютами, индексами и криптой, позволяя наглядно видеть действия крупных игроко

Omega Matrix Pro Advanced Multi-Indicator Confirmation System for MetaTrader 5 Omega Matrix Pro is a professional MT5 indicator designed to help traders identify high-probability BUY and SELL opportunities by combining confirmations from multiple technical indicators into a single intelligent decision. Instead of relying on one indicator, Omega Matrix Pro analyzes market conditions using a complete confirmation matrix, providing a clear visual dashboard, entry arrows, confidence score, and insta

3 つ建てて、3 つとも同時に含み損。これはたいてい運の問題ではありません。
選んだ銘柄が普段から一緒に上がり、一緒に下がるものであれば、損もまとめて出るのが当たり前です。分散したように見えて、実際には同じ取引を 3 回繰り返しただけということが起こります。
分散の意味は、片方が負けているときにもう片方に勝つ可能性があることです。銘柄が一体となって動くなら、その可能性はありません。
このパネルがすることは一つです。いま保有しているポジションを、実質的に何件の異なる取引に相当するかという数字に変換します。
EFFECTIVE POSITIONS 1.2 of 3
3 つ建てていて、実質は約 1.2 件。残りの 1.8 件は何も分散しておらず、ロットを増やしただけです。
いつ使うか
エントリー前:もう 1 つ建てたいとき、どの銘柄なら本当に 2 件目になるのかを確認する。 保有中:いま持っているポジションが同じリスクになっていないか、減らすべきかを見る。 振り返り:思っていたより損失が大きかった理由は、たいていここに出ています。
具体例
GBPUSD を買って

WHALETRADES PRO - Complete Strategy Guide
Understanding Your Trading Arsenal
WhalesTrade Pro is your window into the institutional side of the market. It combines three powerful trading systems into one comprehensive tool that reveals what's really happening beneath price action.
The numbers changing on your chart are not random. Each one tells a specific story about market participants, their conviction, their fear, and their greed. Learning to read these numbers transforms you from a gambl

Kito AutoTrendline Pro is an automatic trendline intelligence indicator for MetaTrader 5. Instead of drawing every possible line, it evaluates confirmed swing anchors, validates each candidate against price action, measures independent touches and reactions, suppresses duplicate structures and ranks the remaining trendlines with a 0–100 strength score. Only the strongest support and resistance structures are displayed, helping traders read market geometry without manually drawing and constantly

Advanced Market Sessions is a professional, all-in-one market session tracker designed for serious day traders and swing traders. It accurately tracks the Sydney, Tokyo, London, and New York sessions with bulletproof precision — ensuring your session times are always mathematically correct, even if your PC clock is wrong, out of sync, or you travel between timezones.
WHY TRADERS CHOOSE THIS INDICATOR:
BULLETPROOF TIME ACCURACY Sessions always open and close at the exact correct real-world

Fractal Pattern Reader is an advanced multi-timeframe indicator that detects fractal alignments, divergences, and confluence zones across 5 timeframes simultaneously. It automatically calculates Entry, SL, and TP levels to spot high-probability setups.
Key Features Multi-Timeframe Tracking: Simultaneously analyzes 5 distinct timeframes: Higher Timeframe 1 (Main Bias), Higher Timeframe 2 (Trend Confirmation), MTF (Supply/Demand Zone), and two Lower Timeframes (Trigger and Execution) . Smart Patt

Step RSI Stochastic Signal Scanner Step RSI Stochastic Signal Scanner is an analytical indicator for MetaTrader 5 designed specifically for the analysis of Step Index and Step 200 Index . The indicator monitors Relative Strength Index (RSI) and Stochastic Oscillator conditions across multiple timeframes from a single panel. Its signal methodology evaluates oscillator levels, recent level crossings, and the relationship between RSI and Stochastic. According to the configured rules, each timeframe

QUANTUM SPIKE B&C QUANTUM SPIKE B&C is an advanced MQL5 trading system designed for MetaTrader 5. It combines volatility-based signal logic with an Auto-Adaptive Scaling Engine , a Multi-Timeframe EMA Strength Matrix , a Dynamic Risk-to-Reward (RRR) Box Tool , and an On-Chart Trend Filter . It is optimized for both currency pairs and Synthetic Volatility Indices (including Boom & Crash ). Key Features (In Short) Auto-Adaptive Pair Scaling Engine Automatically calculates candle volati

GOLD , XAUUSD Trading Signal
Position Management & Trading Rules Position Management
Important ( You must be Follow this) use only 15m Time frame Chart Gold Small Position Take Profit (TP): 2400 Points Stop Loss (SL): 1450 Points Big Position Take Profit (TP): 4000 Points Stop Loss (SL): 1650 Points Entry Rules When the main indicator generates a Buy signal, enter the trade at the closing price of the same candle that produced the signal. The same rule applies to Sell signals. Enter the Se

True Trendline for MT5 〜伝説のMT4ラインロジックを、MT5専用にフルスクラッチで完全再構築〜 概要 世界中のトレーダーに愛用され、MT4時代に圧倒的な支持を得たトレンドライン描画ロジック「TrueTL」。
その思想をリスペクトしつつ、MetaTrader 5(MT5)の構造に合わせてゼロから再設計したのが本製品 『True Trendline for MT5』です。 単なる移植ではありません。
「1ピクセル単位の描画一致」と「MT5専用の爆速アルゴリズム」 を両立させた、 次世代のトレンドラインエンジンです。 本製品の4つの強み 1. 伝説のラインロジックを“完全再現” フラクタルと独自のローソク足パターン解析を組み合わせた、
「意識されるライン」だけを抽出する精度 は本家TrueTLと完全一致。
MT4からMT5へ移行しても、分析環境が変わらない安心感があります。 2. MT5専用の“超高速・軽量化”アルゴリズム 一般的な自動描画インジは重く、チャートがカクつく原因になります。
本製品は、 価格データのキャッシュ化 斜面計算の事前高速演算 オブジェク

CapitalSol Market Brief Pro CapitalSol Market Brief Pro は、MetaTrader 5 のチャート上で動作する市場分析インジケーターです。トレンド、モメンタム、取引セッション、価格ゾーン、流動性、日中レンジ、スプレッドに関する情報を、1つのコンパクトなダッシュボードにまとめて表示します。 複数のインジケーターを同時にチャートへ追加することなく、現在の市場環境を構造的に把握したいトレーダー向けに設計されています。 Market Brief Pro は分析専用のインジケーターです。新規注文、決済、ポジション管理は行いません。 ダッシュボードの主な情報 ダッシュボードには、以下の6つの分析項目が表示されます。 Market Bias Trading Session Premium / Discount Zone Liquidity Location Daily Range Status Spread Status さらに、ダッシュボード下部には、現在のシンボル、チャートの時間足、MetaTrader の取引サーバー時間が表示されます。 分

Auto Trade Journal with Screenshots
取引の瞬間を自動でスクリーンショットに記録 取引日誌をつけることは、あらゆるメンターが勧めながらも、ほとんど誰も続けられない習慣です。手作業では時間がかかり、つい省略してしまうからです。手書きの記録は数値を残すことはできても、エントリーやエグジットのその瞬間にチャートが実際どう見えていたかを示すことは決してできません。しかし、学びはまさにそこにあります。 Auto Trade Journal with Screenshots は、これを口座全体に対して自動で行います。取引が開始、決済、部分決済されるたび、あるいは損切りや利食いの水準が変更されるたびに、その瞬間のチャートのスクリーンショットを保存し、詳細情報と画像パスをCSVの1行として記録します。手動取引でも、どのExpertによる取引でも区別なく記録します。
MetaTrader 4 と MetaTrader 5 の両方に対応しており、Market上ではそれぞれ別製品として販売されていますので、ご使用の端末に合ったバージョンをお選びください。あらゆる銘柄、あら

Professional Volume Profile, POC, Value Area, HVN/LVN & Naked POC Analysis Auction Matrix Pro is an advanced market profile and auction market theory indicator designed for traders who want a deeper understanding of price acceptance, price rejection, volume concentration, and market structure. The indicator automatically builds a dynamic Daily Volume Profile and provides real-time visualization of: Point of Control (POC) Value Area High (VAH) Value Area Low (VAL) Developing POC High Volume Node

KS H4 Synthetic Candle Proは、完全に確定したH2(2時間足)バーのペアから、ブローカーに依存しない合成4時間足を作成するMetaTrader 5用インジケーターです。
基本コンセプト
ブローカー固有のH4時間足(サーバーの時差設定によって開始時間が変動する可能性があります)に依存するのではなく、このインジケーターは以下の動作を行います。
H2チャート上で動作します。
現在形成中のH2バー(シフト0)は完全に無視します。
直近で確定した2つのH2バーを統合し、1つの合成4時間足を作成します。
始値 (Open) = 古い方のH2バーの始値
終値 (Close) = 新しい方のH2バーの終値
高値 (High) = 2つの高値のうち高い方
安値 (Low) = 2つの安値のうち低い方
古いバーのペアに対しても同様の処理を繰り返し、複数の合成ローソク足を描画します。
新しいH2バーが確定した時にのみ更新されるため、合成ローソク足が「リアルタイム(形成中)」や「不完全な状態」で表示されることはありません。
ペアリングは純粋にバーの数(サーバー時

AKILLI ALTIN GİRİŞ YARDIMCISI v7.0 Teknik ve eğitim göstergesi 1 AKILLI ALTIN GİRİŞ YARDIMCISI v7.0 MT5 Altın Analizi ve İşlem Giriş göstergesi AKILLI ALTIN GİRİŞ YARDIMCISI v7.0, MetaTrader 5 kullanıcılarının XAUUSD (ALTIN) piyasadaki ve potansiyel işlem yüklemelerini bir şekilde değerlendirmelerine yardımcı olmak için belirlenen analiz zaman aralığı analiz göstergesidir. Gösterge, yalnızca AL veya SAT göstermek yerine, ana trend, piyasada mevcut, önemli fiyat bölgelerini, mome

VP Quant Algo Indicator - Professional Trading Guide
What This Indicator Does For You
This is not just another indicator - it's a complete trading cockpit that combines institutional volume analysis, order flow intelligence, and quantitative signal confluence into one powerful tool. Let me break down exactly what each piece does and how you can use it to trade with an edge.
---
The Five Core Systems
Smart Money Volume Index - The Lower Window
What it shows:
· Buy Interest (aqua line) - S

WHAT IS PRIME ZONES? Prime Zones is a professional market structure indicator designed to automatically identify key Support and Resistance Zones , monitor how price interacts with them, and provide additional trend context through a Dual Regression Channel system . Instead of filling the chart with dozens of horizontal lines, Prime Zones displays clean and visually defined price areas where the market has previously shown meaningful reactions. The indicator combines four main concepts in a sing

Substantial Arrows — 方向を見て、勢いを読み、シグナルに集中する Substantial Arrows は、MetaTrader 5 用に設計されたプロフェッショナルなトレーディングインジケーターです。 市場方向とトレード候補を、よりシンプルで整理された方法で確認したいトレーダー向けに設計されています。 マルチタイムフレームの Market Trend、Trend Candles、適応型 Arrow Signals を1つのチャート環境に統合しています。 Multi-Timeframe Market Trend 対応タイムフレーム: MN1 • W1 • D1 • H4 • H1 • M30 • M15 • M5 • M1 各タイムフレームは、 BUY • SELL • NEUTRAL として表示されます。 Trend Candles Trend Candles は、市場の強気・弱気状態を視覚的に表示します。 表示をOFFにしても、他のインジケーター機能には影響しません。 Main Arrows 条件が確認された後、BUY / SELL の矢印がチャート上に表示さ

GoldScalp Signal Pro GoldScalp Signal Pro is a technical trading indicator designed primarily for XAUUSD (Gold). It combines EMA trend analysis, RSI momentum confirmation, and ADX trend-strength filtering to help traders identify potential BUY and SELL opportunities. Key Features - BUY and SELL signals displayed directly on the chart - EMA 10 / EMA 20 trend filter - RSI momentum confirmation - ADX trend-strength filter - Fully customizable indicator parameters - Designed primarily for XAUUSD - S

「KS Master Tool 12 in 1 Trade with Me」は、複数の取引ツールを単一のチャートウィンドウ・オーバーレイに統合した、MetaTrader 5 (MT5) 用のカスタムインジケーター(単一ファイル構成)です。
各モジュールはマスター・スイッチによって完全に有効化または無効化できるよう設計されています。モジュールをオフにすると、その計算、描画、タイマー処理、およびチャートイベント処理が完全にスキップされるため、無効化されたモジュールによるCPU負荷はゼロとなります。 モジュールの機能
SMC / フィボナッチ / 構造ブレイク (Structure Break) / FVG / CPR / IB (SMC対応チャートパターン)
Fair Value Gap (FVG): ラベル表示の有無、緩和(mitigation)による縮小表示、履歴表示数の制限設定
構造ブレイク (BOS / CHoCH): 履歴表示、現在の構造の強調表示、実体(body)またはヒゲ(wick)でのブレイク判定選択
フィボナッチ・レベル: 5つのレベル設定(表示/非表示切り替

LiquidityLabs FVG Pro is a multi-timeframe Fair Value Gap and liquidity-based trade setup indicator for MetaTrader 5, designed to identify higher-quality directional opportunities and display a complete trade plan directly on the chart. The indicator analyzes market structure, liquidity behavior, Fair Value Gaps and lower-timeframe confirmation to locate potential entries while maintaining the larger market context. Once a valid setup is confirmed, the indicator displays the entry level together

Crypto_Forexインジケーター「 ReTest Histogram 」(MT5用、リペイント機能なし) - ReTest_Histogramインジケーターは、強いS/Rレベルを再度テストした後に、主要トレンド方向へのエントリーシグナルを探すために使用できます。 - ReTest Histogramは2色で表示されます。赤は弱気トレンド、緑は強気トレンドです。 - ヒストグラムの列が同じ色で連続して表示された場合、新しいトレンドが発生していることを意味します。 - ReTestシグナルは、ヒストグラム上で反対色の列とトレンド色の列で表示されます(図を参照)。 - インジケーターには、モバイルとPCの両方でアラートが利用できます。 インジケーターの使い方: - 買いシグナルの場合:緑のヒストグラムが連続して表示(上昇トレンド)+赤の列が1つ(再テスト)+緑の列が1つ(ここでロングポジションをオープン) - 売りシグナルの場合:安定した連続した赤いヒストグラム(下降トレンド)+ヒストグラム上の緑の列1つ(再テスト)+赤い列1つ(ここでショートトレードを開始)。 Click here

Angle Iindicator MT5 - ターは、方向転換とトレンド確認のためのインジケーターです。
価格の動きを分析し、チャート上のピークとトラフを特定することで、反転ポイントを検出します。
トレンド方向をサポートします。
あらゆる金融商品と時間枠で使用できます。
内部パラメーターは既に設定済みです。インジケーターをチャートに配置し、「乗数」パラメーターを希望の結果に合わせて設定するだけで使用できます。
インジケーターは現在のローソク足上に矢印を生成します。ローソク足の形成中は、矢印が点滅することがあります。ローソク足が確定しても、矢印は過去の履歴には再描画されません。
方向転換のアラートが提供されます。
単独で使用することも、トレーディングシステムと組み合わせて使用することもできます。
インジケーターを正しく使用するには、「乗数」パラメーターを設定する必要があります。
インジケーターの結果は、チャート上で反転角度がどのように生成されるかによって異なります。
「乗数」パラメーターは連続するローソク足の構造を決定し、反転ポイントの頻度を決定します。 0.1か

Separated tick volume moving averages:
This tool makes it is easier to track the volume behind the moves. It will separate tick volume into bullish and bearish volumes with two separate moving averages. Tracking volume versus price in an easy way is now accessable to any trader. It will put you on track with the market makers and those who move the price. Volume is not the only thing which moves the price but its an important factor behind it. Hence it has a predictive power.
How tick volume w

Sniper Channels Base は、MetaTrader 5 用に設計された高精度な適応型トレンド追従インジケーターです。動的なチャネルと平滑化された平均線を計算し、正確なトレンド転換点と優位性の高い売買エントリーサインをチャート上に表示します。 スキャルピング、デイトレード、スイングトレードのいずれにおいても、 Sniper Channels Base はノイズを軽減し、遅延のない明確な視覚的シグナルを提供します。 主な特徴: 適応型トレンド検出: 色が変化する平均線により、強気(アクア)と弱気(レッド)のモメンタムを明確に識別。 高精度な売買サイン(矢印): トレンド転換時にATRに基づいた最適な動的距離で買/売矢印を自動描画。 チャネル上下線の表示切替: トレードスタイルに合わせて上下ラインの表示/非表示を簡単切り替え。 充実した多機能アラート: ポップアップ表示、効果音、Eメール、スマートフォンへのPush通知に対応し、チャンスを逃しません。 柔軟な適用価格設定: 終値、始値、高値、安値、中央値、典型値、加重終値などの各計算価格に対応。 高度に最適化されたプログラム:

GTI Buy/Sell v2 PRO Two SuperTrends. Six filters. Three signal grades. One clean chart. Most arrow indicators show you a signal and leave you guessing how much it is worth. GTI Buy/Sell v2 PRO scores every single signal from 0 to 5, sorts it into three quality grades, and then draws the complete trade plan — entry, stop loss and up to three targets — directly on your chart. You stop asking "should I take this one?" and start reading how much confirmation is actually behind it. THE SIGNAL ENGINE

IQAlgo Pro MT5 Indicator - Comprehensive Overview
Introduction
IQAlgo Pro is a revolutionary all-in-one trading indicator that consolidates seven powerful analytical systems into a single, cohesive tool. Designed for serious traders who demand institutional-grade analysis, this indicator transforms your MetaTrader 5 chart into a complete trading command center. Rather than juggling multiple indicators and trying to reconcile conflicting signals, IQAlgo Pro presents a unified view of market st

Wave X Pro AI Agents Indicator Wave X Pro is a signal-analysis indicator developed for MetaTrader 5 and designed for short-duration binary trading workflows. It operates on the M1 chart and presents directional signals with a five-minute evaluation period. The indicator combines several specialized analytical modules in one coordinated workflow. Each module examines a different aspect of price behavior before the system presents its final signal. Wave X Pro is an analytical tool. It does not exe

Stop Trading Blind. The Ultimate Confluence System is Here. Are you tired of repainting indicators that look great in history but destroy your live account? Yeah, I've been there. The market—especially aggressive beasts like XAUUSD—doesn't care about your feelings. It only respects cold, hard data.
That's exactly why SmartConfluenceDashboardPro was created. This isn't just another flashy retail tool; it's a complete, all-in-one institutional-grade trading ecosystem built strictly for MetaTrade

アジアレンジは誰でも引きます。Session Liquidity Sweep Stats は、そのレベルに 実際に何が起きたか を教えます。 各セッションの高値・安値をセッション確定の瞬間から追跡し、レベルへの接触を、自分で固定した判定時間足の上で3つの答えのどれかに決着させます。 スイープ されて反転したのか、 ブレイク されてそのまま伸びたのか、触れただけでその日は決着しなかったのか。 動作 アジアセッションが終わると、その高値と安値がチャートに描かれます。ロンドンが終わればロンドンの高安が加わります。以後は各レベルを1本ずつ監視し、価格が触れた瞬間に問いが開きます — このレベルは持ちこたえるのか、抜けるのか。 触れた足から2つの基準を取り、それらが競争します。その足の ヒゲ先 を終値で越えれば ブレイク — 動きが継続した。触れる直前の 逆足の始値 を終値で戻せば スイープ — 流動性が取られて反転した。先に決着した方が採用されます。レベルを貫いてその足の終値が既に越えている場合は、その時点でブレイクです。 同じ規則を過去にも適用するので、パネルは各レベルがこれまでどう振る舞っ

15銘柄、3つの時間足、1つのグリッド。緑はその通貨ペアでCRTのロングセットアップが成立したこと、赤はショートを意味します。セルをクリックすれば、その銘柄・その時間足のチャートに切り替わります。 なぜシグナルが出るのか 条件は厳格で、ローソク2本で完結します。1本目がレンジを定義します。2本目がそのレンジの片側 — ロングなら安値、ショートなら高値 — を取り、 再びレンジの内側で終値をつけます 。その先にあった流動性は取られ、価格はそこに留まることを拒否した。レンジの反対側の極値はまだ消化されておらず、それがこのセットアップの指し示す先です。 ルールはこれだけです。移動平均もオシレーターもなく、フィッティングもありません。ルールがここまで狭いからこそ、点灯したセルを開いて自分の目で本物かどうか確認できます。 得られるもの 数秒ごとに、全銘柄×全時間足の直近2本の確定足を再判定し、グリッドを更新します。緑のBUY、赤のSELL、あるいは静かなダッシュ。新しいシグナルごとにアラートが1回だけ鳴ります(ポップアップ・サウンド・プッシュ通知・メール、個別に切り替え可)。再アタッチ、再起動、

FAVERO RETURN SYSTEM Reversal Probability System The system was developed to identify market regions where price shows signs of potential exhaustion , combining overbought and oversold conditions with support and resistance levels from higher timeframes . The objective is not to claim that a reversal will necessarily occur, but rather to identify areas where the probability of a change in market direction may be increasing . How It Works The indicator primarily analyzes the following timefra

LiquidityLabs FVG Pro Intraday LiquidityLabs FVG Pro Intraday is a professional Fair Value Gap and liquidity-analysis indicator designed for shorter-duration intraday opportunities. The indicator continuously analyzes market structure, liquidity behavior, directional conditions and Fair Value Gap activity to identify potential intraday setups and display a complete trade plan directly on the MetaTrader 5 chart. Rather than simply marking every Fair Value Gap, LiquidityLabs FVG Pro Intraday filte

Gold Power G.P — Read Gold Price Action with Clarity Gold Power G.P is a specialized indicator designed exclusively for XAU (Gold) , providing a clear and dynamic visual representation of market movement and helping you understand changes in momentum and price behavior without overwhelming your chart with unnecessary complexity. The indicator displays market movement in a dedicated window with an intuitive visual presentation, allowing you to choose the display style that best suits your analys

LuoMo Volume & Price Structure 8.98 A multi-function chart indicator for MetaTrader 4 and MetaTrader 5 , designed to display key volume, volatility, sentiment, and price-structure information directly on the main chart. Main Features Volume and price-based Support & Resistance Volume spike and exhaustion signals ATR volatility expansion alerts Volume Profile with HVN and LVN Bullish and bearish sentiment distribution Developing or fixed POC VAH and VAL levels Supply and Demand zones Volume-wei

Sniper Channels MTF は、MetaTrader 5 用に設計された高度なマルチタイムフレーム(MTF)トレンドチャネルインジケーターです。上位足(HTF)の動的なサポート/レジスタンスチャネルおよびトレンド転換をリアルタイムで計算し、リペイント(描き直し)や遅延なしで現在のチャートに直接表示します。 FX、株価指数、コモディティ、暗号資産のスキャルピング、デイトレード、スイングトレードのいずれにおいても、 Sniper Channels MTF は上位足のトレンド方向と高確率な反転ゾーンを迅速に特定するのに役立ちます。 主な特徴 マルチタイムフレームエンジン: ウィンドウを切り替えることなく、M5、M15、M30チャート上にH1、H4、日足チャネルをシームレスに表示。 カラーチェンジトレンドライン: トレンド方向の確定に伴い、中央ラインの色が即座に変化(ライムグリーン = 上昇 / マゼンタ = 下降)。 エントリーシグナルダイアモンド: チャート上のダイアモンドアイコンが上位足のトレンド転換点をリアルタイムでマーク。 BUY / SELL テキスト表示: シグナルポ

Support Resistance 90 Support Resistance 90 draws clean pivot-based support and resistance bands and adds a trend layer on top: once price breaks a level, only the side that matters stays on the chart. Break above resistance and the support band leads the move; break below support and the resistance band takes over. The result is a chart that shows one clear side at a time instead of a screen full of crossing lines. A built-in dashboard tracks how the signals would have performed — last result,

Sniper Channels Base with MTF は、MetaTrader 5 用に設計されたオールインワンの高度なトレンドチャネルインジケーターです。現在のタイムフレームのチャネルダイナミクスと、上位足(HTF)のトレンドフィルターおよびマルチタイムフレームシグナルを組み合わせ、ノーリペイントかつ遅延なしでチャート上に直接表示します。 FX、株価指数、コモディティ、暗号資産トレード向けに開発された Sniper Channels Base with MTF は、下位足のエントリーセットアップを上位足のトレンド方向と一致させ、勝率向上とドローダウン軽減を実現します。 主な特徴 デュアルチャネルエンジン: 現在のタイムフレームと上位足(HTF)のチャネルを1つのチャート上に同時に計算・描画。 MTF トレンドフィルタリング: 上位足のトレンドに逆らう低確率な短期シグナルを自動的に除外。 カラーチェンジトレンドライン: トレンド傾斜の確定に伴い、中央ラインの色が即座に変化(水色/ライム = 上昇、赤/マゼンタ = 下降)。 シグナル矢印&MTFダイアモンド: 現在足の明確なエント

Indicator Description Opportunity Identification Indicator — Smart Money This indicator was developed to assist in identifying moments when prices may be reaching areas of greater interest , seeking possible signals in market behavior associated with the concept of “smart money” (Smart Money) , widely discussed in financial literature and market studies. The proposal is to create a bridge between technical analysis and fundamental analysis . The indicator uses technical analysis and price behavi

SMC Ultimate Pro Suite — MT5向けスマートマネーコンセプト(SMC)8-in-1インジケーター
1つの強力なインジケーターで8つの完全なトレーディングシステムを手に入れましょう。コストを節約し、チャートをクリーンに保てます。XAUUSD(ゴールド)とFX向けに最適化。再描画なし——すべてのシグナルは確定したローソク足でのみ確認されます。
内容:
1) スマートマネーコンセプト — アドバンス
• スイングピボットからの需要・供給ゾーン、ATR基準の幅、中央配置のSUPPLY/DEMANDテキスト + POI中央線、重なり拒否(ATR × 2)、5ゾーンのリング履歴
• 価格がレベルをブレイクするとゾーン→BOSラインへ自動変換
• マーケット構造: BoS / CHoCH / I-BoS / I-CHoCH(破線 + ラベル; 内部3-5-8 / 外部10-25-50)
• フェアバリューギャップ(FVG)— closeOnlyモード(直近のFVGのみ着色)、収縮・ブレイク処理
• ローリング4H/1D高値・安値 + 出

The Ghost Face Indicator is a trend-following technical indicator that combines the filtering principles of Tower (TOWER) lines and Heikin-Ashi. By dynamically changing bar colors ("changing face") based on price breakouts relative to recent key highs and lows, it effectively filters out intraday noise, helping traders capture major uptrends and downtrends.
Core Logic & Mechanism
Dynamic Color Switching : Instead of relying on a single candle's open and close prices, it compares price extreme

PROMO-SALE RUNNING
Pre-Wick Retrace Indicator for MT5 Pre-Wick is a Meta Trader 5 price-action indicator designed to help traders identify potential retracement setups before price reaches the proposed entry area. The indicator analyzes price movement, wick rejection, market structure and trend conditions to identify potential setup areas on the chart. When a setup is confirmed on a closed candle, Pre-Wick can display: Entry Zone
Limit Entry
Stop Loss
Take Profit This allows traders to plan

Stryker Levels — Precision Daily Breakout Detection with Live TP/SL Projection Every institutional trading desk watches the same two numbers each session: yesterday's high and yesterday's low. These levels are where liquidity pools, where stop hunts happen, and where the highest-probability breakout and reversal setups form. Stryker Levels turns this concept into a fully automated, non-repainting detection engine that works silently in the background so you never miss the moment price commits to

# SessionLevels PRO MT5 – Smart Session High & Low Indicator
## Professional Trading Sessions Indicator for MetaTrader 5
SessionLevels PRO is a powerful MT5 indicator designed to automatically plot the most important trading session levels directly on your chart.
Perfect for Smart Money Concepts (SMC), ICT traders, price action traders, and anyone who relies on institutional market structure.
### Features
Asia Session High & Low
London Session High & Low
New York Session High & Low

Turn market slope into your greatest trading advantage! Tired of lagging and subjective indicators? AngleMeter Pro is here to revolutionize your chart analysis in MetaTrader 5. Powered by advanced trigonometry and statistical linear regression, it measures the exact trend angle in real time using a striking visual protractor with a continuous color gradient. Featuring dual-timeframe support for macro context analysis, dynamic bisection channels, an embedded normalized mini-chart, and an interact

3 Charts. 1 Screen. Only $30. Stop switching between Monthly, Weekly, Daily, H4, H1 and other charts just to see the bigger picture. Triple Mini Charts for MT5 puts 3 independent mini charts directly on your trading screen. Different timeframes
Different symbols
Optional MA200
Individual zoom controls
Show/hide prices and dates
Collapse charts when not needed
Remembers selected timeframes Perfect for multi-timeframe analysis and traders who want a cleaner, faster MT5 workflow. Only
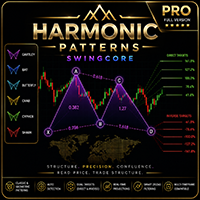
Harmonic Patterns SwingCore Pro | For MetaTrader 5 (MT5)
Technical analysis indicator for detecting and visualizing harmonic patterns on the chart, with Fibonacci level projection and configurable alert system.
================================================================================
WHAT THIS INDICATOR IS
It is a visual analysis tool. Its function is to identify structures on the chart that satisfy the geometric relationships of six classic harmonic patterns: Gartley, Bat, Butterfly

MA Distance Reversion Zones(移動平均乖離リバーサルゾーン) MetaTrader 5用の平均回帰インジケーター — あらゆる銘柄・あらゆる時間足で使用可能です。 このインジケーターは、価格が移動平均線からどれだけ乖離しているかをローソク足ごとに測定し、その乖離幅を統計的に計算(zスコア)することで、値動きが勢いを失うゾーン — 価格が平均へ回帰しやすい領域を特定します。これにより、市場の天井と底を見つけるのに役立ち、勢いが弱まり反転が起こりやすいポイントを示します。 主な機能: カスタマイズ可能な移動平均線 — 期間、計算方法(SMA、EMA、SMMA、LWMA)、適用価格を選択可能。 動的な極値バンド — 乖離幅の標準偏差から算出され、銘柄のボラティリティに自動的に適応します。特定の市場でしか機能しない固定バンドではありません。 ローソク足ごとの乖離マーキング — 各バーにカラーマーカー(通常 / 拡大 / 極端)が表示され、価格がどれだけ伸びているかをリアルタイムで視覚的に確認できます。 天井・底の検出 — 価格が極値(天井ま

AQUA は、6つの時間足において3本のローソク足の型が現れたあとの値動きの統計を示す分析用インジケーターです。 目的 AQUA は短いローソク足の並びがどれだけ繰り返されるかを調べ、過去に似た状況が統計的にどう終わったかを示します。その役割は、特定の3本の形に対して銘柄がどう反応してきたかという客観的な統計像を提供することであり、売買の判断は利用者に委ねられます。 新しい足ができるたびに、インジケーターは確定した直近3本を48種の型のいずれかに符号化し、それを6つの時間足で並行して行い、各時間足で最大数千本の履歴を走査し、同一の並びをすべて見つけ、その結果の分布を計算し、統計的な有意性を評価して描画を更新します。同じ作業を手で行えば——履歴をさかのぼり、似た形に印をつけ、結果の割合を数え、時間足ごとに有意性を判断する——何時間もかかり、数え間違いも起こります。AQUA はこれを一瞬で行い、足ごとに繰り返します。 現在の型はチャート上で枠に囲まれ、見つかった過去の一致も履歴全体にわたって個別に枠が付きます。これにより、任意の一致箇所へ移動し、それが現れた状況を確かめられます。 方法 型

NeckLine Sentinel — AI-Scored Multi-Timeframe Head & Shoulders Scanner NeckLine Sentinel is a professional-grade pattern recognition engine built for traders who rely on classic chart formations but are tired of manually scanning charts for hours. Instead of watching one timeframe at a time, NeckLine Sentinel simultaneously monitors M15, M30, H1, H4, and D1 for both Head & Shoulders (bearish reversal) and Inverse Head & Shoulders (bullish reversal) patterns — and does it with a scoring system th

Cumulative Volume Delta Divergence
Cumulative Volume Delta Divergence is a volume-pressure analysis indicator for MetaTrader 5.
It combines estimated cumulative volume delta with regular and hidden divergence detection, higher-timeframe context, absorption analysis, exhaustion zones, configurable signal scoring, alerts, and historical target/stop outcome tracking.
The indicator is designed to help traders identify situations where price structure and estimated volume pressure are behaving di

Master-level overview of the UltraAlgo Multiple Confirmation (MC) Sniper Entry Pro Indicator, designed to be a comprehensive guide for traders seeking to dominate the markets.
The Architecture of Precision: Deconstructing the UltraAlgo MC Sniper Entry Pro The UltraAlgo Multiple Confirmation (MC) Sniper Entry Pro is not merely an indicator; it is a sophisticated, multi-layered trading ecosystem. It represents the pinnacle of confluence-based trading, moving far beyond the simplicity of a single

TriStrike Vanguard — Professional Three Line Strike Reversal Detector for MT5 Most reversal indicators flood your chart with false signals. TriStrike Vanguard was built to do the opposite: find the rare, high-conviction Three Line Strike formation — a proven four-candle reversal pattern institutional traders watch for — and confirm it through multiple layers of validation before it ever alerts you. What is the Three Line Strike pattern?
It's a four-candle reversal setup: three consecutive candl

価格がトレンド中か、ただのノイズかを、0から1の1本のラインで一目で確認できます。No repaint.
どの通貨ペアでも、どの時間足でも。2分でチャートに表示。Strategy Testerで無料デモを試せます。
Get more indicators here
Baselines, volatility filters and oscillators. No repaint.
必要な理由 チャートできれいな動きを見つけてエントリーします。数本後に価格は止まり、横に流れ、損切りになります。トレンドに見えた動きは、実際は往復が大半でした。方向だけでは、価格の動きのうちどれだけが本当の前進だったかは分かりません。 ノイズの中でのエントリーは、避けられたはずの損切りにつながります。 得られるもの Fabii Kaufman Efficiency Ratio は、直近の価格の動きのうち直線的だった割合を示し、ノイズをトレンドと見間違えないようにします。 どの通貨ペア、どの時間足でも0から1の値で表示されるので、すべての市場を同じ基準で判断できます。 3色のゾーン表示です。0.30未満は

システム初期化シーケンス... 市場構造スキャナー... OK
三角形とウェッジ... OK
フラッグとペナント... OK
チャネルとレンジ... OK
ダブル/トリプルトップ・ボトム... OK
ブレイクアウト確認フィルター... OK
ENTRY / TP / SL 計算... OK
インタラクティブ情報パネル... OK
ステータス: 展開準備完了。 「オペレーター、こんにちは。私は GC Figures です。 ゴールドのチャートパターンを検出し、ブレイクアウトを確認し、計算されたエントリー、利確、損切り水準を提供します。」 インジケーターの仕組み GC Figures は、M15およびM30のXAUUSD分析用に開発されたMetaTrader 5向けチャートパターンインジケーターです。 確定した高値と安値を分析し、パターンの形状と形成状態を評価し、有効なブレイクアウトを待ちます。 このインジケーターは注文の発注、決済、管理を行いません。最終的な取引判断は常にトレーダー自身が行います。 対応チャートパターン 対称・上昇・下降三角形; 強気の下降ウェッジと弱気の

Momentum Alchemist — Dual-Engine Confluence Indicator Two independent detection systems. One confirmed signal. Momentum Alchemist fuses two complementary engines into a single, non-repainting confluence tool for MetaTrader 5: Force Trend System — a pressure/trend-state engine built on a volume-weighted moving structure and an ATR-based Supertrend filter. It reacts fast to shifts in buying and selling pressure. Pattern Recognition Engine — a historical pattern-matching module that scans thousands

CONFLUENCE AND PROBABILITY INDICATOR Volume • Fibonacci • Pullback • Technical Analysis This indicator was developed with an approach focused on identifying areas of interest in the market , combining different concepts widely used in technical analysis and trading studies. Its purpose is to assist traders in interpreting price behavior through the confluence of information , allowing each user to integrate the indicator into their own analysis system and personal strategies. KEY CONCEPTS ANALYZ

Half Trend Signal filters out minor market noise to deliver definitive, non-repainting long and short entry signals based on asset volatility and structural swing pivots. Instead of displaying standard lag-heavy moving averages, this system uses an adaptive directional engine to lock onto clean trend lines and overlay automatic risk-management matrices directly onto your chart. How It Works Trading Long Breakouts: When the system transitions from a bearish regime into a bullish regime, a Green
MetaTraderマーケットは自動売買ロボットとテクニカル指標を販売するための最もいい場所です。
魅力的なデザインと説明を備えたMetaTraderプラットフォーム用アプリを開発するだけでいいのです。マーケットでプロダクトをパブリッシュして何百万ものMetaTraderユーザーに提供する方法をご覧ください。

取引の機会を逃しています。
- 無料取引アプリ
- 8千を超えるシグナルをコピー
- 金融ニュースで金融マーケットを探索