 MetaTrader 5
 Experts
 지표
지표
 라이브러리
라이브러리
 유틸리티
유틸리티
 위젯
위젯
 규칙
규칙
MetaTrader 5용 기술 지표 - 200
 기술 지표의 시그널은 주식 및 외환 시장에서 거래를 개시 및 종료하는 데 중요한 역할을 합니다. 지표의 본질은 미래의 가격 변화를 예측하기 위한 금융 시그널 값의 수학적 변형입니다.
기술 지표를 테스트하여 시장 행동과 그로 인한 이익을 더 잘 예측할 수 있습니다.
기술 지표의 시그널은 주식 및 외환 시장에서 거래를 개시 및 종료하는 데 중요한 역할을 합니다. 지표의 본질은 미래의 가격 변화를 예측하기 위한 금융 시그널 값의 수학적 변형입니다.
기술 지표를 테스트하여 시장 행동과 그로 인한 이익을 더 잘 예측할 수 있습니다. 
WHAT IS PRIME ZONES? Prime Zones is a professional market structure indicator designed to automatically identify key Support and Resistance Zones , monitor how price interacts with them, and provide additional trend context through a Dual Regression Channel system . Instead of filling the chart with dozens of horizontal lines, Prime Zones displays clean and visually defined price areas where the market has previously shown meaningful reactions. The indicator combines four main concepts in a sing

Substantial Arrows — 방향을 보고, 모멘텀을 읽고, 신호에 집중하세요. Substantial Arrows 는 시장 방향과 잠재적인 거래 기회를 보다 깔끔하고 구조적으로 확인하고 싶은 트레이더를 위한 MetaTrader 5 전문 지표입니다. 멀티 타임프레임 Market Trend, Trend Candles, 적응형 Arrow Signals 를 하나의 차트 환경에 통합합니다. Multi-Timeframe Market Trend 지원 시간대: MN1 • W1 • D1 • H4 • H1 • M30 • M15 • M5 • M1 각 시간대는 다음과 같이 표시됩니다: BUY • SELL • NEUTRAL Trend Candles Trend Candles는 상승 및 하락 시장 상태를 시각적으로 구분합니다. 표시를 끄더라도 다른 기능에는 영향을 주지 않습니다. Main Arrows 조건이 확인되면 BUY / SELL 화살표가 차트에 표시됩니다. 신호는 마감된 캔들 확인 을 기반으로

GoldScalp Signal Pro GoldScalp Signal Pro is a technical trading indicator designed primarily for XAUUSD (Gold). It combines EMA trend analysis, RSI momentum confirmation, and ADX trend-strength filtering to help traders identify potential BUY and SELL opportunities. Key Features - BUY and SELL signals displayed directly on the chart - EMA 10 / EMA 20 trend filter - RSI momentum confirmation - ADX trend-strength filter - Fully customizable indicator parameters - Designed primarily for XAUUSD - S

'KS Master Tool 12 in 1 Trade with Me'는 여러 가지 트레이딩 도구를 하나의 차트 창 오버레이로 통합한 단일 파일 형태의 MetaTrader 5(MT5)용 사용자 정의 지표입니다.
이 지표는 마스터 스위치를 통해 각 모듈을 완전히 활성화하거나 비활성화할 수 있도록 설계되었습니다. 모듈이 비활성화되면 해당 모듈의 계산, 그래픽 그리기, 타이머 및 차트 이벤트 처리 과정이 완전히 생략되므로, 비활성화된 모듈로 인한 추가 CPU 사용량은 발생하지 않습니다. 모듈 기능
SMC / 피보나치 / 구조 돌파(Structure Break) / FVG / CPR / IB (SMC 기반 차트 패턴)
Fair Value Gap (FVG): 라벨 표시 여부, 완화(mitigation) 구간 축소, 이력 표시 제한 설정 가능
구조 돌파 (BOS / CHoCH): 이력 표시, 현재 구조 강조, 몸통 또는 꼬리 기준 돌파 옵션
피보나치 레벨 (5개 레벨 설정 및 표시/숨

LiquidityLabs FVG Pro is a multi-timeframe Fair Value Gap and liquidity-based trade setup indicator for MetaTrader 5, designed to identify higher-quality directional opportunities and display a complete trade plan directly on the chart. The indicator analyzes market structure, liquidity behavior, Fair Value Gaps and lower-timeframe confirmation to locate potential entries while maintaining the larger market context. Once a valid setup is confirmed, the indicator displays the entry level together

MT5용 Crypto_Forex 지표 "재테스트 히스토그램", 리페인트 없음. - ReTest_Histogram 지표는 강력한 지지선/반지선(S/R) 재테스트 후 주요 추세 방향으로 진입 신호를 찾는 데 사용할 수 있습니다. - ReTest 히스토그램은 두 가지 색상으로 제공됩니다. 빨간색은 하락 추세, 녹색은 상승 추세입니다. - 동일한 색상의 히스토그램 열이 일정하게 연속적으로 나타나면 새로운 추세가 시작되었음을 의미합니다. - ReTest 신호는 히스토그램에서 반대 색상의 열 하나와 추세 색상의 다음 열 하나(그림 참조)입니다. - 지표에는 모바일 및 PC 알림 기능이 내장되어 있습니다. 지표 사용 방법: - 매수 신호의 경우: 일정하게 연속된 녹색 히스토그램(상승 추세) + 빨간색 열 하나(재테스트) + 녹색 열 하나(매수 포지션 개시). - 매도 신호: 안정적인 연속 빨간색 히스토그램(하락 추세) + 히스토그램의 녹색 열 1개(재테스트) + 빨간색 열 1개(공매도 포지션)

Angle Iindicator MT5 - 은 방향 전환 및 추세 확인을 위한 지표입니다.
가격 움직임을 분석하여 차트에서 고점과 저점을 식별하고 반전 지점을 찾아냅니다.
추세 방향을 지원합니다.
모든 금융 상품 및 시간대에 사용 가능합니다.
내부 매개변수는 이미 설정되어 있으므로 차트에 지표를 배치하고 원하는 결과에 따라 "Multiplier" 매개변수를 설정하기만 하면 됩니다.
이 지표는 현재 캔들스틱에 화살표를 생성합니다. 캔들스틱이 형성되는 동안 화살표가 깜빡일 수 있습니다. 캔들스틱이 마감되면 화살표는 이전 차트에 다시 그려지지 않습니다.
방향 전환에 대한 알림이 제공됩니다.
단독으로 사용하거나 거래 시스템과 함께 사용할 수 있습니다.
지표를 올바르게 사용하려면 "Multiplier" 매개변수를 설정해야 합니다.
지표의 결과는 차트에서 반전 각도가 생성되는 방식에 따라 달라집니다.
"Multiplier" 매개변수는 연속된 캔들스틱을 구조화하여 반전 지점의 빈도를

Separated tick volume moving averages:
This tool makes it is easier to track the volume behind the moves. It will separate tick volume into bullish and bearish volumes with two separate moving averages. Tracking volume versus price in an easy way is now accessable to any trader. It will put you on track with the market makers and those who move the price. Volume is not the only thing which moves the price but its an important factor behind it. Hence it has a predictive power.
How tick volume w

Sniper Channels Base 는 MetaTrader 5를 위해 개발된 고정밀 적응형 추세 추종 지표입니다. 동적 채널과 평활화된 평균선을 계산하여 추세 전환을 정확히 포착하고 차트에 높은 확률의 매수/매도 화살표 신호를 표시합니다. 스캘핑, 데이 트레이딩, 스윙 트레이딩 등 어떤 스타일에서도 Sniper Channels Base 는 시장 노이즈를 제거하고 지연 없는 명확한 방향성 시각적 신호를 제공합니다. 주요 기능: 적응형 추세 감지: 색상이 변하는 평균선으로 상승(Aqua) 및 하락(Red) 모멘텀을 직관적으로 확인. 정밀한 매수/매도 화살표: 추세 전환 시 ATR 기반의 동적 간격으로 화살표 신호 자동 생성. 상/하단 채널선 온/오프: 트레이딩 템플릿에 따라 상단 및 하단 채널선 표시 여부를 자유롭게 선택. 다양한 알림 지원: 팝업 알림, 사운드, 이메일 및 모바일 푸시(Push) 알림을 지원하여 매매 기회를 놓치지 않음. 유연한 가격 설정: 종가(Close), 시가(

GTI Buy/Sell v2 PRO Two SuperTrends. Six filters. Three signal grades. One clean chart. Most arrow indicators show you a signal and leave you guessing how much it is worth. GTI Buy/Sell v2 PRO scores every single signal from 0 to 5, sorts it into three quality grades, and then draws the complete trade plan — entry, stop loss and up to three targets — directly on your chart. You stop asking "should I take this one?" and start reading how much confirmation is actually behind it. THE SIGNAL ENGINE

IQAlgo Pro MT5 Indicator - Comprehensive Overview
Introduction
IQAlgo Pro is a revolutionary all-in-one trading indicator that consolidates seven powerful analytical systems into a single, cohesive tool. Designed for serious traders who demand institutional-grade analysis, this indicator transforms your MetaTrader 5 chart into a complete trading command center. Rather than juggling multiple indicators and trying to reconcile conflicting signals, IQAlgo Pro presents a unified view of market st

Wave X Pro AI Agents Indicator Wave X Pro is a signal-analysis indicator developed for MetaTrader 5 and designed for short-duration binary trading workflows. It operates on the M1 chart and presents directional signals with a five-minute evaluation period. The indicator combines several specialized analytical modules in one coordinated workflow. Each module examines a different aspect of price behavior before the system presents its final signal. Wave X Pro is an analytical tool. It does not exe

Stop Trading Blind. The Ultimate Confluence System is Here. Are you tired of repainting indicators that look great in history but destroy your live account? Yeah, I've been there. The market—especially aggressive beasts like XAUUSD—doesn't care about your feelings. It only respects cold, hard data.
That's exactly why SmartConfluenceDashboardPro was created. This isn't just another flashy retail tool; it's a complete, all-in-one institutional-grade trading ecosystem built strictly for MetaTrade

아시아 레인지는 누구나 그립니다. Session Liquidity Sweep Stats는 그 레벨에 보통 무슨 일이 일어나는지 를 알려줍니다. 각 세션의 고점과 저점은 세션이 끝나는 순간부터 추적되며, 모든 접촉은 직접 고정한 판정 시간대에서 세 가지 답 중 하나로 결론이 납니다. 레벨이 스윕(swept) 되어 가격이 반전했는가, 돌파(broken) 되어 가격이 계속 갔는가, 아니면 닿기만 하고 그날 안에 아무것도 정해지지 않았는가. 동작 아시아 세션이 마감되면 그 고점과 저점이 차트에 그려집니다. 런던이 마감되면 런던의 고저가 추가됩니다. 이후 각 레벨을 봉 단위로 감시하며, 가격이 닿는 순간 질문이 열립니다. 버틸 것인가, 뚫릴 것인가. 닿은 봉에서 두 개의 기준을 잡고 서로 경쟁시킵니다. 그 봉의 꼬리 끝 을 종가로 넘으면 돌파 — 움직임이 이어진 것입니다. 닿기 직전 마지막 반대 봉의 시가 를 종가로 되돌리면 스윕 — 유동성이 취해지고 가격이 반전한 것입니다. 먼저 결론난 쪽

15개 종목, 3개 시간대, 하나의 그리드. 초록은 그 페어에서 CRT 롱 셋업이 방금 완성되었다는 뜻이고, 빨강은 숏입니다. 셀을 클릭하면 그 종목·그 시간대의 차트로 전환됩니다. 신호가 왜 나오는가 조건은 엄격하고 봉 두 개로 끝납니다. 첫 봉이 레인지를 정의합니다. 둘째 봉이 그 레인지의 한쪽 — 롱이면 저점, 숏이면 고점 — 을 가져간 뒤 다시 레인지 안에서 종가를 만듭니다 . 그 너머에 있던 유동성은 취해졌고, 가격은 거기 머무르기를 거부했습니다. 레인지의 반대편 극단은 아직 소비되지 않았고, 셋업이 가리키는 곳이 바로 거기입니다. 규칙은 이것이 전부입니다. 이동평균도, 오실레이터도, 맞춰 넣은 것도 없습니다. 규칙이 이렇게 좁기 때문에, 켜진 셀을 열어 직접 눈으로 확인할 수 있습니다. 무엇을 얻는가 몇 초마다 모든 종목·시간대 조합의 최근 두 개 종료 봉을 다시 판정하고 그리드를 갱신합니다. 초록 BUY, 빨강 SELL, 아니면 조용한 대시. 새로운 신호마다 알림이 한

FAVERO RETURN SYSTEM Reversal Probability System The system was developed to identify market regions where price shows signs of potential exhaustion , combining overbought and oversold conditions with support and resistance levels from higher timeframes . The objective is not to claim that a reversal will necessarily occur, but rather to identify areas where the probability of a change in market direction may be increasing . How It Works The indicator primarily analyzes the following timefra

LiquidityLabs FVG Pro Intraday LiquidityLabs FVG Pro Intraday is a professional Fair Value Gap and liquidity-analysis indicator designed for shorter-duration intraday opportunities. The indicator continuously analyzes market structure, liquidity behavior, directional conditions and Fair Value Gap activity to identify potential intraday setups and display a complete trade plan directly on the MetaTrader 5 chart. Rather than simply marking every Fair Value Gap, LiquidityLabs FVG Pro Intraday filte

Gold Power G.P — Read Gold Price Action with Clarity Gold Power G.P is a specialized indicator designed exclusively for XAU (Gold) , providing a clear and dynamic visual representation of market movement and helping you understand changes in momentum and price behavior without overwhelming your chart with unnecessary complexity. The indicator displays market movement in a dedicated window with an intuitive visual presentation, allowing you to choose the display style that best suits your analys

LuoMo Volume & Price Structure 8.98 A multi-function chart indicator for MetaTrader 4 and MetaTrader 5 , designed to display key volume, volatility, sentiment, and price-structure information directly on the main chart. Main Features Volume and price-based Support & Resistance Volume spike and exhaustion signals ATR volatility expansion alerts Volume Profile with HVN and LVN Bullish and bearish sentiment distribution Developing or fixed POC VAH and VAL levels Supply and Demand zones Volume-wei

Sniper Channels MTF 는 MetaTrader 5를 위한 고급 멀티 타임프레임 추세 채널 지표입니다. 상위 타임프레임(HTF)의 동적 지지/저항 채널 및 추세 전환을 계산하여 지연이나 리페인트(Repaint) 없이 현재 차트에 직접 표시합니다. 외환, 주가지수, 원자재, 암호화폐의 스캘핑, 데이트레이딩, 스윙트레이딩 등 어떤 매매 스타일이든 Sniper Channels MTF 를 활용하면 상위 타임프레임의 추세 방향과 반전 구역을 빠르게 파악할 수 있습니다. 주요 기능 멀티 타임프레임 엔진: 창을 전환하지 않고도 M5, M15, M30 차트에서 H1, H4 또는 일봉 채널을 바로 확인. 색상 변환 추세선: 추세 기울기 확인 시 중심선 색상이 즉시 변경 (연두색 = 상승 / 마젠타 = 하강). 다이아몬드 진입 신호: 차트 상의 다이아몬드 아이콘이 상위 타임프레임의 추세 전환 지점을 실시간으로 표시. BUY / SELL 텍스트 라벨: 신호 지점에 진입 방향을 명확하게 텍스트

Support Resistance 90 Support Resistance 90 draws clean pivot-based support and resistance bands and adds a trend layer on top: once price breaks a level, only the side that matters stays on the chart. Break above resistance and the support band leads the move; break below support and the resistance band takes over. The result is a chart that shows one clear side at a time instead of a screen full of crossing lines. A built-in dashboard tracks how the signals would have performed — last result,

Sniper Channels Base with MTF 는 MetaTrader 5를 위한 올인원 고급 추세 채널 지표입니다. 현재 타임프레임의 채널 움직임과 상위 타임프레임(HTF)의 추세 필터링 및 멀티 타임프레임 신호 생성을 하나로 결합하여 지연이나 리페인트(Repaint) 없이 차트에 직접 표시합니다. 외환, 주가지수, 원자재, 암호화폐 거래를 위해 개발된 Sniper Channels Base with MTF 는 하위 타임프레임의 진입 신호를 상위 타임프레임의 추세 방향과 일치시켜 승률을 높이고 손실 위험을 줄여줍니다. 주요 기능 듀얼 채널 엔진: 하나의 차트에서 현재 타임프레임 채널과 상위 타임프레임(HTF) 채널을 동시에 계산 및 표시. MTF 추세 필터링: 상위 타임프레임 추세에 반하는 하위 타임프레임의 저확률 신호를 자동 차단. 동적 색상 추세선: 추세 확정 시 중심선 색상이 즉시 변경 (청록/연두 = 상승 추세, 빨강/마젠타 = 하강 추세). 신호 화살표 및 MTF 다이

Indicator Description Opportunity Identification Indicator — Smart Money This indicator was developed to assist in identifying moments when prices may be reaching areas of greater interest , seeking possible signals in market behavior associated with the concept of “smart money” (Smart Money) , widely discussed in financial literature and market studies. The proposal is to create a bridge between technical analysis and fundamental analysis . The indicator uses technical analysis and price behavi

SMC Ultimate Pro Suite — MT5용 스마트 머니 컨셉(SMC) 8-in-1 인디케이터
하나의 강력한 인디케이터에서 8개의 완전한 트레이딩 시스템을 만나보세요. 비용을 절약하고 차트를 깔끔하게 유지하세요. XAUUSD(골드) 및 외환에 최적화. 리페인트 없음 — 모든 신호는 마감된 캔들에서만 확인됩니다.
제공 기능:
1) 스마트 머니 컨셉 — 어드밴스
• 스윙 피벗 기반 수요/공급 영역, ATR 기반 너비, 중앙 SUPPLY/DEMAND 텍스트 + POI 중앙선, 중복 거부(ATR × 2), 5개 영역 링 히스토리
• 레벨 돌파 시 영역 → BOS 라인 자동 전환
• 시장 구조: BoS / CHoCH / I-BoS / I-CHoCH(점선 + 라벨, 내부 3-5-8 / 외부 10-25-50)
• FVG(Fair Value Gap) — closeOnly 모드(가장 가까운 FVG만 색상), 수축 및 돌파 처리
• 롤링 4H/1D 고가·저

The Ghost Face Indicator is a trend-following technical indicator that combines the filtering principles of Tower (TOWER) lines and Heikin-Ashi. By dynamically changing bar colors ("changing face") based on price breakouts relative to recent key highs and lows, it effectively filters out intraday noise, helping traders capture major uptrends and downtrends.
Core Logic & Mechanism
Dynamic Color Switching : Instead of relying on a single candle's open and close prices, it compares price extreme

PROMO-SALE RUNNING
Pre-Wick Retrace Indicator for MT5 Pre-Wick is a Meta Trader 5 price-action indicator designed to help traders identify potential retracement setups before price reaches the proposed entry area. The indicator analyzes price movement, wick rejection, market structure and trend conditions to identify potential setup areas on the chart. When a setup is confirmed on a closed candle, Pre-Wick can display: Entry Zone
Limit Entry
Stop Loss
Take Profit This allows traders to plan

Stryker Levels — Precision Daily Breakout Detection with Live TP/SL Projection Every institutional trading desk watches the same two numbers each session: yesterday's high and yesterday's low. These levels are where liquidity pools, where stop hunts happen, and where the highest-probability breakout and reversal setups form. Stryker Levels turns this concept into a fully automated, non-repainting detection engine that works silently in the background so you never miss the moment price commits to

# SessionLevels PRO MT5 – Smart Session High & Low Indicator
## Professional Trading Sessions Indicator for MetaTrader 5
SessionLevels PRO is a powerful MT5 indicator designed to automatically plot the most important trading session levels directly on your chart.
Perfect for Smart Money Concepts (SMC), ICT traders, price action traders, and anyone who relies on institutional market structure.
### Features
Asia Session High & Low
London Session High & Low
New York Session High & Low
Turn market slope into your greatest trading advantage! Tired of lagging and subjective indicators? AngleMeter Pro is here to revolutionize your chart analysis in MetaTrader 5. Powered by advanced trigonometry and statistical linear regression, it measures the exact trend angle in real time using a striking visual protractor with a continuous color gradient. Featuring dual-timeframe support for macro context analysis, dynamic bisection channels, an embedded normalized mini-chart, and an interact

3 Charts. 1 Screen. Only $30. Stop switching between Monthly, Weekly, Daily, H4, H1 and other charts just to see the bigger picture. Triple Mini Charts for MT5 puts 3 independent mini charts directly on your trading screen. Different timeframes
Different symbols
Optional MA200
Individual zoom controls
Show/hide prices and dates
Collapse charts when not needed
Remembers selected timeframes Perfect for multi-timeframe analysis and traders who want a cleaner, faster MT5 workflow. Only
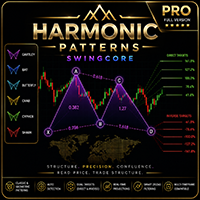
Harmonic Patterns SwingCore Pro | For MetaTrader 5 (MT5)
Technical analysis indicator for detecting and visualizing harmonic patterns on the chart, with Fibonacci level projection and configurable alert system.
================================================================================
WHAT THIS INDICATOR IS
It is a visual analysis tool. Its function is to identify structures on the chart that satisfy the geometric relationships of six classic harmonic patterns: Gartley, Bat, Butterfly

MA Distance Reversion Zones MetaTrader 5용 평균 회귀 지표 — 모든 종목, 모든 시간대에서 사용 가능합니다. 이 지표는 매 캔들마다 가격이 이동평균선에서 얼마나 멀어졌는지를 측정하고, 이 거리를 통계적으로 계산(Z-점수)하여 움직임이 소진되는 구간 — 즉 가격이 평균으로 되돌아가는 경향이 있는 구간을 찾아냅니다. 이를 통해 시장의 고점과 저점을 찾는 데 도움을 주며, 모멘텀이 약해져 반전 가능성이 높아지는 지점을 표시합니다. 주요 기능: 설정 가능한 이동평균선 — 기간, 계산 방식(SMA, EMA, SMMA, LWMA), 적용 가격을 선택할 수 있습니다. 동적 극단 밴드 — 거리의 표준편차를 기반으로 계산되어 해당 종목의 변동성에 자동으로 맞춰집니다. 특정 시장에서만 작동하는 고정 밴드가 아닙니다. 캔들별 거리 표시 — 각 봉마다 색상 마커(정상 / 확장 / 극단)가 표시되어, 가격이 얼마나 늘어났는지 실시간으로 시각적으로 확인할 수

AQUA 는 여섯 개 시간대에서 세 개 캔들 패턴이 나온 뒤의 가격 움직임 통계를 보여주는 분석 지표입니다. 목적 AQUA는 짧은 캔들 배열이 얼마나 자주 반복되는지 살피고, 과거에 비슷한 상황이 통계적으로 어떻게 끝났는지 보여줍니다. 그 역할은 특정한 세 캔들 형태에 종목이 어떻게 반응해 왔는지를 객관적인 통계로 제시하는 것이며, 매매 결정은 사용자의 몫으로 남습니다. 새 캔들이 생길 때마다 지표는 마지막으로 마감된 세 캔들을 48개 패턴 중 하나로 부호화하고, 이를 여섯 시간대에서 동시에 수행하며, 각 시간대에서 수천 봉에 이르는 과거를 훑어 동일한 배열을 모두 찾고, 그 결과의 분포를 계산하고, 통계적 유의성을 평가한 뒤 화면을 다시 그립니다. 같은 일을 손으로 하려면 — 과거를 되짚고, 비슷한 형태를 표시하고, 결과 비율을 세고, 시간대마다 유의성을 판단하려면 — 몇 시간이 걸리고 계산 실수도 생깁니다. AQUA는 이를 순식간에 끝내고 캔들마다 되풀이합니다. 현재 패턴은 차트

NeckLine Sentinel — AI-Scored Multi-Timeframe Head & Shoulders Scanner NeckLine Sentinel is a professional-grade pattern recognition engine built for traders who rely on classic chart formations but are tired of manually scanning charts for hours. Instead of watching one timeframe at a time, NeckLine Sentinel simultaneously monitors M15, M30, H1, H4, and D1 for both Head & Shoulders (bearish reversal) and Inverse Head & Shoulders (bullish reversal) patterns — and does it with a scoring system th

Cumulative Volume Delta Divergence
Cumulative Volume Delta Divergence is a volume-pressure analysis indicator for MetaTrader 5.
It combines estimated cumulative volume delta with regular and hidden divergence detection, higher-timeframe context, absorption analysis, exhaustion zones, configurable signal scoring, alerts, and historical target/stop outcome tracking.
The indicator is designed to help traders identify situations where price structure and estimated volume pressure are behaving di

Master-level overview of the UltraAlgo Multiple Confirmation (MC) Sniper Entry Pro Indicator, designed to be a comprehensive guide for traders seeking to dominate the markets.
The Architecture of Precision: Deconstructing the UltraAlgo MC Sniper Entry Pro The UltraAlgo Multiple Confirmation (MC) Sniper Entry Pro is not merely an indicator; it is a sophisticated, multi-layered trading ecosystem. It represents the pinnacle of confluence-based trading, moving far beyond the simplicity of a single

TriStrike Vanguard — Professional Three Line Strike Reversal Detector for MT5 Most reversal indicators flood your chart with false signals. TriStrike Vanguard was built to do the opposite: find the rare, high-conviction Three Line Strike formation — a proven four-candle reversal pattern institutional traders watch for — and confirm it through multiple layers of validation before it ever alerts you. What is the Three Line Strike pattern?
It's a four-candle reversal setup: three consecutive candl

SMC Pro Chart Clear Structure. Key Zones. Your Chart, Your Way. Smart Money Concepts analysis for MetaTrader 5. Bring market structure and key price areas together in one organized workspace. SMC Pro Chart combines automated analytical drawings with flexible visual controls, helping you examine price action through a clear, personalized chart layout. Market Structure at a Glance Follow Break of Structure ( BOS ) and Change of Character ( CHoCH ) directly on the chart. Distinguish bullish and bea

가격이 추세인지 단순한 노이즈인지 0에서 1 사이의 선 하나로 한눈에 확인하세요. No repaint.
모든 통화쌍, 모든 타임프레임. 2분이면 차트에 적용됩니다. Strategy Tester에서 무료 데모를 사용할 수 있습니다.
Get more indicators here
Baselines, volatility filters and oscillators. No repaint.
필요한 이유 차트에서 깔끔한 움직임을 보고 진입합니다. 몇 개의 봉이 지나면 가격이 멈추고 옆으로 흐르다 손절이 됩니다. 추세처럼 보였던 움직임은 대부분 오르내림이었습니다. 방향만으로는 가격 이동 중 얼마만큼이 실제 전진이었는지 알 수 없습니다. 노이즈 속에서 진입할 때마다 피할 수 있었던 손절이 생깁니다. 제공되는 기능 Fabii Kaufman Efficiency Ratio는 최근 가격 이동 중 직선에 가까운 움직임의 비율을 보여 주어 노이즈를 추세로 착각하지 않게 해 줍니다. 모든 통화쌍과 타임프레임

시스템 초기화 시퀀스... 시장 구조 스캐너... 정상
삼각형 및 쐐기형... 정상
깃발형 및 페넌트형... 정상
채널 및 박스권... 정상
이중/삼중 천장 및 바닥... 정상
돌파 확인 필터... 정상
ENTRY / TP / SL 계산... 정상
대화형 정보 패널... 정상
상태: 배포 준비 완료. “환영합니다, 오퍼레이터. 저는 GC Figures입니다. 골드 차트에서 패턴을 탐지하고 돌파를 확인하며 계산된 진입가, 익절가 및 손절가를 제공합니다.” 작동 원리 GC Figures는 M15 및 M30의 XAUUSD 분석을 위해 개발된 MetaTrader 5용 차트 패턴 인디케이터입니다. 확정된 고점과 저점을 분석하고 패턴의 기하학적 구조와 형성 상태를 평가한 뒤 유효한 돌파를 기다립니다. 인디케이터는 거래를 개시, 종료 또는 관리하지 않습니다. 최종 거래 결정은 항상 트레이더에게 있습니다. 지원 패턴 대칭, 상승 및 하락 삼각형; 강세 하락 쐐기형 및 약세 상승 쐐기

Momentum Alchemist — Dual-Engine Confluence Indicator Two independent detection systems. One confirmed signal. Momentum Alchemist fuses two complementary engines into a single, non-repainting confluence tool for MetaTrader 5: Force Trend System — a pressure/trend-state engine built on a volume-weighted moving structure and an ATR-based Supertrend filter. It reacts fast to shifts in buying and selling pressure. Pattern Recognition Engine — a historical pattern-matching module that scans thousands

CONFLUENCE AND PROBABILITY INDICATOR Volume • Fibonacci • Pullback • Technical Analysis This indicator was developed with an approach focused on identifying areas of interest in the market , combining different concepts widely used in technical analysis and trading studies. Its purpose is to assist traders in interpreting price behavior through the confluence of information , allowing each user to integrate the indicator into their own analysis system and personal strategies. KEY CONCEPTS ANALYZ

Half Trend Signal filters out minor market noise to deliver definitive, non-repainting long and short entry signals based on asset volatility and structural swing pivots. Instead of displaying standard lag-heavy moving averages, this system uses an adaptive directional engine to lock onto clean trend lines and overlay automatic risk-management matrices directly onto your chart. How It Works Trading Long Breakouts: When the system transitions from a bearish regime into a bullish regime, a Green

FluidTrades SMC — Liquidity Sweeps, Structure & Multi-Timeframe Trend in One Preset Sixteen Smart Money tools in one indicator — and a preset switch so you only ever see the three or four that matter for the trade in front of you. Most "all-in-one" indicators fail the same way: they turn everything on at once and hand you a chart you cannot read. FluidTrades SMC ships the full toolkit, but it opens on a Signal preset that draws only what you act on — structure, swings, the liquidity sweep, t

제품명: Breakthrough Tracker 트레이딩 시스템 핵심 포지셔닝 본 시스템은 수년간의 실전 트레이딩 경험을 바탕으로, 다양한 시장 환경에서 지속적으로 개선하고 최적화한 결과물입니다. 근본적인 목적은 방향성이 없는 횡보장에서 잦은 진입으로 인해 계좌가 잠식되는 만성적 문제점을 과감히 제거하는 데 있습니다. 핵심 로직은 한 문장으로 요약됩니다. 오직 돌파(breakout)에서만 매매하고, 절대 횡보(consolidation) 구간에는 참여하지 않는다. 복잡한 기술적 지표의 중첩을 배제하고, 의사 결정 과정을 간결하고 규칙 기반이며 반복 가능한 프레임워크로 압축하여, 어떤 시장 환경에서도 명확한 트레이딩 시각을 유지할 수 있도록 설계되었습니다. 적합 상품 및 시간대 본 시스템은 현물 금(XAUUSD) 및 주요 외환 통화쌍(EURUSD, GBPUSD, USDJPY 등)에 깊이 최적화되어 있으며, 여러 시간대에서도 호환됩니다. 단기 당일 매매(단타) 트레이더라면

Auto Trendline Pro: Smart Market Structure & Breakout Indicator (오토 추세선 프로: 스마트 시장 구조 및 돌파 지표) 주관적인 추세선 그리기를 멈추고 알고리즘이 무거운 작업을 처리하도록 하세요. Auto Trendline Pro는 유효한 고점 높이기(HH)를 고점 낮추기(LH)와 연결하고, 저점 낮추기(LL)를 저점 높이기(HL)와 자동으로 연결하여 고도의 정확도를 가진 시장 구조를 식별하도록 설계된 고급 프라이스 액션 지표입니다. 정밀성을 위해 제작된 이 도구는 인적 오류를 제거하고 라이브 시장 흐름에 적응하는 객관적이고 실시간인 추세선 플롯을 제공합니다. 데이 트레이더, 스칼퍼, 스윙 트레이더 중 누구이든 이 지표는 최대의 정확도로 고확률 돌파 존을 정확히 찾아내어 엄청난 우위를 제공합니다. 왜 추세선으로 거래해야 할까요? 추세선 거래는 프라이스 액션의 가장 순수한 형태 중 하나입니다. 시장의 자연스러운 흐름에 따라 거래함으로써

Magic Finger Pro — Indicator Overview Magic Finger Pro is the upgraded version of Magic Finger , featuring multi-timeframe (MTF) cross-period trend tracking and built-in stop-loss functionality. Whether you are an intraday trader or a medium-to-long-term trend follower, it provides tailored operational guidance for your strategy. This is an indicator I have used personally since I first wrote "Magic Finger" in 2018. It is much more than just an indicator—it is essentially my entire trading syst
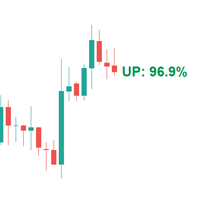
Quantum Probability Trend Probability Indicator Quantum Probability is a trend probability indicator designed for all trading instruments and all timeframes. Based on a price structure analysis algorithm, the indicator automatically analyzes historical price behavior and the current market position to calculate the real-time probability of upward and downward trends, providing traders with a clear view of current market direction and strength. The indicator uses a fully automated algorithm with

Smart Money Concepts Suite — Structure, Volumetric Order Blocks & Liquidity One indicator that maps the whole Smart Money picture: where structure broke, which order block caused it, and which pool of liquidity price is hunting next. Most SMC tools give you one piece. This one draws the complete sequence a Smart Money move is built from — the liquidity grab, the break of structure, the order block left behind, and the imbalance price has to come back for — on a single chart, in a single indicato

Индикатор ищет последний значимый скачек цены инструмента. Автоматически выдает рекомендации по расставлению лимитных ордеров внутри размаха найденного скачка ценн. Задает уровни цены открытия и подписывает величины обьемов ордеров. По уровням расчитанным индикатором торгует Советник Auto Limit Order Trader
Входные параметры:
number of bars to search for a jump - кол-во бар на графике для поиска скачка. Minimal Jump (%price) - фильтр для отсеивания малозначащих движений цены. в процентах

MStructure 90 — ATR Trend & Smart Money Structure Indicator Non-repainting ATR trend line combined with automatic Market Structure detection (BOS/CHoCH), buy/sell signal arrows, and multi-channel alerts — built for traders who follow price action and structure shifts. Full Description MStructure 90 combines two complementary trading concepts into a single, clean tool: a SuperTrend-style ATR trailing line for trend direction, and Smart Money Concepts (SMC) market structure detection for confirmi

Overview
Smartflow is a technical indicator for MetaTrader 5 that displays directional trade signals, trend state and supply and demand levels in one chart window. It calculates a direction state from a volatility based trailing stop model using the Average True Range (ATR), and it prints buy and sell markers where that state changes on a closed bar.
The indicator does not open trades and does not manage positions. All outputs are visual, and the decision to enter or exit a trade remains with

Momentum Compass is a momentum and slope oscillator built on an adaptive (Jurik Moving Average) JMA-style filter, paired with a multi-timeframe status panel. It shows the direction and strength of momentum on your current chart, and lets you check the same reading across seven other timeframes — from M1 to D1 — without opening a single extra chart window. Advantages Low-lag response. The underlying adaptive filter is designed to turn with price sooner than a standard moving average, so moment

GannNexus : 가격과 시간 기하학의 궁극적인 융합 시장에 숨겨진 기하학적 구조를 해독하세요. GannNexus v3.10 은 단순한 지지/저항 지표가 아닙니다. 이는 존 머피(John Murphy) 의 고전적 시장 구조 분석과 W.D. 간(W.D. Gann) 의 고급 "가격-시간 각도" 이론, 9의 제곱(Square of 9) 수학, 그리고 신성 기하학을 결합한 포괄적인 분석 엔진입니다. 정확성을 추구하는 트레이더를 위해 설계된 이 도구는 시장 형태(사각형, 삼각형, 육각형)를 자동으로 감지하고, 주요 피벗으로부터 동적 간 각도를 계산하며, 9의 제곱 공식을 사용하여 미래의 가격/시간 목표를 예측합니다. 주요 기능 1. 고급 지지 및 저항 엔진 동적 S/R 레벨: 최근 피벗 클러스터를 기반으로 주요 지지 및 저항 구역을 자동으로 식별합니다. 추세선: 주요 고점과 저점을 연결하는 자동 추세선을 그려 즉각적인 시장 방향을 시각화합니다. 피벗 포인트: 스윙 하이와 로우를 사용

Omega Cross Pro Omega Cross Pro is a single-file MT5 indicator that combines Williams %R and Tenkan-based crossover logic with visual trend confirmation, colored candles, signal arrows, dashboard status, and mobile alerts.
Description:
Omega Cross Pro is a clean and practical MetaTrader 5 indicator designed to identify BUY and SELL opportunities using a crossover between Williams %R and a Tenkan-based signal line, with additional confirmation from the main Chart Tenkan. The indicator is built

AP HELPER — a comprehensive market analysis indicator for MT5. Analyzes volume, determines the dominance of buyers or sellers based on RSI, Stochastic, MACD and ATR. Displays support/resistance levels and price projection on the chart. The information panel shows recommendations, risk/reward ratio, indicator status, trend and volatility in real time.
A separate version from the ALEKSEEV PROFIT robot.
For all questions, suggestions and feedback please contact: Email: alekseevprofit@gmail.c

POSITION TRADE AF I present a trading system designed to assist traders in the technical analysis and study of opportunities for Position Trading , using an approach based on the combination of price structure, volume, support, resistance, and overall market context . The indicator was developed as a professional analytical tool , with the objective of automatically identifying relevant areas on the chart where a greater confluence of technical factors may exist, providing traders with regions t

Lune Algo Premium — Four Strategies, a Confidence Score on Every Signal, and a Trade Manager That Draws Your Exits Every arrow comes with a number on it. That number is how many of five checks agree with the trade. Most signal tools print an arrow and walk away. You're left guessing whether this one is the good one, because on the chart they all look identical. Lune Algo scores each signal as it fires. Five unrelated checks vote (trend, directional strength, accumulation, money flow, momentum sl

Automatic Support & Resistance Zones is a technical analysis indicator for MetaTrader 5 designed to automatically identify and display potential Support and Resistance zones directly on the main chart. The indicator analyzes recent price action, local swing highs and lows, and candle wick characteristics to identify areas where the market may have previously shown rejection or reaction. Key Features Automatic Support Zone Detection
Automatic Resistance Zone Detection
Price-action based analysis

This indicator brings the popular TradingView-style MACD to MetaTrader 5. Unlike TradingView, MT5 does not include this version as a built-in indicator. It offers a familiar MACD visualization with clear histogram, signal line, and trend analysis, helping traders identify momentum changes and potential market direction. It is designed for traders who want a TradingView-style MACD experience directly within MetaTrader 5.

Strength Meter MA for MetaTrader 5 by Andrei Keino
Strength Meter MA is the easiest way to identify strong and weak currencies or symbols. This indicator shows the absolute strength of up to 24 currencies or symbols for all the charts that opened in Metatrader5. The adding/removing symbols to/from indicator are handled automatically, after adding/closing the chart windows in the Metatrader5. This indicator can be used to identify the currency/symbol with the high probability of a high amplitud

Spike Probability GainX 999 is a professional analytical indicator engineered specifically for pinpointing price spikes on the GainX 999 index . It combines multi-pattern oversold algorithms and structural trend levels into a clean, intuitive on-chart GUI . Key Features: Dynamic Spike Probability Scale: Real-time multi-factor confluence analysis displaying spike probability (0–100%) directly on your screen . Multi-Trend Dashboard: On-chart dashboard tracking trend direction across 4 technical pa

NeuroCycle is a self-learning indicator designed primarily for binary options and short-term scalping.
The system automatically searches for suitable parameters of its built-in trading model for a selected market period.
The main optimization principle is what I call the Rule of Three Variables: Time, Sample Size, and Probability.
The idea is simple:
Time The training period should be long enough for the market to pass through different conditions and regimes.
Sample Size A sufficiently la

Most traders never actually find out whether the signal they follow makes money. Signal Verdict answers that on your own chart. It replays your entry rule across history, opens and closes a simulated position for every signal, and reports what really came out: win rate, expectancy in R, profit factor, drawdown, and how often each take profit was reached.
It is not limited to its own signals. Signal Verdict can read the buffers of any indicator installed on your terminal, so the arrows you are

The DeltaAlpha Trend Signal: Your Ultimate All-in-One Trading Arsenal
The Genesis of a Trading Powerhouse
Imagine having a dozen of the most sophisticated trading indicators, all seamlessly fused into a single, elegant, and visually stunning chart overlay. That is precisely what the DeltaAlpha Trend Signal represents—a masterful symphony of seven distinct trading engines, each contributing its unique voice to create a harmonious and overwhelmingly powerful trading signal. This isn't just ano

Levelkeeper — Automatic Swing Structure Mapper Levelkeeper automatically finds, tracks, and retires swing-high/swing-low structure for you — so every line on your chart is always live, relevant, and worth trading. Stop redrawing horizontal lines every session. Let Levelkeeper keep them for you. Levelkeeper is a professional market-structure engine for MetaTrader 5 that continuously scans price action, identifies confirmed swing highs and swing lows using a configurable pivot-strength algorithm,

Engulfing Confluence Scanner Engulfing Confluence Scanner was built to solve a simple problem: on its own, the Engulfing pattern throws off too many false signals. The indicator takes that pattern and puts it to the test by cross-checking it against the direction of a trend moving average (configurable across ten variants, from SMA to Hull) and against MACD direction. Only when these three readings line up does the Engulfing candle get highlighted and trigger an alert. On top of that sits the Re

Market Structure Evaluator MTF Market Structure Evaluator MTF is an institutional-grade price action indicator designed for Smart Money Concepts (SMC) and Market Structure traders. It automatically tracks Market Structure Breaks ( BOS ) and Change of Character ( CHOCH ) in real-time across multiple timeframes, giving you a complete macro-to-micro view of market trend alignment without cluttering your charts or having to analyse other timeframes.
Whether you trade manually or build automated tr

Confluence Signal System MT5 Price Action + RSI + Volume + EMA 200 + Market Structure + BUY/SELL Signals Filter the noise. Trade the confluence. Confluence Signal System MT5 is a multi-filter technical analysis indicator for MetaTrader 5 designed to help traders identify structured BUY and SELL setups by combining Price Action, RSI momentum, Volume confirmation, EMA 200 trend filtering and Market Structure analysis directly on the chart. Instead of relying on a single trading indicator, Confluen

Average True Range (ATR) 변동성이 조용한지 과열인지 0에서 100 순위로 확인하세요. 리페인트 없음.
모든 통화쌍, 모든 타임프레임. 2분 만에 차트에 적용. Strategy Tester에서 무료 데모.
Get more indicators here
Baselines, volatility filters and oscillators. No repaint.
필요한 이유 0.0040 같은 원래의 ATR 값만으로는 알 수 있는 것이 적습니다. 지금 이 통화쌍에서 높은 값일까요, 보통일까요? 알려면 몇 주 분량의 봉을 거슬러 올라가 추측해야 합니다. 그러면 움직임이 없는 시장에 진입하거나, 이미 과열된 시장에서 같은 크기로 거래하게 됩니다. 신호는 괜찮았지만 그 주변의 변동성이 맞지 않았습니다. 제공하는 것 Fabii Volatility ATR Percentile은 현재 ATR을 최근 봉의 ATR과 비교해 순위를 매기고, 0에서 100까지의 고정 척도로 보여 줍니다.
MetaTrader 플랫폼 어플리케이션 스토어에서 MetaTrader 마켓에서 트레이딩 로봇을 구매하는 방법에 대해 알아 보십시오.
MQL5.community 결제 시스템은 페이팔, 은행 카드 및 인기 결제 시스템을 통한 거래를 지원합니다. 더 나은 고객 경험을 위해 구입하시기 전에 거래 로봇을 테스트하시는 것을 권장합니다.
