 MetaTrader 5
 エキスパート
 インディケータ
 ライブラリ
 ユーティリティ
 ウィジェット
 ルール
YouTubeにあるマーケットチュートリアルビデオをご覧ください
ロボットや指標を購入する
仮想ホスティングで
EAを実行
EAを実行
ロボットや指標を購入前にテストする
マーケットで収入を得る
販売のためにプロダクトをプレゼンテーションする方法
MetaTrader 5のための新しいテクニカル指標 - 133
 テクニカル指標からのシグナルは、株式および外国為替市場での取引の開始と終了に重要な役割を果たします。指標の本質は、将来の価格変動を予測することを目的とした金融銘柄価格の数学的変換です。
テクニカル指標をテストして、市場の動きとそれからの利益をより正確に予測します。
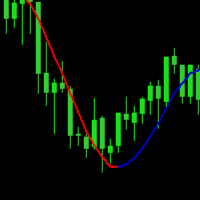
A moving average is simply a way to smooth out price fluctuations to help you distinguish between typical market “noise” and the actual trend direction . By “moving average”, we mean that you are taking the average closing price of a currency pair for the last ‘X’ number of periods. Like every technical indicator, a moving average (MA) indicator is used to help us forecast future prices.
FREE
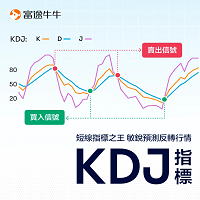
The KDJ indicator is a very useful momentum oscillation indicator made up of three indicator lines K, D, J. Many people also refer to the KDJ indicator as a “random indicator” because it actually adds a J line as an auxiliary on the basis of a traditional random indicator (containing only K, D lines). The KDJ indicator has a certain degree of comprehensiveness, drawing on the advantages of the William Indicator (WMSR) and Moving Averages (MA) to help investors better judge market trends and ide
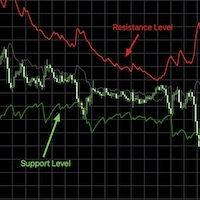
RSI bands provide an intuitive and visual method of understanding how price movements influence the Relative Strength Index (RSI) within its bounded range of 0 to 100. The upper and lower bands typically represent key thresholds—commonly set at 70 and 30—which signal potential overbought or oversold conditions. When RSI approaches or crosses these bands, it may indicate that a reversal or pullback is likely, helping traders identify potential entry or exit points. By plotting these bands on a c
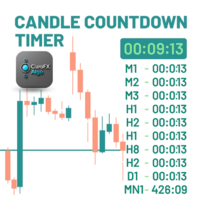
ClaroFxAlgo Candle Countdown Timer – MetaTrader 5 Indicator Overview CandleCountdownTimer is a powerful yet lightweight MT5 indicator that displays dynamic countdowns to the next candle close, helping traders gain precise timing awareness across all timeframes. Its sleek, customizable design ensures critical timing data is visible—without cluttering your charts. Key Features ️ Main Timer Display – Live countdown to the next candle close on current timeframe Multi-Timeframe Panel – View
FREE

If you love this indicator, please leave a positive rating and comment, it will be a source of motivation to help me create more products <3 Key Takeaways Generates buy and sell signals earlier than regular MA This indicator can detect a trend when it is just starting Filter : A special parameter that is useful for filtering out spikes without causing lag. However, like all indicators, it isn't foolproof, to avoid false signals, it's best to use the Dots indicator with other indicators. Te
FREE

Risk5Percent is a custom indicator for MetaTrader 5 designed to help you manage your risk exposure precisely. By entering the desired risk percentage and the number of lots used, it calculates and displays the corresponding price level on the chart that represents your maximum anticipated loss (e.g., 5%), automatically considering contract and tick size for the selected instrument. Key Features:
Custom settings for trade direction (long/short), risk percentage, and lot size.
Automatic adjus
FREE
The Adaptive Trend Indicator is a dynamic trend-following tool that adjusts its sensitivity based on market volatility,
offering a more responsive alternative to classic moving averages.
It supports both SMA and EMA modes and changes color based on trend direction or crossovers, giving a clear visual cue for potential entries or exits. Read about recommended usage for different markets, timeframes and trading styles: Adaptive Trend Indicator
Features ATR-based period adaptation for responsive
FREE

ZLEMA Trend – No lag - No loss - Your Sweet Spot for Market Turning Points Discover the charm of precision trading with ZLEMA , a refined tool crafted to help traders capture top and bottom reversals with confidence and clarity. This custom MT5 indicator uses a dual Zero Lag Exponential Moving Average (ZLEMA) strategy – featuring ZLEMA 5 and ZLEMA 9 – delicately blended to reduce lag and highlight price momentum in real time. When these two lines cross and diverge, the indicator whispers a p

Overview The MACD Divergence Indicator is a powerful tool designed to detect potential trend reversals by analyzing divergences between price action and the MACD (Moving Average Convergence Divergence) indicator. It automatically identifies and highlights bullish and bearish divergence signals directly on the chart, making it easier for traders to spot high-probability trading opportunities. Key Features Customizable Settings: Includes adjustable parameters to suit various trading styles and ti
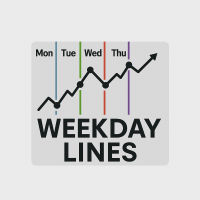
Boost your technical analysis with our Weekday Lines Indicator — a powerful yet lightweight tool designed for traders who want to clearly visualize daily market structure.
Key Features: Auto Draws Vertical Lines for each trading day: Monday through Friday
Customizable Colors & Styles to match your chart theme
Day Labels (Mon, Tue, etc.) appear next to lines for easy tracking
Works in All Timeframes — especially useful in intraday and swing trading
No Lag, No Clut

Advanced Market Structure Pro - Multi-Timeframe Trend Analysis Indicator Overview Advanced Market Structure Pro is a sophisticated technical analysis indicator that combines Zero Lag EMA (ZLEMA) technology with adaptive volatility bands to identify high-probability trend changes and continuation signals across multiple timeframes. This indicator provides traders with a complete market structure analysis system suitable for all trading styles, from scalping to position trading. Key Features 1. Ze
This is a simple RSI indicator, but unlike the original one, it sends alerts when volume falls below the upper level or rises above the lower level, so you never miss a trading opportunity. Combined with support and resistance levels, it can provide strong entry opportunities into the market. I recommend keeping the levels as they are, i.e. 75 above and 25 below Check out my signal " PipStorm Invest ", save it to your favorites and come back from time to time to check it again :)
FREE

AVERAGE DAILY RANGE INFO INDICATOR IS SIMPLY A NICE WAY TO GLANCE AT THE RANGE FOR A SPECIFIED NUMBER OF DAYS. IT SHOWS THE INFORMATION IN A SIMPLIFIED FORMAT BY DEFAULT RIGHT UPPER CORNER OF THE CHART WITH OPTIONS TO PLACE IT ANYWHERE ONE PLEASE. ITS SIMPLE YET EFFECTIVE. YOU CAN CHANGE THE PERIOD, CUSTOMIZE THE COLOR AND CHANGE THE FONT TYPE OR FONT SIZE IN THE SETTINGS TO SUIT YOUR STYLE.
FREE
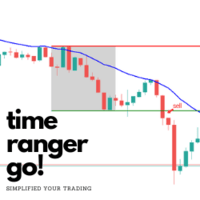
Hi I'm here to help simplified your trading, simple and profitable This is my new indicator that can help you trading. V2 New Feature : Buy and Sell Signal Alert Options
This indicator is : Time Range Indicator with MA as Trend Confirmation You can customize start and end hour of Time Range You can choose your Moving Average as Trend Confirmation You can customize color of this Indicator
My Simple XAUUSD settings: - Start 02:00 PM (Start of London Session) - End 04:00 PM (London Session) - MA

WickExtreme Price Printer — Trade Where Price Tells the Truth Introducing the WickExtreme Price Printer , a precision tool designed for serious traders who believe that price wicks are not noise—they are signals . Built on the timeless principles of Jesse Livermore's price-reading tactics , this indicator reveals real-time market intent by printing key high and low wick prices directly on the chart, with clean, vintage-style visuals. Features: Wick Price Printing : Automatically prints the price

B5 and B3 assistant is an indicator developed to add a bit of certainty.
The indicator provides the trader with clear "predictive" entries.
Each entry is marked on the chart, with a point value and estimated amount of spikes.
HOW TO USE THE INFDICATOR:
Load onto your Boom 500 or B300 chart.
Wait for signal.
Use signal information to place SL and TP.
EXAMPLE OF HOW TO TAKE TRADES:
You will get an on chart alert and push notification which will be as follows: OPTION 1:
incoming spike ale
MNK Trend Line Indicator This indicator builds a linear trend line based on the method of least squares (OLS). It helps you detect the main price trend for any symbol or timeframe. Customizable period Shows trend strength Can be used in expert advisors (via iCustom) Works on any instrument and timeframe. Индикатор по методу наименьших квадратов (МНК), также известный как Least Squares Moving Average (LSMA) , — это разновидность скользящей средней, которая использует линейную регрессию для оценки
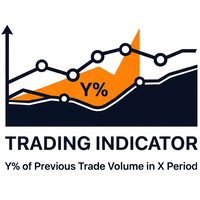
This indicator calculates and visualizes the price range containing the top 70% (Configurable) of the traded volume for the previous selected timeframe, using a flexible binning approach. This allows the trader to clearly see between what price range the majority of volume traded, this aligns very well with support and resistance levels as well, making both intraday trading between the highs and lows and to detect breakout zones possible, especially on the larger timeframes. The trader can selec

UZFX {SSS} スキャルピング・スマートシグナル v5.0 MT5は、変動の激しい市場において正確かつリアルタイムのシグナルを求めるスキャルパー、デイトレーダー、スイングトレーダー向けに設計された、リペイントのない高性能な取引インジケーターです。(UZFX-LABS)によって開発されたこのインジケーターは、価格行動分析、トレンド確認、スマートフィルタリングを組み合わせることで、すべての通貨ペアおよび時間枠において、高確率の売買シグナル、警告シグナル、トレンド継続の機会を生成します。
トレードの判断に迷うのはもうやめましょう。明確さ、正確さ、そして規律ある市場執行を求めるトレーダーのために設計された、体系的なシグナルシステムに従い始めましょう。 間違いなく、MQL5で入手可能な最高のインジケーターの一つです。絶対に見逃さないでください!!「スマートなトレーダーのためのスマートシグナル」 最新バージョン5.0がリリースされました。価格は予告なく最大499.99ドルまで値上がりする可能性がありますので、チャンスを逃さないようお早めにお求めください!! 購入を決める前に!無料トライアル

SAM Waves PRO – Professional Signal Indicator for Day Trading SAM Waves PRO is the extended version of the popular SAM Waves indicator, designed specifically for disciplined intraday Forex traders. It includes real-time notifications via push, email, and sound alerts, ensuring you never miss a qualified trading signal. Backtested on over 5.5 years of historical data, the strategy has achieved a consistent win rate above 60 percent when traded using a fixed stop loss and take profit between 20 an
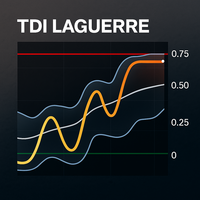
TDI ラゲール (TDI Laguerre) TDI ラゲール は、人気のインジケーターである Traders Dynamic Index (TDI) を進化させたものです。従来の RSI を ラゲールフィルター に置き換えることで、価格変動をより滑らかに、敏感に、そして正確に読み取ることができます。この高度なバージョンは、ボラティリティ、移動平均、視覚的なシグナル検出の要素を組み合わせ、設定可能なアラート機能も備えています。 このインジケーターの機能は? このインジケーターは以下を表します。 終値に基づいた 平滑化されたラゲールライン 。 ラゲールライン上にある短期 EMA シグナルライン 。 ミドルバンド (ラゲール移動平均)。 ボラティリティバンド (ラゲール標準偏差に基づく)。 設定可能な 上限と下限レベル (例:買われすぎ/売られすぎ)。 主要なクロスと極端なゾーンからの反転に基づく 視覚的な売買シグナル 。 ローソク足の終値で条件が満たされた場合にのみ、誤ったシグナルを回避する音と視覚によるアラート。 主な違い: 特徴 従来の TDI (RSI) TDI ラゲール (
FREE

トレーディングアドバイザー - 頼れるパートナー このインジケーターは、リアルタイムの市場定量的分析を提供することで、トレーダーの取引を 助言し、サポートする ために設計されています。これは自動売買ツールではなく、以下の情報を提供する インテリジェントなアシスタント です。 市場診断 (上昇/下降トレンド、レンジ、ボラティリティ) 一般的な推奨事項 (いつ買うか、売るか、待つか) 推奨されるリスク管理 (ATRに基づくストップロスとテイクプロフィット) 規律を維持するための 心理的アドバイス これは、自分のアイデアを検証したり、取引の重要な側面を思い出したりするのに役立つ**「もう一つの目」**を求めているトレーダーにとって理想的です。 ユーザーマニュアル 設定可能なパラメーター 1. 一般パラメーター 分析時間軸 (Timeframe for analysis): 分析のための時間軸(デフォルトは現在のチャートの時間軸)。 推奨: 実際に取引を行う時間軸(H1、M15など)と同じ時間軸を使用してください。 パネル表示 (Show Panel): ビジュアルパネルを有効/無効にします。
FREE
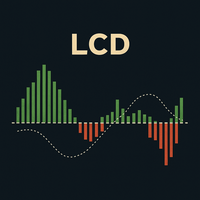
LCDラゲール収束・発散(Laguerre Convergence Divergence):クラシックMACDの高度な改良版 LCDラゲール収束・発散(Laguerre Convergence Divergence) は、古典的なMACDを改良するために設計された、高度なテクニカル指標です。より速く、より感度が高く、適応性の高いモメンタム検出を提供します。主な利点は、従来の移動平均線よりも価格変化に正確に反応する ラゲールフィルター を使用している点です。 主な利点 高い感度と少ない遅延: ラゲールフィルターは、ボラティリティの高い市場で非常に重要な、より早期の売買シグナルを生成します。 ボラティリティへの適応性: **ATR(Average True Range、平均真の範囲)**に基づいて動的に調整され、低ボラティリティ時にはノイズをフィルタリングし、高ボラティリティ時には素早く反応します。 強化されたノイズフィルタリング: 偽のシグナルを減らすために、**決定ゾーン(Decision Zone)**と追加のスムージング(ヒストグラムのEMA)が含まれています。 オプションの出来高
FREE

LSCB Gold:流動性のスイープと保ち合いブレイクアウトのインジケーター LSCB Gold (Liquidity Sweep & Consolidation Breakout)は、**XAUUSD(ゴールド)**ペアのスキャルピング取引向けに特別に設計された専門的なテクニカルインジケーターです。その中心的な戦略は、低ボラティリティの保ち合い(コンソリデーション)期間の後に、市場から流動性がスイープ(掃討)される瞬間を検出し、確率の高い取引セットアップを特定することです。 このインジケーターは、明確でリペイントしない売買シグナルをチャート上に直接提供します。さらに、現在の市場ボラティリティに基づいた推奨ストップロス(SL)およびテイクプロフィット(TP)レベルも表示します。 ## 中核戦略 インジケーターのロジックは、2段階の市場分析に基づいています。 保ち合いの検出(Consolidation Detection): まず、インジケーターは市場の保ち合い(レンジ相場)期間を特定します。これは**平均真のレンジ(Average True Range, ATR)**を監視す

ジャン・ミーウスの天文学的アルゴリズムを使用して、トレーディングチャート上に月相を表示するテクニカルインジケーターです。プロの天文台に相当する科学的精度で月の周期を表す連続した曲線を特徴としています。FX、商品、指数、株式を含む MT5 上のあらゆるシンボルと時間枠に対応しています。現在の月相、照明率、テクニカル分析のための参考レベルを表示する情報パネルを搭載しています。色とスタイルの設定は完全にカスタマイズ可能です。精密な天文計算に基づくリアルタイムの月データを提供し、トレーダーが月の情報を客観的に市場分析に組み込むことを可能にします。 このインジケーターは、当社の認証済み MQL5 シグナル「NaviMoonCycle」(ID: 2354163)で実際に使用されており、実際の OANDA ライブ口座で実資金によるトレードを行っています。このシグナルは、主要な FX 通貨ペアにおいて、本インジケーターによって特定される月の周期フェーズに基づく戦略を適用しています。 リアルタイムの結果、月次パフォーマンス、取引履歴はこちらでご確認いただけます: https://www.mql5.c

概要 Advanced Key Levels Predictor EA は、MetaTrader 5 向けに開発された高度なエキスパートアドバイザー(EA)であり、先進的なテクニカル分析と予測アルゴリズムを組み合わせて、市場の重要なレベルを特定し、将来の価格動向を予測します。このEAは、視認性に優れたインジケーターを用いた高度なチャート表示機能を備え、トレーダーの意思決定を支援します。 主な機能 キーレベルの検出 サポート & レジスタンスの自動識別 :高度なアルゴリズムにより重要な価格レベルを自動的に検出 フィボナッチ・リトレースメント :23.6%、38.2%、50%、61.8%、78.6% の主要なフィボナッチ水準を表示 ピボットポイント :日ごとのピボットポイントと対応するサポート/レジスタンスを表示 レベル強度分析 :過去の価格反応に基づいて各レベルの信頼性を評価 予測分析 線形回帰予測 :統計的手法により将来の価格動向を予測 移動平均トレンド分析 :モメンタムに基づいた傾向予測を実施 RSIによる短期予測 :RSIパターンを用いて短期的な価格変動を予測 信頼スコ

添付画像をよく確認してからお読みください このインジケーターは、 ナダラヤ=ワトソン核回帰エンベロープ (Nadaraya‑Watson Kernel Regression Envelopes) の理論と価格モメンタム指標である RSI を組み合わせて構築されています。また、 流動性分析 の概念も含まれており、エントリーおよびエグジットポイントを正確に特定するための強力で適応性の高いツールです。 インジケーターをご購入いただいた方は、 メールでご連絡 の上、 お支払い確認のスクリーンショット を添付してください。効果的なトレード方法についての 詳細なガイド資料 をお送りいたします。 I. MT5用ナダラヤ=ワトソン エンベロープ&RSI統合インジケーター MetaTrader 5向けに設計されたこの高度なインジケーターは、適応型スムージングアルゴリズムとモメンタム分析を組み合わせ、明確で実用的なシグナルをトレーダーに提供します。 II. 主な機能 II.1 適応型ナダラヤ=ワトソン エンベロープ 価格変動に応じてダイナミックに調整され、潜在的な反転またはトレンド継続を特定するための正確

The Kecia Market Manager is an advanced MT5 indicator that transforms multi-asset correlation analysis into actionable trading intelligence. By employing 6 sophisticated statistical frameworks and professional-grade visualizations, this tool reveals hidden market relationships, pair trading opportunities, and portfolio hedging strategies across unlimited currency pairs in real-time. Key Features: Multi-Metric Analysis Engine : Pearson correlation coefficient with rolling windows Cointegration te
HiLo Matrix Indicator by Daniel Butogwa — Version 1.00 Precision Session Zones & Hourly Sweep Levels for the True Forex Scalper Overview HiLo Matrix is a powerful MT5 indicator designed to map key intraday market structure levels across major Forex sessions: Asian (Tokyo), London, and New York . This tool visually highlights session price ranges with clean, customizable colored boxes and lines to give you the sniper’s edge on timing, liquidity hunts, and breakout setups. It also includes critic
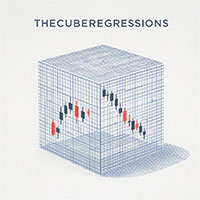
Product Name: The Cube Regressions - The Oracle of Future Trends
Predict the Market with Surgical Precision - Advanced Regression Technology
The indicator that projects price movements 5 minutes ahead
Full Description:
Unlock the power of predictive analysis with ANHURIX PRO, a revolutionary indicator based on:
Military Linear Regression - Algorithm developed for special forces in the financial market Precision Scatter Analysis - Identify turning points based on historical data Re

The CDC Trend Matrix is a next-generation indicator that seamlessly combines trend detection with momentum insights, helping you spot optimal entry and exit zones at a glance. Its intuitive “zone” coloring immediately signals Bullish, Bearish, or Sideways market phases, while on-chart alerts keep you informed without cluttering your screen. Highlights Color-coded bars for instant trend zone recognition Clear BUY/SELL labels for precise action points Fully customizable settings to match your ri
Title: Hourly Sweep Zone Indicator by Daniel Butogwa Description: "Market makers move in silence. But their footprints scream in price. This indicator exposes them." The Hourly Sweep Zone Indicator by Daniel Butogwa is a sniper-grade institutional trading tool designed to identify and visualize liquidity zones , hourly price extremes , and smart money footprints on the chart — live and historically. It automatically draws hourly high/low sweep zones using clean, minimal rectangles that high
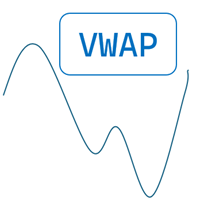
VWAP Indicator, the short form of Volume Weighted Average Price, is similar to a moving average but takes into consideration the tick volume of the candles. The indicator calculates the moving average multiplying the price of each candle for the tick volume in the candle. Said calculation weighs with more significance price where more transactions were made.
Features: Visual styling customizable Period customizable Ease of use
FREE

ATR Momentum Dashboard - Professional Currency Volatility Analyzer Transform Your Trading with Real-Time Currency Strength Analysis The ATR Momentum Dashboard is a cutting-edge indicator that provides instant visibility into currency volatility across all major forex pairs. Built for professional traders who demand precision and clarity in their market analysis. Key Features Real-Time Currency Ranking : Automatically ranks all 8 major currencies (USD, EUR, GBP, JPY, AUD, CAD, CHF, NZD) by

Have you ever wondered why most systems are not effective in live trading? My answer is that it's all the fault of the so-called "Smart Money" or the institutional ones,, they constantly create spikes first up then down and vice versa to screw all the retail investors by tearing away their capital, confusing them and making the markets move randomly without any rules. But in all this there is a famous strategy, which in 2009 won the world championship, exploiting and rowing against the instituti

Indicator Title: Supply and Demand Zones Short Description: This indicator for MetaTrader 5 automatically identifies and draws supply and demand zones on the price chart, providing key visual information for trading decisions. Based on the analysis of price action and candle structure, the indicator highlights areas where the price is likely to react. Detailed Description: The Supply and Demand Zones indicator analyzes price history to identify specific candlestick patterns that suggest the pres

Fair Value Gap Finder detects fair value gaps and generates a signal when price returns to one. Set the minimum and maximum fvg size, customize the colors, style, and length, then let the indicator highlight them for you.
Key Features: Automatic FVG highlights - The indicator detects all fair value gaps that fit your criteria and marks them on the chart.
Entry Signal - A signal is created whenever price retests a fair value gap.
Notification - Alerts notify you when a fair value gap or a new
FREE
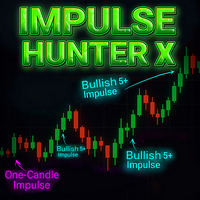
Impulse Hunter X Indicator – Professional Market Movement Radar Impulse Hunter X is a professional trading tool designed to help traders detect new, strong market impulses. It identifies and alerts you to powerful price movements, ensuring you never miss a trading opportunity. Every impulse type has been meticulously tested and refined for accuracy. Before using, make sure to configure the input parameters, especially the candle body size for stronger impulses! Key Features Detects stron
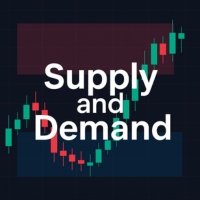
This indicator helps to draw supply and demand zones based on ICT's concepts. Traders can customize their Demand and Supply zones' color. By default, demand is red, supply is blue. The recommended way of trading by ICT is to buy in Demand Zone and sell in Supply Zone. Do keep in mind to consider multiple other confluences when trading. Do keep in mind that it is possible for supply and demand zones to overlap. In such instances, I would recommend to refrain from trading as this implies a lack of
FREE
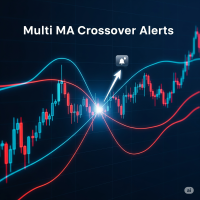
Multi MA Crossover Alerts - The Ultimate Trend Trading Tool Full Description: Tired of staring at charts for hours, afraid of missing a critical crossover signal? Do you find it difficult to analyze the trend using multiple moving averages at the same time? The Multi MA Crossover Alerts indicator is the all-in-one solution that will transform your trend trading. This powerful tool is designed to give you a complete market overview and alert you at the perfect moment, freeing you from the screen
FREE

After 18 years of experience in the markets and programming, Winner indicator is ready. I would like to share with you! *** Contact me to send you instruction and add you in group for sharing or seeing experiences with other users. + FREE Trading Utility MT5
Largest Market Cap belongs to Gold, Bitcoin and US30, So they have many traders and great for use in scalping. Gold and Bitcoin Assistant will earn profit on M5 time frames in Gold, Bitcoin and US30. Easy strategy comes from long years e

Read This : Please provide comments and reviews for future improvements. WaveTrendPro_Indi v1.05
WaveTrend indicator with enhanced histogram visualization : Histogram is now scaled higher (adjustable via HistScale ). Different colors for positive & negative bars, making trend direction clearer.
Lightweight & responsive across pairs and timeframes. Perfect for scalpers, swing traders, and trend-following strategies.
WaveTrendPro_Indi v1.05
Indikator WaveTrend dengan tampilan histogram yang le
FREE
Professional Gold Trading Levels Indicator
Features: - Daily & Weekly Pivot Points - Fibonacci Retracement Levels - Round Number Levels - Customizable Colors & Fonts - Auto-Update Daily - Clean & Simple Interface
Perfect for Gold (XAUUSD) traders Reliable Support/Resistance levels Lightweight & Fast Performance Easy to install and use
Compatible with all MT5 accounts. No complex settings required! SimpleGoldLevels v1.0 - User Manual Professional Support & Resistance Levels
FREE

SuperTrend Indicator – Description & Important Notice The SuperTrend is a composite technical indicator designed to help you identify the primary trend, measure its strength, and assess signal quality. However, an indicator is only a tool —it’s never 100% accurate and cannot replace sound risk management. 1. Core Formula & Components ATR (Average True Range): measures price volatility; customize sensitivity via Periods and Multiplier . Upper/Lower Bands: derived from ATR and your chosen source p
FREE
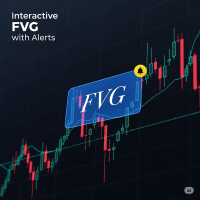
FVG Indicator with Alerts Description: This is a simple and effective indicator for identifying and displaying Fair Value Gaps (FVGs) on any timeframe. The indicator helps you see important price imbalances and provides powerful interactive tools for your analysis. Key Features: Detects FVGs: Clearly identifies and draws boxes around Bullish and Bearish Fair Value Gaps. Midline Level: Displays the 50% equilibrium level inside each FVG box, a critical point of interest. Complete Alert System: Rec
FREE
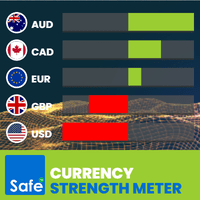
What Is the Currency Strength Meter? The Currency Strength Meter is an advanced yet easy-to-use indicator that measures the relative strength of 8 major currencies by analyzing their real-time performance across 28 currency pairs .
It visually ranks currencies from strongest to weakest, helping you: Spot high-probability trading opportunities
Match strong currencies against weak ones
Trade with confidence and precision
With just a glance at the dashboard, you'll know which currencies to trade –

Un indicatore avanzato che identifica in automatico le zone chiave di supporto e resistenza su tre timeframe diversi , mostrandole con rettangoli colorati direttamente sul grafico. Ogni zona viene estesa in avanti, etichettata e aggiornata dinamicamente con il movimento del prezzo. Caratteristiche principali 3 Timeframe configurabili (es. M15, H1, H4) Zone di resistenza e supporto calcolate automaticamente Colori personalizzabili per ciascun timeframe Etichette automatiche con indicazi

VolaTrend - Smart Volatility Trend Analyzer Transform your trading with instant market condition recognition - know whether to trend trade or range trade at a single glance! What Makes VolaTrend Different? Tired of cluttered charts with multiple indicators? VolaTrend revolutionizes market analysis by combining three powerful volatility indicators into ONE intelligent system that gives you instant market clarity through a single, customizable button. No more guessing. No more chart clutter. Ju

CDS Fractal Blade Session - AIO A precision-engineered, all-in-one custom dynamic system designed to identify and exploit high-probability breakouts during key market trading sessions. The CDS Fractal Blade Session is moves beyond simple session boxes, integrating a sophisticated multi-layered approach to define the most critical price levels with surgical accuracy. This premium indicator serves as the core engine for the CDS Asian Fakeout EA and other automated systems developed b
Gold Signal Quality Selector Stop Guessing. Start Trading Gold with Institutional-Grade Clarity. Are you tired of the chaotic nature of the Gold (XAUUSD) market? Frustrated with generic indicators that generate endless false signals and drain your capital? The truth is, Gold doesn't move like other assets. It demands a specialized tool built for its unique volatility and personality. It's time to stop using one-size-fits-all tools and start trading with an intelligent edge. Introducing Gold Sign

Radar DI – Indicador de Taxa de Juros para Mini Índice e Mini Dólar com Exportação CSV e Integração IA Radar DI é um indicador especializado que transforma as variações da taxa de juros DI (Depósitos Interfinanceiros) em sinais operacionais estratégicos para os ativos mini índice (WIN) e mini dólar (WDO) . NOVA FUNCIONALIDADE: Exportação CSV + Integração com IA Agora o Radar DI permite exportar todos os dados em formato CSV , incluindo: Variações dos DIs Variação do Mini Índice (WIN)

The SMC LuxStyle Clean is a simplified Smart Money Concept (SMC) indicator for MetaTrader 5 that visually highlights key market structure elements such as Break of Structure (BOS), Change of Character (CHoCH), Fair Value Gaps (FVG), and Order Blocks (OB) with minimal clutter. It uses lightweight logic and controlled label placement to avoid overlapping and maintains chart readability, making it ideal for traders who prefer clean visual cues without overwhelming signals.

Indicator using MA + ATR Filter This is a simple trend-following indicator that combines a Moving Average (MA) with an Average True Range (ATR) filter to identify potential buy and sell signals. The MA helps determine the general direction of the market, while the ATR acts as a volatility filter to reduce false signals. Arrows are plotted on the chart to mark entry points when price crosses beyond dynamic thresholds based on the MA and ATR values. Optional alerts notify the trader of signal even

AverageHighLow — Simple and Smart Signal Indicator AverageHighLow is a lightweight and intuitive custom indicator that plots the average of the High and Low prices for each candle — forming a dynamic support/resistance-like line across the chart. It also includes real-time Buy and Sell signal alerts when price crosses this average level.
Features: Plots a smooth line based on (High + Low) / 2 Signals generated when price crosses the average: Buy Signal : Price crosses above the line Sell
FREE

ブログ: https://www.mql5.com/en/blogs/post/768816 MT4版: https://www.mql5.com/en/market/product/139061 MT5版: https://www.mql5.com/en/market/product/139062
問題点
複数の銘柄と時間足を同時に監視するのは、時間がかかり、反復作業が多く、精神的に疲弊します。
多くのトレーダーは、チャートを一つずつ切り替えるのに時間を費やし、気づいた時には既にトレンドが始まっているという状況に陥っています。明確なトレンド転換が確認できた時には、チャンスを逃してしまうことがほとんどです。
解決策 MT5用EA「Scanner HalfTrend [tambangEA]」は、この問題を解決するために開発されました。実用的なマルチ銘柄・マルチ時間足スキャナーパネルと、チャート上に表示されるHalfTrendディスプレイを組み合わせることで、この問題を解決します。
1つのチャートから、どの市場が強気または弱気の状況を示しているか、どのシグナルがまだ有効か、どの

GANN Master は、当日・当週・当月の W. D. ギャンの平方根レベルを描き、買い手と売り手の目標が出会うゾーンを示します。レベルは前の期間の高値と安値から計算され、その期間中は固定されたままで、リペイントしません。 レベルの作り方 前の期間の高値が TOP ライン、安値が BOTTOM ラインになります。指標は TOP から下方向に3つの弱気目標(Bears' interest 1、2、3)を、BOTTOM から上方向に3つの強気目標(Bulls' interest 1、2、3)を、ギャンの平方根ステップ 1/8、2/8、3/8 で測ります。 ギャンの計算には必ずスケールが必要です。GANN Master はそれを自分で選びます。すべてのスケールを試し、強気ラインと弱気ラインが最も近づくスケールを採用します。弱気ラインと強気ラインが近い場所では、双方の関心が出会います。指標はその場所を相互関心ゾーンとして塗ります。1つの期間につき最大5つのゾーンが描かれます。 各ゾーンの上下には、TOP-BOTTOM 幅の 1/8 の距離に点線のゾーンブレイクラインが2本あります。TOP
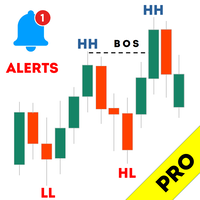
Haven Market Structure PRO 2.0 — 市場構造をひと目で把握 Haven Market Structure PRO は、MetaTrader 5用のインジケーターです。価格構造、重要な価格レベル、確認済みの相場方向の変化を把握するのに役立ちます。バージョン2.0では、チャート分析とコンパクトなHAVENダッシュボードを統合しました。相場の状況を素早く確認し、該当するレベルやイベントをチャート上で直接探せます。 その他の製品 -> こちら 。 バージョン2.0の新機能 3つの構造レベル:ST、IT、LT。 短期・中期・長期の市場構造を個別に表示し、局所的な値動きと、より大きな構造変化を区別しやすくします。 5つのタブを備えたHAVENダッシュボード。 Overviewでは現在の構造状態、Timeframesでは選択した時間足の構造、Levelsでは近くの重要なレベルとゾーン、Eventsでは最近確認されたBOSとCHoCH、Alertsでは基本的な通知設定を確認できます。 チャートレイヤーの操作。 ST、IT、LT、Liquidity、FVG、iFVG、Di
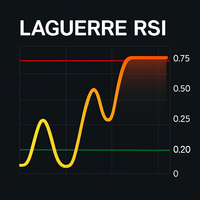
ラゲールRSI(Laguerre RSI):高度なオシレーター ラゲールRSI(Laguerre RSI) は、ジョン・エーラスによって開発された、デジタルフィルターに基づく高度なオシレーターです。このインジケーターは、 ラゲールフィルター と呼ばれる手法を使用して価格変動を平滑化し、 買われすぎ および 売られすぎ の領域をより正確に検出し、市場ノイズを低減します。 ラゲールRSIは 0から1の間 で変動し、その標準レベルは次のとおりです。 買われすぎ: 0.75 以上 売られすぎ: 0.25 以下 このインジケーターは、 市場の転換点 、 正確なエントリー 、 シグナルの確認 を検出するのに理想的です。 オプション機能 ラゲールRSIには、以下のようなオプション機能が含まれています。 音、メール、またはプッシュ通知によるアラート 重要なゾーン間の視覚的な塗りつぶし 平滑化の柔軟なパラメータ設定( ガンマ ) ユーザーマニュアル 設定可能なパラメータ: 1. 主要設定 ガンマ (0.1 から 0.9): 平滑化の度合いを制御します。 低い値 → 感度が高く、シグナルが多くなります。
FREE

Smart Money Pro - プロ仕様のトレード指標 Smart Money Pro - プロ仕様のトレード指標 Smart Money Concepts(SMC)の力を解き放つMT4/MT5用プロフェッショナル指標。銀行や機関投資家が使用する高確率エントリーポイントを提供します。FX、株式、仮想通貨など、あらゆる市場で重要なゾーン、不均衡、反転ポイントを特定し、よりスマートなトレードを実現します。 Smart Money Proを選ぶ理由
高確率の買い/売りゾーン カスタマイズ可能な色で表示される強力な買い/売りゾーン 視覚的なエントリーシグナル(矢印)で判断が容易 リアルタイムで動的に更新 アカウント統計ダッシュボード チャート上で直接残高、純資産、証拠金、P/L、未決済ポジションを追跡 ウィンドウを切り替えることなく必要な情報を確認 完全カスタマイズ可能で使いやすい 感度、色、サイズをトレードスタイルに合わせて調整 全通貨ペアと時間軸(M1~MN)に対応 プロフェッショナルで信頼性の高い 速度と精度に最適化 MQL4/5のベストプラクティスに沿ったクリーンなコード 再描画
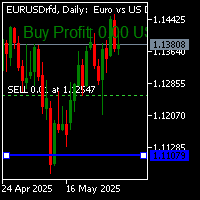
指定された指標は、現在のシンボルに利益(損失)を表示する指標のバージョンの1つです。 あなたは簡単に総利益または損失を決定し、マウスでレベルを移動することができます。 この指標の特徴は次のとおりです。 損益は、取引が行われている場所ではなく、画面の左上隅に表示されるため、損失または利益を計算しても取引に干渉しないことを意味します。 2. インジケータは自動的にあなたが設定した位置を決定します。 3. あなたがロックを取引する場合、指標は平均利益レベルを摘み取るでしょう。 4. 上記の指標は、オープンポジションだけでなく、指値注文でも機能します。つまり、理論的な利益または損失の量を計算する能力を持っています。つまり、手数料、スプレッド、その他のブローカー控除(所得税)などのパラメータを考慮に入れていません。 インジケータは標準モードで開始されます。
上記のインジケータをインストールすると、指定された時間枠に青い水平線が表示されます。 ドラッグすると、画面の左上隅に損益が表示されます。 この指標のもう1つの特徴は、ある時間枠から別の時間枠に切り替えるときに、ラインと統計が削除されないことで
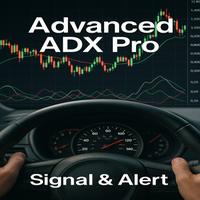
Advanced ADX Pro: ADX分析を次のレベルへ Advanced ADX Pro は、従来の 平均方向性指数(ADX) インジケーターの使用体験を変革するために設計された、高度なトレーディングツールです。より優れた 利便性、コントロール、視覚的・聴覚的な明確さ を提供するために作成されたこのインジケーターは、MetaTrader 5(MT5)ネイティブADXの機能をはるかに超えています。 ADXとは何か、そしてなぜそれが重要なのか? ADXは、市場の トレンドの強さ を測定する重要なテクニカルインジケーターです。主に3本の線で構成されています。 ADX(青線): トレンドの強さを示します。値が増加すると強いトレンドを示唆し 、減少するとトレンドの弱さやレンジ相場を示します 。 +DI(緑線): 上昇の動きの強さを測定します 。 -DI(赤線): 下降の動きの強さを測定します 。 これらの線の組み合わせにより、トレーダーは市場がトレンドにあるかどうか、そしてどの方向に最も強い動きがあるかを特定できます。 MT5ネイティブADX vs. Advanced ADX Pro:機

エフィシエント・ディスタンス・プロ:ダイナミックな自己調整チャネルでトレンドをナビゲート 高速な市場では遅れ、レンジ相場では機能しない静的な移動平均線で推測するのはやめましょう。エフィシエント・ディスタンス・プロは、市場のダイナミクスをより明確に把握するために設計された、リペイントしない高度なチャネルインジケーターです。リアルタイムでボラティリティに適応し、独自に計算されたベースラインの周りにダイナミックなチャネルを形成し、より高い確信を持って高確率のエントリーおよびエグジットポイントを特定するのに役立ちます。 仕組み インジケーターの中核は エフィシエント・ディスタンス・ライン です。従来の移動平均線とは異なり、その計算は価格のボラティリティによって重み付けされています。静かな市場では、滑らかな平均線のように動作します。ボラティリティの高い市場では、より応答性が高くなり、価格の動きに密接に追従します。このコアラインは、その傾きに基づいて色を変え、トレンドの方向性を即座にフィードバックします。 コアラインを囲むのは、2つの ボラティリティバンド です。これらのバンドは、最近の価格ボラテ

Session Time Pro 2.0 — MetaTrader 5用インジケーター 製品説明 Session Time Pro 2.0 は、トレーダーが市場のセッションを効率的に分析するために設計されたインジケーターです。取引時間、価格範囲、予測を視覚的に表示し、価格の動向を把握するのに役立ちます。カスタマイズ可能なオプションを備え、ライン、エリア、またはカラーキャンドルを使用して特定のセッションを強調表示できます。 使用マニュアル 主なパラメーター DrawCandles : セッションを示すカラーキャンドルを表示。 TimeLineStart : セッション開始時間を設定(HHMM形式、例: "0900")。 TimeLineEnd : セッション終了時間を設定(HHMM形式、例: "1700")。空白の場合、セッションは終日継続。 ShowMonday...ShowSunday : セッションを表示する曜日を指定。 BarsToScan : 分析するバーの数を調整。 ShowFutureSession : 将来のセッションを表示。 SessionLabel : セッションにカ

Easy Scalper Every Candle
MT5 Indicator is a technical analysis tool designed for gold (XAUUSD) and major forex pairs. It generates buy and sell signals on each candle using multiple filters, volume dynamics, and market structure logic. The indicator is developed for scalpers and intraday traders who require structured, rule-based signals without unnecessary complexity. Key Features 1. Candle-Based Logic Generates buy and sell signals on every candle. Uses multi-condition filters to reduce noise

BetterVolume ZScore V2 は、ティックボリュームとローソク足の値幅から「その足で何が起きていたか」を分類し、色で示すインジケーターです。 一般的な出来高は「多い・少ない」しか示しません。本インジはそれに加えて**移動効率(値幅÷ティック数)**を測り、活動量との食い違いから状態を判定します。 売買シグナル・矢印・アラートは出しません。表示ツールです。 分類 クライマックス (赤=陽線/青=陰線)… 更新が多く、値幅も出た 吸収 (金)… 更新は多いのに、値幅が出ていない。動こうとして動けなかった足 真空 (ダーク白/ライト黒)… わずかな更新で大きく動いた。板が薄かった足 通常・閑散は沈んだグレー 判定 「平均の何倍」ではなく、直近20本の対数Zスコアで判定します。東京時間の静かな場面とNY時間の荒い場面を同じものさしで扱えます。 印 … 活動量が統計的な異常値(Z≧2.5) ×(赤/青) … 勢いを持って接近したあと、活動が急に消えて止まった足。区切りの印であり、方向の予告ではありません。しきい値は銘柄ごとに直近5,000本から自動で決まります(既定:全バー

VWAP Matrix Price Levels Pro: The Ultimate VWAP Indicator for MT5 with Dynamic Price Levels Dominate the Market with the Perfect Confluence of Multiple VWAPs and Percentage-Based Price Projections. The Precision Tool for Day Traders and Swing Traders on MetaTrader 5.
The VWAP Matrix Price Levels Pro is an elite indicator for MetaTrader 5, designed for traders who demand precision and a superior market view. Elevate your technical analysis by combining, in a single tool, the institutional power
FREE
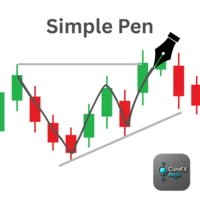
ClaroFxAlgo - Simple Pen v1.00 Free-Hand Drawing Tool for MetaTrader 5 Overview:
ClaroFxAlgo - Simple Pen is a lightweight and intuitive tool that allows traders to draw directly on the MT5 chart using just mouse movements. Designed to enhance visual analysis, this tool makes it easy to sketch trends, highlight zones, or mark chart behavior on-the-fly. Key Features: Draw on chart by simply holding Ctrl and moving the mouse — no clicks required Customizable drawing settings:
• Drawing col
FREE

Smart Market Flow Detector (SMFD) v4.0 — Professional Edition Four Algorithms. One Signal. Zero Repainting. Smart Market Flow Detector combines four analytical engines into a single indicator that identifies institutional order flow patterns across all timeframes. Every signal is generated on closed bars only — what you see in back-testing is what you get live. What It Does SMFD scores every bar on two axes: Smart Money Flow (institutional accumulation/distribution) and Dumb Money Flow (retail
FREE

TrueCycle highlights the cycle of the specified period . The oversold and overbought levels are statistically determined . The indicator ranges from lows to highs and back again . Sell from the highs , buy from the lows . With TrueCycle , you can make accurate trending trades and accurate counter - trending trades . The indicator is very easy to use Only 1 parameter
period - the period of the cycle. The default is 30. A good value is also 120. It is recommended to specify a value slightly less t
The "LotSizer Mouse" indicator is your key to accurate and safe Forex trading!
Tired of rough lot calculations? Do you want to trade with strict risk control? Then this indicator is created just for you!
What is it? This is an indicator for the MetaTrader 5, which instantly calculates the working lot for your trade, based on the visual determination of the stop loss through the crosshair. Just click the crosshair function, select an entry point on the chart and drag the crosshair to the stop
MetaTraderマーケットはMetaTraderプラットフォームのためのアプリを購入するための便利で安全な場所を提供します。エキスパートアドバイザーとインディケータをストラテジーテスターの中でテストするためにターミナルから無料のデモバージョンをダウンロードしてください。
パフォーマンスをモニターするためにいろいろなモードでアプリをテストし、MQL5.community支払いシステムを使ってお望みのプロダクトの支払いをしてください。

取引の機会を逃しています。
- 無料取引アプリ
- 8千を超えるシグナルをコピー
- 金融ニュースで金融マーケットを探索