YouTubeにあるマーケットチュートリアルビデオをご覧ください
ロボットや指標を購入する
仮想ホスティングで
EAを実行
EAを実行
ロボットや指標を購入前にテストする
マーケットで収入を得る
販売のためにプロダクトをプレゼンテーションする方法
MetaTrader 4のためのエキスパートアドバイザーとインディケータ - 273

RocketRise EA Key Advantages Congratulations on China's new type of coronary pneumonia being controlled, 50% off from March 1st to March 15th, 2020. The EA is the symbiosis of trading algorithms. Designed for trading major currency pairs,It implements a simple and universal trading strategy which can be applied to any instrument. 1.Fully automated trading 24/5. 2.Can handle deposits of any size. 3.Always use stop loss risk. 4.Use tracking to stop chasing profits. 5.Ability to set the time of

取引を決定する際には、履歴データだけでなく、現在の市場状況にも依存することが有用です。市場の動きの現在の傾向をより便利に監視するために、AIS Current Price Filterインジケーターを使用できます。 この指標は、ある方向または別の方向で最も重要な価格の変化のみを考慮します。これにより、近い将来の短期的な傾向を予測することが可能です。現在の市場状況がどのように発展したとしても、遅かれ早かれ現在の価格はこの指標を超えます。トレーダーの観点から最も興味深いのは、価格がインディケーターレベルから可能な限り移動した状況です。これらの瞬間は、新しい取引ポジションを開くために最も最適であることが判明する可能性があります。 インジケーターの動作は、選択した時間枠に依存せず、2つのパラメーターを使用して構成されます。 FS -感度のしきい値を設定できるパラメーター。値が大きいほど、価格の動きは強くなり、インディケータで考慮されます。その許容値は0から255の範囲にあります。ゼロの値が選択された場合、感度のしきい値は現在の広がりに等しくなります。 LB -インジケーターの計算に使用される

G99 GRAVITY
G99 Gravity is a channel indicator for the MetaTrader 4 terminal. This indicator allows finding the most probable trend reversal points. Unlike most channel indicators, G99 Gravity does not redraw. Attach the indicator to a chart, and the alert will trigger once a signal emerges. With our alerting system, you will never miss a single position opening signal! Advantages of the indicator Perfect for scalping. Excellent for identifying trend reversals. Suitable for beginners and exper


A news scalper ea, suitable for any currency pair whose spread are less than 20 points. - Recommended pair - EURUSD and GBPUSD - Recommended Risk - 40 - Time Frame - 1M - Recommend account - ECN account with VPS is recommended. - It open trade only when news Volatile the market. So have some patience. - It trade at the time of volatile market, so highly recommended to use VPS to avoid slippage. or recommended ping with server is less than 10ms.
Settings : Filter = XX (use 10 for 5 digit pair a

私たちの目標は、アクセス可能で質の高いサービスを提供し、市場参加者、トレーダー、アナリストに、情報に基づいたタイムリーな取引決定のための非常に必要なツールを提供することです。
最も最適化された、非常に堅牢で使いやすいDYJトレンドアナリストインジケーター。
DYJトレンドアナリストは、方向性圧力のタイプごとに1つずつ、2つの別々の測定値を使用して、市場の強気と弱気の力を測定しようとします。
指標のBearsIndexは、低価格に対する市場の欲求を測定しようとします。
指標のBullsIndexは、より高い価格に対する市場の欲求を測定しようとします。
DYJトレンドアナリスト向けのピボットポイント追加インジケーター。
当社のピボットポイントインジケーターは、ピボットポイントとサポートおよびレジスタンスレベルを計算する高度なアルゴリズムに基づいています。
将来の重要な価格レベルと起こりうる市場の逆転の信じられないほど正確な予測。
すべての市場(外国為替、商品、株式、指数など)と時間枠に役立ちます。
特徴
すべてのペアを同時に監視します。 インジケーターはデフォルトでM

Curiosity 11 The Candle Signals It is an advanced trading system. This is a fully automatic Expert Advisor, which allows you to presize the trade according to the preferences of the trader. Curiosity 11 The Candle Signals have more than 260 customization options for your trade. Different options for different styles of trade. Curiosity 11 The Candle Signals is a Trend system of trade with different algorithm of trade mode. This EA using signals to place orders. Is a revolution in the cu
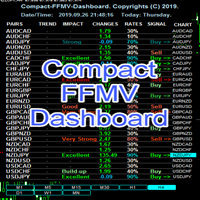
Compact FFMV Dashboard Compact FFMV Dashboard is a little trimmed custom indicator of FULL FOREX MARKET-VIEW DASHBOARD created to give the Traders a full view of what is going on in the market. It uses a real time data to access the market and display every bit of information needed to make a successful trading. It shows as many as 30 currency pairs or as allowed to display in the Market Watch of your MT4 USAGE: For Solo Trading For Basket Trading (See the screenshot on how) For Signal confirmat

Moonwalker MT4インジケーターは、レンコチャートでのトレンド取引戦略を革命的に変える強力なツールです。市場のトレンドを追跡し、高度なアルゴリズムで急な変動や市場ノイズをフィルタリングし、独自の信頼性を提供します。これにより、市場を常に監視するストレスなしに、簡単かつ自信を持って取引できます。 Moonwalkerはリペイントしません。さらに、サウンドアラートとプッシュ通知が搭載されています。 取引を次のレベルに引き上げたいなら、Moonwalkerインジケーターとシームレスに連携するWhoopeeEAが最適です。興味があれば、お知らせいただければWhoopeeEAを共有できます。 しかし、私の言葉を鵜呑みにしないでください。説明動画をチェックして、Moonwalkerの実力を確かめ、トレンド取引の革命に今すぐ参加しましょう!

Each broker uses different parameters for different currency pairs. In addition, each currency pair has its own price movements. Self-Adjusted EA tolerates many of these differences and provides easy operation. Begining capital must be at least 1.000 USD. with standart lots amount 0.01. Default parameters are based on variables commonly used by most brokers and can be used for time frames that are in line with the following currency pairs. If your broker does not give a positive result in this c

One of the disadvantages of the ZigZag indicator when working with advisers is the need to find the latest extremes. For this purpose, various algorithms of history analysis in indicator buffers are used. However, the indicator itself knows these values and can therefore display them. To this target, the ZigZag Minimum indicator ( https://www.mql5.com/ru/market/product/37975 ) has been refined. The zero buffer stores the value of the last maximum. The first buffer stores the value of the last m

インジケータMTFクリスタリウム矢印は、半自動取引システムであります. これは、すべての通貨ペアで動作します。
インジケータは、三つのルールを使用しています:1)我々は唯一のトレンドで取引、2)"誰もが販売しているときに購入し、誰もが買うときに販売する"、3)価格
インジケータMTF矢印は、内蔵の指標を使用して、複数の時間枠全体のクリスタリウムフィルタルール。 トレンドは、選択した時間間隔で一致した場合、インジケータは、市場に参入するための矢印を与えます。 それからあなた自身の決定をする。 購入する-緑の矢印、売る-赤い矢印。 指標では、ロットを変更したり、EAの取引時間とシャットダウン時間を設定することができます。 また、作業期間と時間フィルタを変更することができます。 ビープ音が鳴ってる
推薦された働く期間D1。 フィルタH1とH4。
設定:
TF働く期間(推薦されたD1) Cci_cperiodcomment
CCIレベルアップ
CCIレベルDn CCI価格 SARステップ SAR最大値 TFのFilter1–(推薦されたH1) TFのFilter

持続可能な分布は、金融シリーズをスムーズにするために使用できます。かなり深い履歴を使用して分布パラメーターを計算できるため、場合によっては、このような平滑化は他の方法と比較してさらに効果的です。
図は、10年間のH1時間枠でのEUR-USD通貨ペアの始値の分布の例を示しています(図1)。魅力的ですね。
この指標の根底にある主な考え方は、価格の分散によって持続可能な分布のパラメーターを決定し、データを使用して金融シリーズを平滑化することです。このアプローチのおかげで、平滑化された値は、特定の市場状況で最も可能性の高い価格値になる傾向があります。
インジケータの動作は、パラメータLBを使用して設定されます。その値は、バーで表される平滑化されたシリーズの長さを決定します。また、許容値は1〜255の範囲です。
青い線は平滑化された高値を示し、赤線は安値を示し、緑の線は終値を示します。
このインジケーターの主な欠点は、インジケーターが履歴のすべての部分で等しく安定するように、スムージングウィンドウの幅を設定できないことです。したがって、トレーダーは特定の要件に合わせてパラメーターを選

This EA has been developed for EURUSD M15 TF. It also works very well on EURUSD M30. So you will get 2 strategies for lower price, that means better equity curve, higher profits, lower drawdowns. Everything is tested and ready for immediate use on real account. This Expert Advisor is based on BREAKOUT of the HEIKEN ASHI CANDLES CHANNEL after some time of consolidation. It uses STOP pending orders with ATR Stop Loss . To catch as much profit as possible there is also a TRAILING PR

Recently released !!!! Amazing !!!!! Free indicators for you !!!!!! Win operations with the power of the Macd multi timeframe indicator in a single window. Ideally you can complement it with our Rsi Multiframe to get powerful trades. . Give me 5 stars please Look at our signals made with our indicators. Very profitables - Soon Momentum Multi time frame !!!
https://www.mql5.com/es/signals/620506

Robot automático para compras de Forex. Utiliza las medias móviles para seleccionar los momentos ideales para realizar las compras y las ventas. Se recomienda su uso en Timeframe M15, M30 o H1. No es recomendable el uso en M1 o M5. La equidad mínima recomendada es de 1000$ para garantizar las estabilidad del sistema. Desarrollado por Global Scale Europe desde España.

Basket trading /Basket SL TP Auto SL TP Calc
This utility will calculate SL and TP based on 2 input parameters
PerUnitTP -This means what is per .01 TP like 1 $ per .01 Lot.
SLToTP_Ratio-This what is ration SL to TP if this parameter is 3 that means if TP is 1 $ then SL will be 2$ (per .01 Lot)
so if total portfolio summing to .05 lot that that means TP will be automatically become 5 $ and SL become 10 $.
This is very good utility when you want set SL TP for many open trades or p
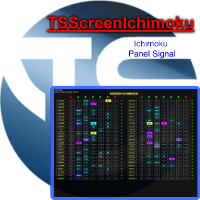
Panel designed for ichimoku traders. Intelligent algorithm that reveals signals over multiple time frames and multiple currency crosses. The benefits you get : Significantly lightens the signal search analysis. Never redesigns, does not retreat, never recalculates. Works on forex, CFD, Crypto and stocks, time frames from M5 to W1. Integrated pop-up, push notification and sound alerts. Easy to use.
Parameters :
Number_Instrument = 10; Number of instruments displayed Tenkan = 9; Kijun = 26;

The indicator ignores sharp fluctuations and market noise and tracks market trends with absolute reliability. It is suitable for trading on small timeframes and on large ones, it ignores sudden price spikes or price movement corrections due to the reduction of market noise around the average price value. For calculations, the indicator uses indicators: iLow, iHigh, iMA, iATR. Since the output signal relies on reliable indicators, it is also reliable. You can configure both a sound signal and se

MonsterBot is a multi-currency advisor with a trending strategy. There are 9 currency pairs in operation. The adviser works purely on the trend and accumulates orders mainly on the trend. MonsterBot has wide functionality, is very flexible in settings, and also has a trading panel for managing the trading process.
Attention! Testing is fundamentally different from real-time trading, because the tester does not allow you to trade 9 pairs at once.
Description of parameters: Languale ……………………………
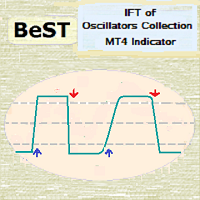
BeST_IFT of Oscillators Collection is a Composite MT4 Indicator that is based on the IFT (Inverse Fisher Transformation) applied to RSI , CCI , Stochastic and DeMarker Oscillators in order to find the best Entry and Exit points while using these Oscillators in our trading. The IFT was first used by John Ehlers to help clearly define the trigger points while using for this any common Oscillator ( TASC – May 2004 ). All Buy and Sell Signal s are derived by the Indicator’s crossings of the Buy or

MTF顧問クリスタリウム平均はプログラマーアレクサンダー Gavrilinと一緒に作成されました。 このシステムは十分に自動化される。 マーチンゲールじゃない ここで働くの平均。
これは、すべての通貨ペアで動作します。
EAは、三つのルールを使用しています:1)私たちは、トレンドにのみ取引、2)"誰もが販売しているときに購入し、誰もが買うときに販売する"、3)価格は常に
MTFのQristaliumの平均は作り付けの表示器を使用して多数の時間枠のこれらの規則をろ過する。 市場と傾向は経済的および政治的ニュースの影響を受けているので、EAは設定SL(私は100をお勧めします)で無効にして有効にすることができる平均 EAでは、ロットを変更することができます,テイク利益の大きさを設定します(TPは損益分岐点から計算されたとき-あなたはまた、設定に変更するこ また、作業期間と時間フィルタを変更することができます。
推薦された働く期間D1。 フィルタH1とH4。 100を平均するステップ。 預金1000$、ロット0.01
設定:
作業時間 修正ロット(推奨0.01/1
EA trades pairs selected by correlation criterion. The choice is made in such a way that there are pairs with negative and neutral correlation to the main pair. The PAC indicator is used to automate the selection of pairs https://www.mql5.com/en/market/product/41985 Expert is multycurrency, thus it is no use to test it in the MT4 terminal. So, watch for real signal and joing to telegram channel. After setting the pairs, the expert Advisor simulates trading for the previous period with visualiz

Basket trading /Basket SL TP Group Trade SL TP
This is very good utility when you want set SL TP for many open trades or portfolio
As soon your account equity reach SL or TP , This EA will close all trades . you are allowed to change SL and TP any time.
Also you need not to monitor group trades all the time you just set SL and TP in utility and relax once SL / TP situation will come all trades will be closed.
SL and TP are in $Amount like 100$ SL and 500$ TP so once your profit reaches 500

This indicator will provide you with everything you need in order to overcome losses due to human emotions. The indicator determines the moments of a trend reversal and the direction of its movements. This development is equipped with the most modern, adaptable trading algorithms. The main secret of short-term trading is to have information on when to enter a deal. The indicator works great on all timeframes and informs the trader about the most successful moments of buying or selling a currency

Automatic marking of the chart with Pentagram models. This model is based on the Expansion Model from Adversa Tactics. Designed to determine the trend and predict possible levels and targets of price correction in the future. The model describes a developing trend. The trend is relevant until the price crosses the trend line of the model in the opposite direction. Levels of rays of the pentagram, level of HP, distances of 100% and 200% of the distance between points 1-4, levels of HP are possibl

このEAは、マーチンゲールを使用せずに注文を入力するように設計されており、このEAは指定された通貨ペア用に特別に設計された特別なフィルターを使用し、MACD以外の他のタイムフレームとの直接関係も使用します。
トレーダーが希望する場合は、反対方向の動き(逆方向)の入力機能があります。ポジションは、ストップロスと価格に基づく静的なテイクプロフィットによってプロットされます。
操作:
通常の変動スプレッドブローカーと連携し、通常は以下の通貨ペアで最適に機能します。各ブローカーは異なる流動性プロバイダーを使用するため、最初にデモ口座で実行して、ブローカーに最適な通貨ペアを確認することをお勧めします。およびソフトウェアサービス。
特徴:
以下の通貨で予定されています: 期間:M30およびH1 通貨ペア: USD/CHF, GBP/USD, EUR/USD, USD/JPY, USD/CAD, AUD/USD, EUR/GBP, EUR/AUD, EUR/JPY, NZD/USD.
テイクプロフィットとストップロス機能を利用してください。 4〜
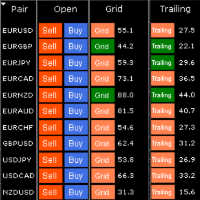
HungrySpiderMulti - is an easy-to-use multi-currency trading panel allowing you to trade 28 trading pairs in one window . The panel also allows you to use grid, and trailing stop. Using this panel trader will receive a push-notification about new events.
Opening an order: Opening an order occurs in one click. Near the required currency pair, in the Open section, click on the Sell or Buy button. Grid: Near required pair, there is a Grid button. The button has two states, green - on, orange - off

This Indicator calculates based on the Stochastic, Fractal and ZigZag the best possible entries in all timeframes.
Input Stochastic Oscillator K line period = standard is set to 10
D line period = standard is set to 3 slowing = standard is set to 4 Method = stadard is set to Linear weighted Price value = standard is set to close/close
ZigZig settings Depth = standard is set to 24 Deviation = standard is set to 5 Backstep = standard is set to 3 Bar filter = staard is set to 35
Alarm setting

1.马丁策略 2.程序在某些安全指标策略判断下开首单 3.建议起始手数0.02,最大交易单数不超过10单,起始资金为10000美元 4.本策略目标在于快速稳定止盈,盈利到一定程度后将本金提取出来,防止黑天鹅事件 5.建议交易的货币对EURUSD,AUDUSD,USDCHF,NZDUSD,高风险爱好者可以交易GBPUSD,不支持XAUUSD 6.注意手工交易同一种货币的时候,手动平任何一单,程序会自动全平所有该货币的订单 7.参数设置 TakeProfit = 30.0;//止盈点数 InitLots = 0.1;//最小起始手数 InitialStop = 0.0;//初始止损,设为0没有止损,建议设置为0 TrailingStop = 16.0;//追踪止盈 MaxOrderTrades =6;//最大交易单数 Pips = 16;//开单距离 SecureProfit = 100;//快速止盈方案盈利金额,大于则马上全平 AccountProtection = 1;//1表示开启快速止盈方案 OrderstoProtect = 3;//当交易单数大于多少的时候,启动快速止盈方案

This is the FXTraderariel ATM Indicator - the best trend indicator we ever created. It shows different trend perfect and supereasy to Spot. Depending on the settings and trading style, it can be used for scalping or long-term trading . The indicator can be used on every time frame , but we advise to use it on , H4 and D1 . Especially if you are a novice trader. Pro Traders can also you use it for scalping in smaller timeframes (M1, M5 and M15). This indicator is not a complete trading s

This indicator is based on the standard MACD indicator, but showing the changes up and down colored. It is a nice assistance to visualize our Expert MAGIC MACD.
MAGIC MACD MT4: https://www.mql5.com/en/accounting/buy/market/41144?period=0 MAGIC MACD MT5: https://www.mql5.com/en/accounting/buy/market/41151?period=0
Inputs in the Indicator: Fast EMA: standard is 12 Slow EMA: standard is 26 Signal: depending on what you want to see. For the MAGIC MACD the standard is 1
in common settings: Fixed M

This is fully automatic expert advisor, based on professional trend trading strategy. This EA is build to trade on D1 time frame, so it is long term trader, trades can last for days even months. It analyze the trend and enter the trades on swing points at support/resistance, it can add positions on same signal, exit is based on stop loss by pips or take profit at support/resistance. This is safe trading where you can menage your risk, and for those who like big risks there is martingale option

This is utility for Closing All trades or Closing All Buy Trades Or Closing All Sell Trades based on button clicked. Advantages and features of Product is as follows Closes trades very fast customised based on traders frequently encountered situation .This is very simple utility which can be used by beginner or advanced trader . Trader just need click button like "Close All" "Close Buy" Or "Close Sell" and their request is executed.

This indicator gives signals about a trend change, shows successful signals. High probability of a successful trend, it can be used with an optimal risk to profit ratio. The indicator does not redraw and is not late; it can be used both for piping on small periods and for long-term trading. The indicator algorithm works using open prices, and you can work with a zero bar. It works on all currency pairs and on all timeframes.

A simplified version of the ForexGump robot for the GBPUSD currency pair. The robot can trade on other currency pairs, but the default settings are on GBPUSD. In general, the trading strategy is based on the ForexGumpUltra + RSi indicator. The robot automatically determines the most effective entry points into the market and opens a buy or sell order in the direction of price movement. If a deal is closed at a loss, the robot remembers the market conditions under which it was opened and later th

The Overnight EA is a fully automated trading Expert Advisor, which uses technical analysis to take decisions based on various signals. It is originally intended to be used in the late hours of the night, where volatility is low, where we could scalp a few pips and avoid large drawdowns, however it could be used during any time of the day. Overnight EA is designed to have a very high winning ratio, and low drawdowns. It averages between 5-7% monthly with a fixed lot size. Using a VPS to run the

KT Bollinger Bands Trader は、ボリンジャーバンドを使った平均回帰戦略に基づき、低ボラティリティ期間中に自動で取引を行う 100% 自動化されたエキスパートアドバイザー(EA)です。価格はボリンジャーバンドの上部または下部ラインに反応することが多いですが、必ずしも反転するとは限りません。ただし、低ボラティリティの時期には反転の可能性が高くなります。
エントリー条件 価格がボリンジャーバンドの下部ラインを正しく下回ると、買い注文が発動されます。 価格がボリンジャーバンドの上部ラインを正しく上回ると、売り注文が発動されます。 エグジット条件 低ボラティリティ期間の終了時にポジションをクローズします。 ストップロスまたはテイクプロフィット到達時にも決済されます。 このEAは、人気のあるボリンジャーバンド戦略に多くの改良を加えたもので、トレンドフィルター、ボラティリティフィルター、Vortex、MMI、曜日別フィルターなどの組み込みフィルターを使用して戦略を細かく調整できます。
入力パラメーター
----- ストラテジー設定 ----- ボリンジャーバンドの期間、シ

It can be used as an independent trading system. It is based on the idea that some currency pairs follow one another. The indicator allows you to simultaneously display several other charts on the chart of one currency pair, which allows you to anticipate some movements and fairly accurately determine the beginning of trends. The principle of trading according to indicator signals is also simple: you need to sell a currency pair whose chart is higher, and buy the lower one.

Close ALL Mobile is a trading tool that allow MT4 Mobile App users to close floating orders via mobile using pending order in tricking closing functions. Parameter Magic Number for Maual Trades (Defult = 0)
Magic Number for EA1 Magic Number for EA2 Magic Number for EA3 Slipage for closing order Close All BUY Positions: Type of Pending order trick Close all BUY positions function Close All SELL Positions: Type of Pending order trick Close all SELL positions function Close ALL Positions: Type of

This EA is a hedging EA. So, please make sure your broker supporting this rule. Works well on ANY PAIRS. WARNING! MARTIANGLE tactic used. Martiangle can boost your money very fast, BUT Martiangle can also be a dangerous strategy since it is increasing size by the time. That's why we recommend: - Please use as small as possible lot at start; recommended: 0.01 lot for $1000. - RangeOP : set this value with the 1/4 of average daily candle range - MaxOP : this value handle maximum running positions

This indicator will provide you with everything you need in order to overcome losses due to human emotions. The indicator determines the moments of a trend reversal and the direction of its movements. This development is equipped with the most modern, adaptable trading algorithms. The main secret of short-term trading is to have information on when to enter a deal. The indicator works great on all timeframes and informs the trader about the most successful moments of buying or selling a currency

Automatic trading Advisor .Refers to the breakdown scalping robots .Traded pairs EURUSD and GBPUSD .The EA places pending orders at price levels where strong recoilless movements are likely to occur.All trades have a fixed stop loss and take profit .Orders are closed either by take profit or by trailing stop.For successful trading, a broker with the narrowest possible spread is recommended . To use the VPS server is a must! Testing was performed on tick data with modeling quality 99.9 %, using

Atila Expert Advisor passes the test from 1999 to the current day! The EA works during the night flat on the eurusd currency pair M5 timeframe!
It opens a maximum of 2 positions per day (the second position doubles the lot), transactions are usually less than a day on the market! The robot controls the volume of trading positions, slippage, spread expansion, trading time, maintains and protects open orders, works with a deposit of $ 100 or more!
Trading takes place mainly during periods of

The indicator monitors the market trend with very high reliability. Sharp price fluctuations, as well as noise around averaged prices, are ignored. All intersection points will be ideal points at which the direction of the trend changes. Signal points, places where color changes, can be used as points of potential market reversal. This development can be used both for long-term trading, and for piping on small periods. The indiuctor algorithm implements a kind of technical analysis based on the

Heraclitus is a trend-following intraday trading robot engineered to find promising reversal points to enter the market. This product works with EURUSD symbol on M1 timeframe and MUST NOT be used in combination with others EA on the same account to avoid interferences in automatic trading decisions. KEY FEATURES Fully-automated Autolots Trailing stop Flexibile trade management Works also with minimum lot size Risk can be controlled by input parameters
TRADE MANAGEMENT POLICY PARAM
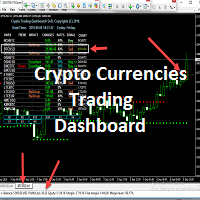
Micro Crypto Trading Dashboard
This is a custom indicator created to give CRYPTO TRADERS a full view of what is going on in the Crypto market. It uses a real time data to access the market and display every bit of information needed to make successful trading. This is a Micro size of the Compact Crypto Market Trading Dashboard Indicator created mainly for trading Crypto Currencies Markets for a living.
They practically perform the same operation but MicroMini FFMV Dashboard has a few features.
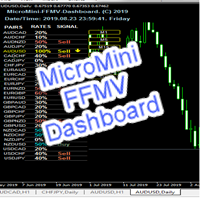
MicroMini FFMV Dashboard This is a custom indicator created to give Traders a full view of what is going on in the market. It uses a real time data to access the market and display every bit of information needed to make successful trading. THIS IS A MicroMini size of the FULL FOREX MARKET VIEW DASHBOARD INDICATOR. This is for those who don't like the Indicator to cover all the charts and for those who don't like BOGU S things. They practically perform the same operation but MicroMini FFMV Dashb
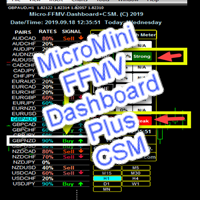
MicroMini FFMV Dashboard+CSM This is a custom indicator created to give Traders a full view of what is going on in the market. It uses a real time data to access the market and display every bit of information needed to make successful trading. To add value to the trading operation, Currency Strength Meter is added to it in order to consolidate the effective work of this indicator.
THIS IS A MicroMini size of the FULL FOREX MARKET VIEW DASHBOARD INDICATOR with CSM added. This is for those who d

Introducing the trend indicator! Ready trading system. The principle of the indicator is to automatically determine the current state of the market when placed on a chart. The indicator analyzes market dynamics for pivot points. Shows the favorable moments of entering the market with stripes. Can be used as a channel indicator or level indicator! This indicator allows you to analyze historical data, and on their basis display instructions to the trader on further actions. To find out how to dete
DPOMASimple (DetrendPrice Oscillator) is an indicator that removes the price trend, in order to observe the cyclical movements of the price without the noise of the trend, the DPOMASimple indicator can be used to determine support and resistance levels in the peaks and valleys or as trading signal whe cross 0 level.
DPOMASimple > 0 -> Buy. DPOMASimple < 0 -> Sell.
Markets in range: Maximum and minimum will be the same as in the past. Set the overbought and oversold levels based on

NewsReady is a semi-automated Expert Advisor that uses a smart straddle methods It needs to be set in charts 2 to 10 minutes before Economic Data release with a red-flag impact on currencies related to the news. Then it run pending orders in specified number of minutes indicated in the time-period parameter. After the specified time, it will stop trading and will remove all pending orders. Important
You can not backtest this tool because it is semi-automated and can only be set and run a few min

Advisor FU PULSAR - is a scalper with high accuracy of market entries. The EA is able to work with medium spreads (for testing we used a spread of 20 points on GBPUSD), it is not critical to slippage, and it is also not demanding on trading conditions. It uses Stop Loss as protection for orders, and uses virtual trailing stop as a percentage of the balance as order support. It does not open orders often but as accurately as possible.
FU PULSAR does not use indicators. The algorithm contains a

Общие сведения Classic - это сеточный эксперт следующий строгим правилам торговли. Главное отличие от сеточных экспертов имеет фиксированный Stop_Loss каждого ордера! Использовать на периоде M1. Для начала торговли достаточно небольшого депозита. Мультивалютность. Невосприимчивость к большой задержке и величине спреда. Работает только со своими ордерами.
Рекомендации Рекомендую использовать мультивалютную торговлю. Для этого запустите советника на разных валютных парах!!! Если ваш копмьютор сла

This Expert Advisor is designed to enter orders according to trend parameters of other TimeFrames, MACD and Moving Averages as well as the characteristics of each currency pair to assist in the decision to invest. It has the possibility to enter the market in the opposite direction of movement (reverse). Position is plotted by a stoploss and static takeprofit, based on price..
Operation : You work with regular variable spread brokers and generally work best on the currency pairs below, so it i
This EA has been developed for EURUSD M15 TF. It also works very well on GBPUSD M15. So you will get 2 strategies for lower price, that means better equity curve, higher profits, lower drawdowns. Everything is tested and ready for immediate use on real account. This Expert Advisor is based on BREAKOUT of the LOWEST CHANNEL after some time of consolidation. It uses STOP pending orders with FIXED Stop Loss and FIXED Take Profit . To catch as much profit as possible there is also a TRA

A trend indicator, the main direction of which is to display the possible direction of price movement. The price reversal occurs with the same patterns on the indicators. The indicator shows the possible direction of price movement. Signals are generated on the previous bar. Red Coogie - the signal is considered unconfirmed. The indicator works best on timeframes H1, H4 and D1.
This is one of the few indicators that can signal strength and direction, which makes it a very valuable tool for tra

Fully automated expert Advisor belongs to the category of night scalpers traded EURCHF,USDCHF,and GBPCAD with the M15 ,in the principle of operation of the robot laid down the simplest strategy based on price breakout from Bollinger Bands to definitely watch specified,the remaining parameters of the trading algorithm is classified. To get true results ,it is desirable to test the EA on tick data. *Does not use dangerous trading strategies such as martingale and averaging *Minimal deposit 100$ *

Monitoring of real trading on this system https://www.mql5.com/ru/signals/632726 Guru Pro Signal does not repaint! Guru Pro Signal is an original indicator, developed for the work of employees of one of the large funds! It is the best tool that can be added to your chart!
Guru Pro Signal signals about price reversal with the highest degree of accuracy, the best tool for both scalping and position trading. The entry signal is shown by the BUY and SELL arrows. It is possible to receive notif

Royal Ace Signal 3 MA The Royal Ace Signal 3 MA indicator tracks the market trend with combine 3 MA. Amazingly easy to trade The indicator needs no optimization at all It implements a multi-timeframe dashboard The indicator is non-repainting
Anatomy of the Indicator The Royal Ace Signal 3 MA indicator displays a colored arrow. If the arrow is gold you should be looking for long trades, and if the arrow is red, you should be looking for short trades. Use this indicator in H1, H4 timeframe o

Just $30 for six months!!!. This will draw Supply & Demand zones just by clicking on a candle. It can also draw the mean threshold of the zone. https://youtu.be/XeO_x7cpx8g
As a drawing tool, it is not active all the time after adding it to the chart.
Activate by pressing 's' twice on the keyboard within a second. If activated but then decided not to draw, deactivate by pressing 's' once. Box color depends if candle is above or below current price.
Settings/Inputs: Number of candles the box

Just $30 for six months!!!. This will draw Order Blocks just by clicking on a candle with different colors for different timeframes. It will use the body or the wicks. It can also draw the mean threshold of the candle open/close or high/low.
As a drawing tool, it is not active all the time after adding it to the chart.
Activate by pressing 'b' twice on the keyboard within a second. If activated but then decided not to draw, deactivate by pressing 'b' once. Box color depends if candle is abov

Just $30 for six months!!!. This will draw Order Blocks just by clicking on a candle. It will use the body or the wicks. It can also draw the mean threshold of the candle open/close or high/low. As a drawing tool, it is not active all the time after adding it to the chart. Activate by pressing 'b' twice on the keyboard within a second. If activated but then decided not to draw, deactivate by pressing 'b' once. Box color depends if candle is above or below current price. Settings/Inputs: Number

Tortoise Master Professional このエキスパートマスターは、他のタイムフレームのトレンドパラメーターに従って注文を入力するように設計されており、MACD、移動平均、および各通貨ペアの特性をパラメーターとして使用して、投資の意思決定を支援し、反対方向に市場に参入する可能性があります。 動きの(逆)。 ポジションは、ストップロスと価格に基づく静的なテイクプロフィットによってプロットされます。
運営: Tortoiseは通常の変数スプレッドブローカーで機能し、通常は以下の通貨ペアで最適に動作します。各ブローカーが異なる流動性プロバイダーを使用しているため、最初にデモアカウントで実行してブローカーに最適な設定を確認することをお勧めします。 およびソフトウェアサービス.
特徴: 以下の通貨で予定: 期間: M30 e H1 通貨ペア: USD/CHF, GBP/USD, EUR/USD, USD/JPY, USD/CAD, AUD/USD, EUR/GBP, EUR/JPY,
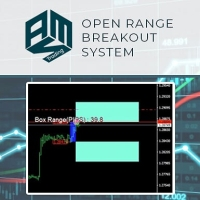
This Expert Advisor implements the Range Breakout Strategy, a simple yet effective short-term trading strategy. Easy to use and supervise Fully configurable settings Customizable break-even, SL, TP Built-in money management Works for ECN/Non-ECN brokers Works for 2-3-4-5 digit symbols Trading is FIFO (NFA) Compliant
The Range Breakout Strategy Using this strategy, the trader places a buy stop/limit just above the open price of your defined range and a sell stop/limit just below the open price.

Growth 651% dd only 21.62% Top 4 best EA's on mql5 for 3 years! This ea trades every day and non-stop, if you purchased i will provide settings and full support.
Because mt4 only has max 1 pair to backtest and this ea trades with correlation pairs! Therefore, a separate real account is attached to the product, where you can constantly monitor all trading results

This expert works with several indicators Rasai and Mollinger Band and also depends on certain models of candles and that the success rate of the deal more than 90% and also contains strict capital management works based on the correct rate of capital management is correct in addition to the success rate is good Try it yourself The result is communicating with me.

Super grid nineth (ninth) generation is another grid type EA on this huge forex system population, this EA not using any indicator to avoid any fake signaling to open or closing position orders. This EA will open pending order stop and limit in the first time EA run, then maintain all opened order with unique way to balancing account free margin and make equity growth. This EA have unique system not like anyother grid EA, with correct setup and run on max 3 pairs in one account, this EA capable
Mars 11 is a Trend indicator is a powerful indicator of FOLLOW DIRECCTION for any par and any timeframe. It doesn't requires any additional indicators for the trading setup.The indicator gives clear signals about opening and closing trades.This Indicator is a unique, high quality and affordable trading tool. Can be used in combination with other indicators Perfect For New Traders And Expert Traders Low risk entries. Never repaints signal. Never backpaints signal. Never recalculates signal.

Are you a trend trader tired of noise, spikes and whipsaws? The Royal Ace Signal Bar indicator tracks the market trend with an unmatched reliability, by ignoring sudden fluctuations and market noise around the mean price. It allows you to be steady when everyone else is shaky. Amazingly easy to trade The indicator needs no optimization at all It implements a multi-timeframe dashboard The indicator is non-repainting
Anatomy of the Indicator The Royal Ace Signal Bar indicator displays a col
MetaTraderマーケットが取引戦略とテクニカル指標を販売するための最適な場所である理由をご存じですか?宣伝もソフトウェア保護も必要なく、支払いのトラブルもないことです。これらはすべて、MetaTraderマーケットで提供されます。
取引の機会を逃しています。
- 無料取引アプリ
- 8千を超えるシグナルをコピー
- 金融ニュースで金融マーケットを探索
新規登録
ログイン