YouTubeにあるマーケットチュートリアルビデオをご覧ください
ロボットや指標を購入する
仮想ホスティングで
EAを実行
EAを実行
ロボットや指標を購入前にテストする
マーケットで収入を得る
販売のためにプロダクトをプレゼンテーションする方法
MetaTrader 4のための有料のテクニカル指標 - 60

Does your trading consist of Multiple EA's, Multiple time frames an no clear indication of how each individual strategy or time frame is performing, then this indicator will help. Assign the EA Magic number to this indicator and track it's performance on the chart by selecting on chart the period, today, week, month year or all history to view. Easy visual colour changing header to display the performance of the EA for the respective periods. Minimize the panel to reduce chart clutter. Add yo
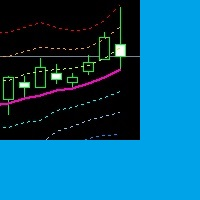
A Channel and Trend indicator. You set as you want. You can use at all timeframe. You can use for martingale,scalping and tunnel strategies. I set some number for me, but you can change this number as you want. You can use this indicator for your expert advisor apps. if you want another features i can do it for you.
Input Values: 1.) Last_Candle : Last candle for display indikator. 2.) X_Price : Price of indicator. 3.) MA_Period : Period for Moving Average. 4.) MA_Method : Method for Moving Av
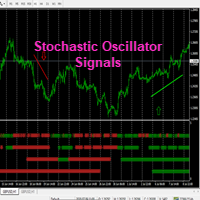
Hello This Indicator will draw Green (Up) and Red (Down) small arrows from Multi TimeFrames based in ( Stochastic oscillator ) to help you to take decision to buy or sell or waiting If there 4 green arrows in same vertical line that's mean (Up) and If there 4 Red arrows in same vertical line that's mean (Down) and the options contain (Alert and Mobile , Mail Notifications). Please watch our video for more details https://youtu.be/MVzDbFYPw1M and these is EA for it https://www.mql5.com/en/ma

An arrow is formed on the current candle and indicates the direction of the next candle and the possible direction of the trend in the future.
The signal can sometimes drop out.
The trade is entered at the Next candlestick. .
its advantages:
accuracy of signals. complete absence of redrawing. You can choose absolutely any tool. the indicator will provide many profitable and accurate signals there is alert, push, email of seeing ... no need to pile up a live chart with different indica

This multi time frame and multi symbol indicator alerts about Heiken Ashi Smoothed color changes. As a bonus it can also scan for Hull Moving Average trend (color) changes. Combined with your own rules and techniques, this indicator will allow you to create (or enhance) your own powerful trading system. Features
Can monitor all symbols visible in your Market Watch window at the same time. Apply the indicator to just one chart and instantly monitor the entire market. Can monitor every time frame
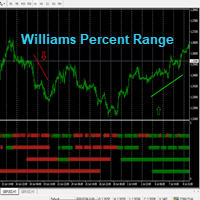
Hello This Indicator will draw Green (Up) and Red (Down) small arrows from Multi TimeFrames based in ( Williams Percent Range ) to help you to take decision to buy or sell or waiting If there 4 green arrows in same vertical line that's mean (Up) and If there 4 Red arrows in same vertical line that's mean (Down) and the options contain (Alert and Mobile , Mail Notifications). Please watch our video for more details https://youtu.be/MVzDbFYPw1M and these is EA for it https://www.mql5.com/e
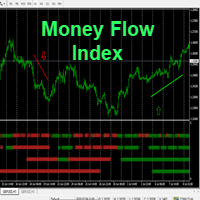
Hello This Indicator will draw Green (Up) and Red (Down) small arrows from Multi TimeFrames based in ( Money Flow Index ) to help you to take decision to buy or sell or waiting If there 4 green arrows in same vertical line that's mean (Up) and If there 4 Red arrows in same vertical line that's mean (Down) and the options contain (Alert and Mobile , Mail Notifications). Please watch our video for more details https://youtu.be/MVzDbFYPw1M and these is EA for it https://www.mql5.com/en/market/p

FXC iRSI-DivergencE MT4 Indicator
This is an advanced RSI indicator that finds trend-turn divergences on the current symbol. The indicator detects divergence between the RSI and the price movements as a strong trend-turn pattern.
Main features: Advanced divergence settings
Price based on Close, Open or High/Low prices Give Buy/Sell open signals PUSH notifications
E-mail sending Pop-up alert Customizeable Information panel Input parameters: RSI Period: The Period size of the RSI indicator.
R

This is simple profitable system I have been using to trade for over 10 years.
You do not need many indicators on your charts to be successful as a trader. Just find the right strategy that has been proven over time and stick to it. You are not only buying trading system when you buy my product but also mentorship. You will become one of the members of my close trading group on Telegram where you will learn how to manage your trading career and become a discipline trader who makes consistent

Trading is about waiting for the right time. This indicator was created to know what is happening on our charts without having to cover the screen with indicators. In addition, it has several types of alerts that allow us to dedicate our time to other things until something interesting happens. You can use multiple alarms at the same time. It is not a problem. By default AlterAlert offers us alerts when the following indicators give us a signal:
Moving average (MA crosses) Stochastic Oscillat

Индикатор ищет дивергенции по индикаторам: MACD, RSI,CCI,Stochastic,OsMA,RVI. По клику на сигнальную кнопку осуществляется переход на график с
сигналом. Для каждого индикатора применяется свой шаблон. Цифры на сигнальных кнопках указывают расстояние в барах от сигнала. Прокрутка
(scrolling) панели осуществляется клавишами "UP" "DOWN" на клавиатуре.
Входные параметры
Lists Of Currencies To Search For Divergences - Список торговых инструментов.
General Setting - Общие настройки панели.
T

There are 8 types of this indicator. Consisted of 1. Bullish and Bearish Engulfing 2. Morning and Evening Star 3. Three Green Soldiers and Three Red Crows 4. Three Inside Up and Down 5. Three Outside Up and Down 6. Bullish and Bearish Harami 7. Tweezers Top and Bottom 8. Piercing and Dark cloud cover
Signal Filter :: 1. The appearance of the candle stick 2. SMA 3. 2EMA :: EMA Fast and EMA Slow 4. RSI
N otification :: 1. Via screen 2. Email 2. Phone
For trading 1. Scaling 2. Binary options

The indicator identifies two most important patterns of technical analysis - Pin Bar and Engulfing. MT5-version https://www.mql5.com/en/market/product/53701 Settings: Mincandle size for PinBar - The minimum size of the Pin-Bar candlestick; Percentage of candle body on size - The percentage of the candle body in relation to its length; PinBar Alert - Alert when a Pin-Bar is detected; PinBar Mail - Sends an email when a Pin Bar is found; PinBar Notification - Sends a push notification when a Pin

Индикатор высчитывается по сложному авторскому алгоритму. Он строится с учетом тенденции по зонам перекупленности перепроданности объёмов . Это позволяет выявлять дивергенцию объёмов , выявить так называемые приседающие бары. Также он определяет уровни входа в рынок и цели. Средняя линия канала является предполагаемым уровнем отката.
RPeriod- период расчета индикатора
Indicator_Level - уровень зон перекупленности перепроданности
Draw Fibo Levels - отображаем целевые уровни
Fibo Level Col

【説明】
エントリーポイントインジケーターは、買い/売りのエントリーポイントとして上/下矢印を表示します。 EMA、MACD、プライスアクションに基づくシグナル。
赤い矢印は、それが売る良い機会であることを意味します。 緑の矢印は、購入する良い機会であることを意味します。 [警告と推奨事項]
外国為替およびレバレッジド金融商品の取引には重大なリスクが伴い、投資した資本が失われる可能性があります。失う余裕がある以上の投資をしてはならず、関連するリスクを完全に理解する必要があります。レバレッジ商品の取引は、すべての投資家に適しているとは限りません。 過去の実績は将来の結果を保証するものではありません。 誰も将来を予測することはできませんが、成功する予測システムを構築するために履歴データを分析することしかできません。 リスク管理は非常に重要です。 ライブアカウントでインジケーターを使用する前に、デモアカウントでインジケーターをテストすることをお勧めします。 Stop Loss、Trailing Stop、Trailing Stop withBreak-Evenの使用をお勧めします。
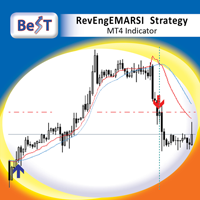
BeST_RevEngEMARSI Strategy is an MT4 Indicator that is based on the indicator RevEngEMARSI by Giorgos Siligardos that was presented in his article " Reverse Engineering RSI (II) " ( TASC_Aug 2003 ) as a new variation of his inverse-RSI indicator and which transforms the Exponential moving average of RSI into a curve in the price graph, simplifying the price projection method and improving its visual representation. BeST_RevEngEMARSI Strategy while implementing the crossings with its Moving Aver

Retracement Hunter This Indicator based on powerfull daily levels . support and resistance, Buy / Sell entries which is more based on low risk and high reward and winning ratio, Enter trade when you get popup alert , book profit on target1, target 2, target3 levels, most of the trending days it will hit target3, but its always safe to book partial at target1 or target2
Buy best entry when rule 1) look for Buy 2) Emas aligned less than 0.25 3) Main Ema aligned Buy , it will alert when all t

This indicator is an upgrade of traditional MACD on MT4. Macd Base line cross above Macd signal line the color of histogram change is red color and entry order Sell. Macd Base line cross below Macd signal line the color of histogram change is green color and entry order Buy.
For above histogram of Macd can change color to good looking by can change color above zero line and lower line.

Trading is a trade war. So a trader is a warrior. A warrior needs to be armed with a weapon
This Binary Star Wars Pro is your workout routine. That can accelerate the results precisely
Who deserves this kind of precision weapon? 1. People who want to profit. From binary options trading 2. Those who want to trade short, profit fast 3. People who want long-term Can be done 4. Newbie can use it. 5. Old hands can be used very well.
How it works It works very easy. For binary options Time fra
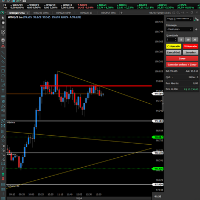
O indicador DonForex é uma das ferramentas mais utilizadas para traçar suporte e resistência automaticamente. Ele traça os melhores níveis de suporte e resistência do gráfico em qualquer tempo. Isso ajuda você a ter uma visão mais amplas para fazer suas operações
As linhas pontilhadas são os pontos mais tocados pelo preço formando assim uma região de suporte ou resistência. Ele também traça automaticamente linhas de tendências de alta (LTA) ou de baixa (LTB) nos dando oportunidade de compra e
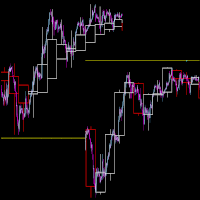
This indi lets you plot higher time frame candle stick (Japanese Candlestick or Heiken Ashi Candlestick). This indicator could greatly help your trading style either its scalping, day trading or swing trading as it shows you the higher time frame candlesticks activity while you are about to pull a trigger on your trade. The candlesticks will only appear on a time frame that is lower than the higher time frame. It won't draw if the current time frame is equal to or higher than the time frame set
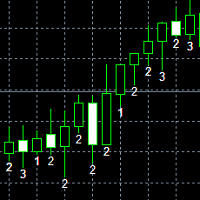
Rob Smith's is a trading method developed over a 30 year career in the market. TheSTRAT is a multi-timeframe strategy that has three major components: Inside Bars - Inside Bars occur when the current candle falls completely within the prior candle. Directional Bars - Directional Bars occur when the current candle takes out one side of the prior candle. Outside Bars - Outside Bars occur when the current candle takes out both sides of the prior candle. #thestrat

This indi shows the following 1. Supertrend 2. Alligator (Not a regular alligator)
3. ZigZag 4. Moving Average 5. Trend Continuation/Mini correction Signal (plotted in X) (See screenshots in green background color
6. Early Signal Detection (See screenshots in green background color)
You may treat Alligator as the lagging indicator
The leading indicator is the supertrend. The zig zag is based on the leading indicator where it gets plotted when the leading indicator got broken to the opposite.

This advisor enters the market at the opening of London Market . It has a automatic function that give buy (arrow up green) and sell (arrow down red) signal when the indicator met high probabilities requirements.Once the signal is generated it is the trader discretions to start the order button and do trade manually. Stop loss are base on ATR. Recommended Take profit is 20pips. The trading system is suitable for both experienced traders and beginners.
Monitoring and proof of wins : https

For this set of indicators 1. General information - Calculates with high performance mathematical algorithms. - Calculated from the price of candles - The entry point of this order is filtered by the train EMA and the oscillator. - Calculate the integrity of the candle
2. How does it work? - You can see two types of order entry points: the notification on the monitor and the arrow. - You can trust 75-95 percent of this entry point.
3. Settings - A complete candle

For this set of indicators 1. General information - Calculates with high performance mathematical algorithms. - Calculated from the price of candles - The entry point of this order is filtered by the train EMA and the oscillator. - Calculate the integrity of the candle
2. How does it work? - You can see two types of order entry points: the notification on the monitor and the arrow. - You can trust 75-95 percent of this entry point.
3. Settings - Retracement is re

For this set of indicators 1. General information - Calculates with high performance mathematical algorithms. - Calculated from the price of candles - The entry point of this order is filtered by the train EMA and the oscillator. - Calculate the integrity of the candle
2. How does it work? - You can see two types of order entry points: the notification on the monitor and the arrow. - You can trust 75-95 percent of this entry point.
3. Settings - A complete candle

For this set of indicators 1. General information - Calculates with high performance mathematical algorithms. - Calculated from the price of candles - The entry point of this order is filtered by the train EMA and the oscillator. - Calculate the integrity of the candle
2. How does it work? - You can see two types of order entry points: the notification on the monitor and the arrow. - You can trust 75-95 percent of this entry point.
3. Settings - A complete candle

For this set of indicators 1. General information - Calculates with high performance mathematical algorithms. - Calculated from the price of candles - The entry point of this order is filtered by the train EMA and the oscillator. - Calculate the integrity of the candle
2. How does it work? - You can see two types of order entry points: the notification on the monitor and the arrow. - You can trust 75-95 percent of this entry point.
3. Settings - A complete candle

For this set of indicators 1. General information - Calculates with high performance mathematical algorithms. - Calculated from the price of candles - The entry point of this order is filtered by the train EMA and the oscillator. - Calculate the integrity of the candle
2. How does it work? - You can see two types of order entry points: the notification on the monitor and the arrow. - You can trust 75-95 percent of this entry point.
3. Settings - A complete candle

This indicator displays support and resistance at fixed levels. The level won't change regardless how many days or minutes has gone by. There are 7 levels start from green ends at gray color. Imagine it like do (green),re,mi,fa,sol,la,si,DO (green)
Market often goes one octave from do to DO or fa to FA. You will see this occurring at all markets This indicator can be used to spot your take profit or stop loss target. It can be also used to find support and resistance or supply and demand.

The indicator displays the most important Price Action Patterns that indicate a potential reversal / continuation of the trend. My #1 Utility : includes 65+ functions | Contact me if you have any questions Avaliable Patterns: Pin bar; Engulfing; Inside bar (Harami); Morning star; Evening star; Dark Cloud Cover; Piercing Line; Features: You can select patterns to display and disable unnecessary patterns; Notifications : alerts in the terminal, Email and Push-notifications (to the mobil

The indicator displays the levels that are extremes for the specified time frames. Resistance level is the maximum price of the last closed bar; Support level is the minimum price of the last closed bar; My #1 Utility : includes 65+ functions | Contact me if you have any questions 2 operating modes: Real bodies: Open and Close prices will be used; Extremes: High and Low prices will be used;
This indicator: Helps to see potential reversal levels; Patterns formed near the levels have mo
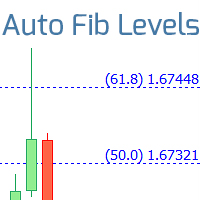
Automatically draws Fibonacci levels, basen on the last closed bar of the specified time frame. My #1 Utility : includes 65+ functions | Contact me if you have any questions helps to see potential reversal levels; patterns formed near the levels have more potential; significantly saves time spent on manual level plotting; Adjustable parameters:
The time frame used to plot the levels; Personalization of Fibonacci levels: main correction levels + extension levels; Line color, line width an

This may just look like another indicator for identifying and displaying supply and demand, but dig-in further and you will discover it has much more to offer. In addition to the complete flexibility for displaying zones, consider the identification of recent support or resistance, the back-testing capability to help you learn how to identify the best supply and demand zones to trader from, the continuously updated trend information for all time frames, times from around the world displayed on

FBO Impact is a professional yet simple to use trend following system. It detects the prevailing trend and gives entry points after pullbacks to significant price levels. To determine the trend it uses a unique filtering algorithm. Suitable for defining entry points for scalping as well as for intra-day trading. Features Works with the prevailing market trend. Suitable for all currency pairs. Ideal for all time frames but higher time frames are recommended. Does not redraw/repaint the arrows on

Finds bars that exceed the specified size
My #1 Utility : includes 65+ functions | Contact me if you have any questions 2 operating modes: Real body: the difference between the open and close prices will be used; Extremes: the difference between the maximum and minimum prices will be used;
This Indicator: Convenient for filter patterns in a period of low volatility; Indicates the beginning of a trend ; Helps to see the most significant bars ; Can be used when trading

Shows the direction of the bars on all major timeframes. My #1 Utility : 65+ functions | Version for MT5
The meaning of the visual signals ( squares):
Red : Close price is lower than the Open price: Close < Open; Green : Close price is higher than the Open price: Close > Open; Blue : Close price is equal to the Open price: Close = Open; You can set the Shift of the calculated bar, relative to the current bar: Shift = 0: the direction of the currenttly open (floating) bars, Shift

The falcon indicator works based on the innovative falcon strategy before me, as I used special numbers for the Moving Release indicator and the Bollinger Band, in addition to many indicators for filtering the signal, some numbers from the Nine Square and the Fibonacci numbers, where the results were impressive. We also have a free version for a month in the video description on Youtube download link Thanks

Trading is a trade war So traders are warriors. A warrior needs a weapon.
The Binary Galaxy A1 is a powerful weapon. Extremely accurate This tool can be customized as you like.
Who deserves such an accurate weapon? 1. People who want profits From binary options trading 2. Those who want to trade short, profit fast 3. People who want long-term can do it. 4. Beginners can use it. 5. Old hand works very well.
How it works It works very easy. For binary options Time frame M1 or M5 and expires

Trading is a trade war So traders are warriors. A warrior needs a weapon.
The Scalping One Plus A1 is a powerful weapon. Extremely accurate This tool can be customized as you like.
Who deserves such an accurate weapon? 1. People who want profits From binary options trading 2. Those who want to trade short, profit fast 3. People who want long-term can do it. 4. Beginners can use it. 5. Old hand works very well.
How it works It works very easy. For binary options Time frame M1 or M5 and exp
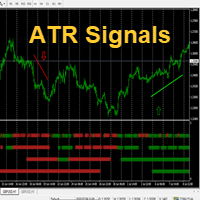
Hello This Indicator will draw Green (Up) and Red (Down) small arrows from Multi TimeFrames based in ( Average True Range ) to help you to take decision to buy or sell or waiting If there 4 green arrows in same vertical line that's mean (Up) and If there 4 Red arrows in same vertical line that's mean (Down) and the options contain (Alert and Mobile , Mail Notifications). Please watch our video for more details https://youtu.be/MVzDbFYPw1M and these is EA for it https://www.mql5.com/en/market/pr

The Dragon Trend indicator displays information in a visual form. The intelligent algorithm of the Dragon Trend indicator determines the trend with sufficient accuracy, filters out market noise and generates input signals.
One of the most beloved trends in price chart analysis is the use of chart analysis. The state of the market, the phase of its movement largely determines the success of the trader and the strategy he has chosen. The indicator uses color signaling: blue - when changing from

The key difference between the Trend Channel Generator indicator and other channel indicators is that the Trend Channel Generator takes into account not simple moving averages, but twice smoothed ones, which, on the one hand, makes it possible to more clearly determine the market movement, and on the other hand, makes the indicator less sensitive. Trend Channel Generator is a non-redrawing channel indicator based on moving averages.
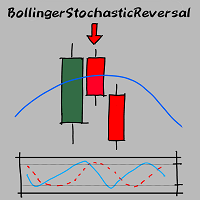
Hello Guys! I want to share with you a very simple but very effective indicator, which I use a lot in my daily trading. Bollinger bands are one of the most effective tools in trading, especially for those who like to operate on low time frames and prefer fast operations.
The indicator detects fast reversals: when the price close above or below the Bollinger Bands, but then re-enters in the Bands on the next candle, the indicator sends a signal and draws an arrow on the newly opened candle! It
This oscillator helps you to identify sideways movement that allows you to close your current position before you place a new position. It's simple straight and forward.
When the indicator is flat, it indicates it's trending.
When the indicator is printing at the extreme low (-1)/high(1) back and forth like a Richter scale graph, it indicates the market is in correction (sideway/diagonally). I call this earthquake, this is the opportunity for you to either take partial profit or open positio

Victory Price Direction I'm glad to present you my new indicator. This indicator includes all the best strategies that I have researched. When developing and optimizing, I used ML algorithms. The indicator is very easy to use.
Now the indicator has 3 basic strategies and the ability to customize your own strategy. I am constantly looking for better strategies.
You get: A simple and effective indicator of reversals. The indicator will help you place Take Profit correctly.

This indicator is an indicator that detects whether or not each moving average line is currently in the perfect order state. A perfect order is a state in which there are three moving averages on the FX chart, one for each of the short-term, medium-term, and long-term, lined up in the same direction in order to create a trend. The steeper the slope, the stronger the trend and the longer it tends to last. Many traders are aware of this perfect order. Perfect orders include uptrend perfect orders
All moving averages in one indicator
Have you ever wanted an indicator which contains all types of moving averages and show you when they cross? And at the same time works on all timeframes and it's very simple to configure? Well, now it's your chance to have it , because I am very glad to bring you another of my best creations : ALL in one MA indicator
This indicator is the base indicator used for this strategy. https://www.mql5.com/en/market/product/54168#!tab=overview
Features

双均线报警,全中文参数,方便使用 -------------------------------------------------------------------------------------------------------------- 你可以在这里联系我 https://www.mql5.com/zh/users/chaoping0326 可以承接MT4,MT5的指标,EA定制 长期从事编程项目(MT4从2012年,MT5从2016年), 有很好的编程能力,参数设置合理,能很好地理解客户的要求。 请联系我,根据你的要求进行报价。 我对程序的逻辑负责,如果程序有问题,我可以免费修复,如果我不能修复,我可以全额退款。 增加和调整逻辑需要额外收费。 免费提供全英文或中文源代码。

The five guardians
This indicator is a combination of the next indicators, each with their own settings. CCI MACD ADX DMI STOCHASTIC
When all five of them align with the same movement we get a green color which represents the buy movement , and contrary we have a red color which represents a sell movement. If its gray, its undecided, and we have to wait until a better signal will appear.
Logo made by https://www.fiverr.com/aleksa19

The indicator of the indicators. The Most Powerful Technique to Determine Forex Trend Strength in 2023. We have perfected Supreme Commander that it calculates an average of the selected indicators (up to 16) and the selected timeframe (all) with the result of a single trend that indicates the potential of buying and selling. It includes the following indicators:
Accelerator/Decelerator oscillator Average Directional Movement Index Awesome oscillator; Bulls and Bears Commodity Channel Index; D
Features Beginner friendly tools that incorporates one of the most useful indicators into simple and efficient strategy. This oscillator merges MA of RSI and parabolic SAR based on MACD values. Compared to standard parabolic SAR you'll see it is smoother and it seems likely to identify better significant price breaks. You will also have histogram that shows price bias and to assist with making trading decisions based on alignment.
Market to run
It can be adapted to all type of trading style
Features A n indicator will be given if we have a break on high volume.
Up Arrow
Volume> Average_Volume * Multiplier
Price> Highest Price for Last N candle, plus set, Pip / Percentage Value
Down Arrow
Volume> Average_Volume * Multiplier
Price <Lowest Price for Last N candle, minus set, Pip / Percentage Value
Market to run
It can be adapted to all type of trading styles such as scalping, day trading or swing. It doesn't matter if its forex, stock , crypto and so on. It can be ad
DMI ADX Histogram Oscillator I present you one of the most precise and powerful indicator Its made of DMI Histogram together with ADX Oscillator. It has inside arrow to show a buy or sell setup.
Features The way it works its the next one : the histogram is a difference between DMI+ and DMI-. At the same time together we have the oscillator ADX for
Market to run
It can be adapted to all type of trading styles such as scalping, day trading or swing. It doesn't matter if its forex, st
The indicator is designed for trading binary options on small timeframes up to 15 m Easy to use does not need additional settings and can be used without additional filters Recommendations for trading When a signal appears (blue arrows pointing up), you need to consider the buy direction When a signal appears (the red line indicates the bottom), you need to consider the direction to sell To conclude a deal is on the candle where the signal for one candle came, if the signal turned out to be unpr

KDJ指标,从国内代码中转译而来,带有J线 -------------------------------------------------------------------------------------------------------------- 你可以在这里联系我 https://www.mql5.com/zh/users/chaoping0326 可以承接MT4,MT5的指标,EA定制 长期从事编程项目(MT4从2012年,MT5从2016年), 有很好的编程能力,参数设置合理,能很好地理解客户的要求。 请联系我,根据你的要求进行报价。 我对程序的逻辑负责,如果程序有问题,我可以免费修复,如果我不能修复,我可以全额退款。 增加和调整逻辑需要额外收费。 免费提供全英文或中文源代码。

双线MACD -------------------------------------------------------------------------------------------------------------- 你可以在这里联系我 https://www.mql5.com/zh/users/chaoping0326 可以承接MT4,MT5的指标,EA定制 长期从事编程项目(MT4从2012年,MT5从2016年), 有很好的编程能力,参数设置合理,能很好地理解客户的要求。 请联系我,根据你的要求进行报价。 我对程序的逻辑负责,如果程序有问题,我可以免费修复,如果我不能修复,我可以全额退款。 增加和调整逻辑需要额外收费。 免费提供全英文或中文源代码。

デイリートレンドスカルパー(DTS) このインジケーターはRPTradeProSolutionsシステムの一部です。
DTSは、プライスアクション、ダイナミックサポート、レジスタンスを使用した毎日のトレンドインジケーターです。 誰でも使用できるように設計されており、トレーディングの初心者でも使用できます。 決して塗り直さないでください。 表示は近いものから近いものへと示されます。 単独で使用するように設計されているため、他のインジケーターは必要ありません。 一日の初めにトレンドと潜在的なテイクプロフィットを提供します。
どのように機能しますか DTSは、価格アクションと動的なサポートおよびレジスタンスを組み合わせたブレイクアウト戦略を使用しています。 夜のトレンドとボラティリティが分析され、翌日に使用されます。 この分析から、ブレイクアウト制限(青と濃いオレンジの線)とTakeProfitが決定されます 履歴データのおかげで、戦略と設定の「成功」を即座に確認できます。 履歴部分では、戦略に「穴」があるかどうかをすぐに確認し、最終的にはより適切な別のタイムフレームまたはシン
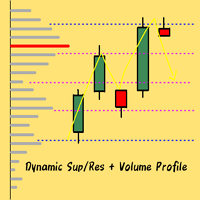
!!!REVISION 3 OF THE INDICATOR HAS BEEN RELEASED! IF YOU WANT TO TRY THE INDICATOR FOR 1 MONTH FOR FREE JUST WRITE ME NOW!!!
DYNAMIC LEVELS + VOLUME PROFILE + REGRESSION CHANNEL Hello Guys! Revision 3 of the indicator has been released! The indicator plots SUPPORTS AND RESISTANCES DYNAMICALLY on the chart, identifying different levels of interest based on the price action. Every trader knows that indicators are important, but they often provide the signal "with a candle of delay", therefore wh
Это стрелочный индикатор. Он выбирает данные от 23-х стандартных индикаторов и расчитывает уровень сигнала который показывает предполагаемое движение цены инструмента торговли. Минимальный уровень сигнала индикатора установлен в пределах -100 до +100%. Используйте усреднение для формирования сигнала.
Как работать с индикаторам.
Следим за сигналом и принимаем решения. Индикатор перерисовывается только на нулевой свечи, поэтому решения принимаются после закрытия свечи с новым сигналом, и сигн
Это линейный индикатор. Он выбирает данные от 23-х стандартных индикаторов и рассчитывает уровень сигнала, который показывает предполагаемое движение цены инструмента торговли. Минимальный уровень сигнала индикатора установлен в пределах -100 до +100%. Используйте усреднение для формирования сигнала.
Как работать с индикаторам.
Следим за сигналом и принимаем решения. При пересечении нулевого уровня индикатора снизу вверх можно рассматривать покупки. При пересечении нулевого уровня сверху
Это индикатор гистограмма. Он выбирает данные от 23-х стандартных индикаторов и расчитывает уровень сигнала который показывает предполагаемое движение цены инструмента торговли. Минимальный уровень сигнала индикатора установлен в пределах -100 до +100%. Используйте усреднение для формирования сигнала.
Как работать с индикаторам.
Следим за сигналом и принимаем решения, цвета гистограммы показывают когда возможны покупки а когда продажи, или нейтральный цвет - сделать паузу. Индикатор перерис

Stochastic force is an advanced version of the stochastic oscillator. Instead of using the regular price a more efficient price data is provided as an input for the oscillator which takes into account the price efficiency, volume and market noise. Also price is pre-filtered with the selected average type and then post-filtered by a hull moving average which provides a smooth transition of the oscillator. It eliminates maximum false signals and has the potential to become an integral part of any

Trend Harvester is yet another trend indicator with flat detection. It uses price series and Moving Average for detecting market trend.
For better result I would recomend to play with parameters.
Lower periods will force to react to short trends.
Higher periods will try to show longer trands.
You can set the same period for Price Series and Moving Average for quick test.
You can also choose Moving Average type between "Regular" and "Zero Lag".
"Zero Lag" type improves reaction to trend ch

VertexFilter - это индикатор соединивший в себе классический zig zag и осциллятор. Принцип действия следующий: когда регистрируется новый максимум или минимум, это делается с помощью индикатора zig zag, индикатор ждет смены направления движения цены, это делается с помощью осциллятора, в такие моменты появляются сигналы на покупку и продажу. Таким образом индикатор подает сигналы когда цена меняет направление движения вблизи экстремумов. Это позволяет отфильтровать ложные сигналы. Индикатор имее
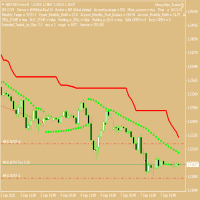
ATR Stops Attach to chart of any timescale Length = 10 ATR period = 9 kv = 6 I use this set up on a one hour chart, basically the blue line indicates an upward trend while the red line indicates a downward trend All setting can be used on any chart period, If you don't like the settings I use then just play around with the settings on any chosen time period until you find a setup which suites your trading style
MetaTraderマーケットは、開発者がトレーディングアプリを販売するシンプルで便利なサイトです。
プロダクトを投稿するのをお手伝いし、マーケットのためにプロダクト記載を準備する方法を説明します。マーケットのすべてのアプリは暗号化によって守られ、購入者のコンピュータでしか動作しません。違法なコピーは不可能です。
取引の機会を逃しています。
- 無料取引アプリ
- 8千を超えるシグナルをコピー
- 金融ニュースで金融マーケットを探索
新規登録
ログイン