Смотри обучающее видео по маркету на YouTube
Как купить торгового робота или индикатор
Запусти робота на
виртуальном хостинге
виртуальном хостинге
Протестируй индикатор/робота перед покупкой
Хочешь зарабатывать в Маркете?
Как подать продукт, чтобы его покупали
Платные технические индикаторы для MetaTrader 4 - 60

Новый индикатор является предсказателем тренда для текущего графика, а также для других символов и таймфреймов. Каждая кнопка на доске интерактивна. По умолчанию у вас есть 20 валютных пар в списке наблюдения и три таймфрейма (M5, H1, D1), но вы можете выбрать периоды и символы, которые хотите отображать, из меню.
Если индикатор синий, это указывает на начало восходящего тренда. Если он красный, это означает начало нисходящего тренда.
В кадре 3 (дневной режим) я подробно объясню каждый эл
ФТУ Фибоначчи
Этот индикатор рисует уровни Фибоначчи для уровней восстановления от ценового действия.
Функции:
Регулировка нескольких уровней Фибоначчи Изменить цвет и количество баров из диапазона
2 линии для 50-барной истории, 2 линии для 20-барной истории, обе показывают уровни Фибоначчи 38 и 61
Использование:
Цель состоит в том, чтобы изучить или измерить откат цены. Изменение цвета и количества баров из диапазона Использование на любом таймфрейме, продукте/паре, без пере

This indicator gives you the strength of currencies according to multiple frames With this indicator, you can know the true direction of the currency pair This indicator gives you good advice to bet on the best fighter If you know how to use this indicator, you do not need any other indicators This indicator is suitable for working on long-term, short or medium-term trades. This indicator is your loyal friend

Описание
Range Detector - индикатор, который идентифицирует на рынке ренджи (периоды движения цены в горизонтальном канале), и отображает их наличие на ценовом графике.
Рекомендации
Вы можете использовать данный индикатор для определения флета и соответственно для определения направления открытия позиции или закрытия противоположной позиции.
Параметры
Maximum History Bars - максимальное количество баров истории для расчета индикатора. Average True Range Period - период индикатор
Хочешь торговать как профи? Покупай там, где падает профессионал и продавай там, где продает професионал! Наш индикатор показывает самый спорный и накаленный момент дня! Именно там было загружено много денег и именно за этот "Клад" пойдет дальнейшая борьба!
И так, индикатор показывает бар в котором была максимальная борьба покупателя и продавца за прошедший день, и именно этот бар, либо его экстремумы, либо сам он целиком, становится важным уровнем от которого цена начинает отскакивать и про

KT Renko Patterns scans the Renko chart brick by brick to find some famous chart patterns that are frequently used by traders across the various financial markets. Compared to the time-based charts, patterns based trading is easier and more evident on Renko charts due to their uncluttered appearance.
KT Renko Patterns features multiple Renko patterns, and many of these patterns are extensively explained in the book titled Profitable Trading with Renko Charts by Prashant Shah. A 100% automate
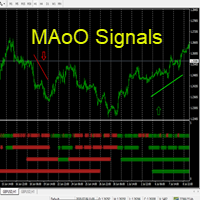
Hello This Indicator will draw Green (Up) and Red (Down) small arrows from Multi TimeFrames based in ( moving average of oscillator) to help you to take decision to buy or sell or waiting If there 4 green arrows in same vertical line that's mean (Up) and If there 4 Red arrows in same vertical line that's mean (Down) and the options contain (Alert and Mobile , Mail Notifications). Please watch our video for more details https://youtu.be/MVzDbFYPw1M and these is EA for it https://www.mql5.com/en/
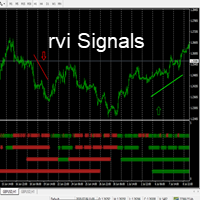
Hello This Indicator will draw Green (Up) and Red (Down) small arrows from Multi TimeFrames based in ( Relative Vigor Index ) to help you to take decision to buy or sell or waiting If there 4 green arrows in same vertical line that's mean (Up) and If there 4 Red arrows in same vertical line that's mean (Down) and the options contain (Alert and Mobile , Mail Notifications). Please watch our video for more details https://youtu.be/MVzDbFYPw1M and these is EA for it https://www.mql5.com/en/market/

Does your trading consist of Multiple EA's, Multiple time frames an no clear indication of how each individual strategy or time frame is performing, then this indicator will help. Assign the EA Magic number to this indicator and track it's performance on the chart by selecting on chart the period, today, week, month year or all history to view. Easy visual colour changing header to display the performance of the EA for the respective periods. Minimize the panel to reduce chart clutter. Add yo
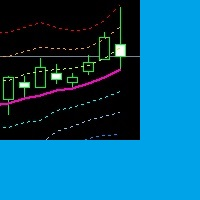
A Channel and Trend indicator. You set as you want. You can use at all timeframe. You can use for martingale,scalping and tunnel strategies. I set some number for me, but you can change this number as you want. You can use this indicator for your expert advisor apps. if you want another features i can do it for you.
Input Values: 1.) Last_Candle : Last candle for display indikator. 2.) X_Price : Price of indicator. 3.) MA_Period : Period for Moving Average. 4.) MA_Method : Method for Moving Av
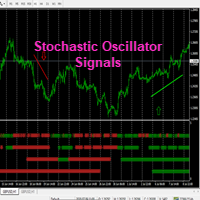
Hello This Indicator will draw Green (Up) and Red (Down) small arrows from Multi TimeFrames based in ( Stochastic oscillator ) to help you to take decision to buy or sell or waiting If there 4 green arrows in same vertical line that's mean (Up) and If there 4 Red arrows in same vertical line that's mean (Down) and the options contain (Alert and Mobile , Mail Notifications). Please watch our video for more details https://youtu.be/MVzDbFYPw1M and these is EA for it https://www.mql5.com/en/ma

Cтрелка формируэтся на текущей свечи и указывает направление следующей свечи и возможного направления тренда в дальнейшем. Сигнал может иногда пропадать. Входить в сделку стоит на Следующейей свече. его преимущества: точность сигналов. полное отсутствие перерисовки. Вы сможете выбрать абсолютно любой инструмент. индикатор обеспечит множество прибыльных и точных сигналов есть alert, push, email увидомления... не нужно нагромождать живой график различными индикаторамипротиворечащими друг другу,

Этот индикатор с несколькими таймфреймами и несколькими символами предупреждает об изменениях цвета Heiken Ashi Smoothed. В качестве бонуса он также может сканировать изменения тренда (цвета) скользящей средней корпуса. В сочетании с вашими собственными правилами и методами этот индикатор позволит вам создать (или улучшить) вашу собственную мощную торговую систему. Функции
Может одновременно отслеживать все символы, отображаемые в окне "Обзор рынка". Примените индикатор только к одному графику
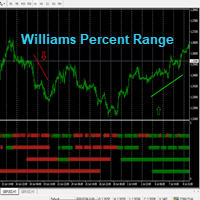
Hello This Indicator will draw Green (Up) and Red (Down) small arrows from Multi TimeFrames based in ( Williams Percent Range ) to help you to take decision to buy or sell or waiting If there 4 green arrows in same vertical line that's mean (Up) and If there 4 Red arrows in same vertical line that's mean (Down) and the options contain (Alert and Mobile , Mail Notifications). Please watch our video for more details https://youtu.be/MVzDbFYPw1M and these is EA for it https://www.mql5.com/e
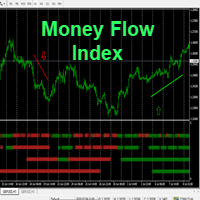
Hello This Indicator will draw Green (Up) and Red (Down) small arrows from Multi TimeFrames based in ( Money Flow Index ) to help you to take decision to buy or sell or waiting If there 4 green arrows in same vertical line that's mean (Up) and If there 4 Red arrows in same vertical line that's mean (Down) and the options contain (Alert and Mobile , Mail Notifications). Please watch our video for more details https://youtu.be/MVzDbFYPw1M and these is EA for it https://www.mql5.com/en/market/p

FXC iRSI-DivergencE MT4 Indicator
This is an advanced RSI indicator that finds trend-turn divergences on the current symbol. The indicator detects divergence between the RSI and the price movements as a strong trend-turn pattern.
Main features: Advanced divergence settings
Price based on Close, Open or High/Low prices Give Buy/Sell open signals PUSH notifications
E-mail sending Pop-up alert Customizeable Information panel Input parameters: RSI Period: The Period size of the RSI indicator.
R

This is simple profitable system I have been using to trade for over 10 years.
You do not need many indicators on your charts to be successful as a trader. Just find the right strategy that has been proven over time and stick to it. You are not only buying trading system when you buy my product but also mentorship. You will become one of the members of my close trading group on Telegram where you will learn how to manage your trading career and become a discipline trader who makes consistent

Торговля о ожидании нужного времени. Этот индикатор был создан, чтобы знать, что происходит на наших графиках без необходимости покрывать экран индикаторами. Кроме того, он имеет несколько типов предупреждений, которые позволяют нам посвятить наше время другим вещам, пока что-то интересное не произойдет. Вы можете использовать несколько сигналов тревоги одновременно. Это не проблема. По умолчанию AlterAlert предлагает нам оповещения, когда следующие индикаторы дают нам сигнал: ◾движусь в среднем

Индикатор ищет дивергенции по индикаторам: MACD, RSI,CCI,Stochastic,OsMA,RVI. По клику на сигнальную кнопку осуществляется переход на график с
сигналом. Для каждого индикатора применяется свой шаблон. Цифры на сигнальных кнопках указывают расстояние в барах от сигнала. Прокрутка
(scrolling) панели осуществляется клавишами "UP" "DOWN" на клавиатуре.
Входные параметры
Lists Of Currencies To Search For Divergences - Список торговых инструментов.
General Setting - Общие настройки панели.
T

There are 8 types of this indicator. Consisted of 1. Bullish and Bearish Engulfing 2. Morning and Evening Star 3. Three Green Soldiers and Three Red Crows 4. Three Inside Up and Down 5. Three Outside Up and Down 6. Bullish and Bearish Harami 7. Tweezers Top and Bottom 8. Piercing and Dark cloud cover
Signal Filter :: 1. The appearance of the candle stick 2. SMA 3. 2EMA :: EMA Fast and EMA Slow 4. RSI
N otification :: 1. Via screen 2. Email 2. Phone
For trading 1. Scaling 2. Binary options

Индикатор определяет два важнейших паттерна технического анализа - Пин-Бар и Поглощение. MT5-версия https://www.mql5.com/ru/market/product/53701
Настройки: Mincandle size for PinBar - Минимальный размер свечи Пин- Бара ; Percentage of candle body on size - Процент тела свечи по отношению к ее длине; PinBar Alert - Алерт при обнаружении Пин-Бара; PinBar Mail - Отправка электронного письма при обнаружении Пин-Бара; PinBar Notification - Отправка Push-уведомления при обнаружении Пин-Бара. Min

Индикатор высчитывается по сложному авторскому алгоритму. Он строится с учетом тенденции по зонам перекупленности перепроданности объёмов . Это позволяет выявлять дивергенцию объёмов , выявить так называемые приседающие бары. Также он определяет уровни входа в рынок и цели. Средняя линия канала является предполагаемым уровнем отката.
RPeriod- период расчета индикатора
Indicator_Level - уровень зон перекупленности перепроданности
Draw Fibo Levels - отображаем целевые уровни
Fibo Level Col

[ОПИСАНИЕ]
Индикатор Entry Point показывает стрелки вверх / вниз как точку входа для покупки / продажи. Сигнал основан на EMA, MACD и Price Action.
Красная стрелка означает, что это хорошая возможность для продажи. Зеленая стрелка означает, что это хорошая возможность для покупки. [ПРЕДУПРЕЖДЕНИЕ И РЕКОМЕНДАЦИИ]
Торговля Forex и финансовыми инструментами с кредитным плечом сопряжена со значительным риском и может привести к потере вашего инвестированного капитала. Вы не должны инвестировать
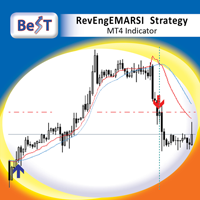
BeST_RevEngEMARSI Strategy is an MT4 Indicator that is based on the indicator RevEngEMARSI by Giorgos Siligardos that was presented in his article " Reverse Engineering RSI (II) " ( TASC_Aug 2003 ) as a new variation of his inverse-RSI indicator and which transforms the Exponential moving average of RSI into a curve in the price graph, simplifying the price projection method and improving its visual representation. BeST_RevEngEMARSI Strategy while implementing the crossings with its Moving Aver

Retracement Hunter This Indicator based on powerfull daily levels . support and resistance, Buy / Sell entries which is more based on low risk and high reward and winning ratio, Enter trade when you get popup alert , book profit on target1, target 2, target3 levels, most of the trending days it will hit target3, but its always safe to book partial at target1 or target2
Buy best entry when rule 1) look for Buy 2) Emas aligned less than 0.25 3) Main Ema aligned Buy , it will alert when all t

This indicator is an upgrade of traditional MACD on MT4. Macd Base line cross above Macd signal line the color of histogram change is red color and entry order Sell. Macd Base line cross below Macd signal line the color of histogram change is green color and entry order Buy.
For above histogram of Macd can change color to good looking by can change color above zero line and lower line.

Trading is a trade war. So a trader is a warrior. A warrior needs to be armed with a weapon
This Binary Star Wars Pro is your workout routine. That can accelerate the results precisely
Who deserves this kind of precision weapon? 1. People who want to profit. From binary options trading 2. Those who want to trade short, profit fast 3. People who want long-term Can be done 4. Newbie can use it. 5. Old hands can be used very well.
How it works It works very easy. For binary options Time fra
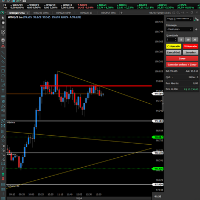
O indicador DonForex é uma das ferramentas mais utilizadas para traçar suporte e resistência automaticamente. Ele traça os melhores níveis de suporte e resistência do gráfico em qualquer tempo. Isso ajuda você a ter uma visão mais amplas para fazer suas operações
As linhas pontilhadas são os pontos mais tocados pelo preço formando assim uma região de suporte ou resistência. Ele também traça automaticamente linhas de tendências de alta (LTA) ou de baixa (LTB) nos dando oportunidade de compra e
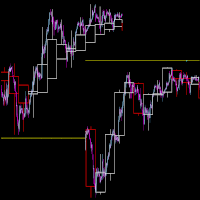
This indi lets you plot higher time frame candle stick (Japanese Candlestick or Heiken Ashi Candlestick). This indicator could greatly help your trading style either its scalping, day trading or swing trading as it shows you the higher time frame candlesticks activity while you are about to pull a trigger on your trade. The candlesticks will only appear on a time frame that is lower than the higher time frame. It won't draw if the current time frame is equal to or higher than the time frame set
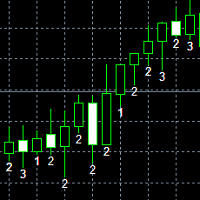
Rob Smith's is a trading method developed over a 30 year career in the market. TheSTRAT is a multi-timeframe strategy that has three major components: Inside Bars - Inside Bars occur when the current candle falls completely within the prior candle. Directional Bars - Directional Bars occur when the current candle takes out one side of the prior candle. Outside Bars - Outside Bars occur when the current candle takes out both sides of the prior candle. #thestrat

This indi shows the following 1. Supertrend 2. Alligator (Not a regular alligator)
3. ZigZag 4. Moving Average 5. Trend Continuation/Mini correction Signal (plotted in X) (See screenshots in green background color
6. Early Signal Detection (See screenshots in green background color)
You may treat Alligator as the lagging indicator
The leading indicator is the supertrend. The zig zag is based on the leading indicator where it gets plotted when the leading indicator got broken to the opposite.

This advisor enters the market at the opening of London Market . It has a automatic function that give buy (arrow up green) and sell (arrow down red) signal when the indicator met high probabilities requirements.Once the signal is generated it is the trader discretions to start the order button and do trade manually. Stop loss are base on ATR. Recommended Take profit is 20pips. The trading system is suitable for both experienced traders and beginners.
Monitoring and proof of wins : https

For this set of indicators 1. General information - Calculates with high performance mathematical algorithms. - Calculated from the price of candles - The entry point of this order is filtered by the train EMA and the oscillator. - Calculate the integrity of the candle
2. How does it work? - You can see two types of order entry points: the notification on the monitor and the arrow. - You can trust 75-95 percent of this entry point.
3. Settings - A complete candle

For this set of indicators 1. General information - Calculates with high performance mathematical algorithms. - Calculated from the price of candles - The entry point of this order is filtered by the train EMA and the oscillator. - Calculate the integrity of the candle
2. How does it work? - You can see two types of order entry points: the notification on the monitor and the arrow. - You can trust 75-95 percent of this entry point.
3. Settings - Retracement is re

For this set of indicators 1. General information - Calculates with high performance mathematical algorithms. - Calculated from the price of candles - The entry point of this order is filtered by the train EMA and the oscillator. - Calculate the integrity of the candle
2. How does it work? - You can see two types of order entry points: the notification on the monitor and the arrow. - You can trust 75-95 percent of this entry point.
3. Settings - A complete candle

For this set of indicators 1. General information - Calculates with high performance mathematical algorithms. - Calculated from the price of candles - The entry point of this order is filtered by the train EMA and the oscillator. - Calculate the integrity of the candle
2. How does it work? - You can see two types of order entry points: the notification on the monitor and the arrow. - You can trust 75-95 percent of this entry point.
3. Settings - A complete candle

For this set of indicators 1. General information - Calculates with high performance mathematical algorithms. - Calculated from the price of candles - The entry point of this order is filtered by the train EMA and the oscillator. - Calculate the integrity of the candle
2. How does it work? - You can see two types of order entry points: the notification on the monitor and the arrow. - You can trust 75-95 percent of this entry point.
3. Settings - A complete candle

For this set of indicators 1. General information - Calculates with high performance mathematical algorithms. - Calculated from the price of candles - The entry point of this order is filtered by the train EMA and the oscillator. - Calculate the integrity of the candle
2. How does it work? - You can see two types of order entry points: the notification on the monitor and the arrow. - You can trust 75-95 percent of this entry point.
3. Settings - A complete candle
This indicator displays support and resistance at fixed levels. The level won't change regardless how many days or minutes has gone by. There are 7 levels start from green ends at gray color. Imagine it like do (green),re,mi,fa,sol,la,si,DO (green)
Market often goes one octave from do to DO or fa to FA. You will see this occurring at all markets This indicator can be used to spot your take profit or stop loss target. It can be also used to find support and resistance or supply and demand.

Паттерны Price Action Индикатор отображает наиболее важные паттерны Price Action, которые указывают на потенциальный разворот или продолжение тренда. Поддерживаемые свечные модели: Пин - бар; Поглощение; Внутренний бар; Утренняя звезда; Вечерняя звезда; Завеса из темных облаков; Просвет в облаках; Особенности работы: возможность выбора определенных паттернов для отображения (вы можете отключить ненужные паттерны); наличие уведомлений : алерты в терминале, Email и Push-уведомления (на мобиль

Автоматические уровни поддержки и сопротивления Индикатор отображает уровни, которые являются экстремумами для заданных тайм-фреймов. Уровень сопротивления является максимальной ценой последнего закрытого бара; Уровень поддержки является минимальной ценой последнего закрытого бара; 2 режима работы: Тело свечи: использование цен открытия и закрытия; Экстремумы: использование максимальной и минимальной цены; помогает видеть потенциальные уровни разворота ; паттерны, сформированные около уро
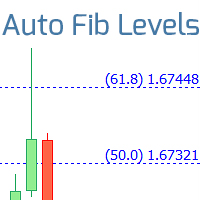
Автоматические уровни Фибоначчи Индикатор автоматически строит уровни Фибоначчи по последнему закрытому бару установленного тайм-фрейма. помогает видеть потенциальные уровни разворота ; паттерны, сформированные около уровней, имеют больший потенциал; существенно экономит время, затрачиваемое на ручное перестроение уровней; абсолютно точное построение уровней, чего сложно добиться при ручном построении; Настраиваемые параметры: Используемый тайм-фрейм для построения уровней; Персонализация уров

This may just look like another indicator for identifying and displaying supply and demand, but dig-in further and you will discover it has much more to offer. In addition to the complete flexibility for displaying zones, consider the identification of recent support or resistance, the back-testing capability to help you learn how to identify the best supply and demand zones to trader from, the continuously updated trend information for all time frames, times from around the world displayed on

FBO Impact is a professional yet simple to use trend following system. It detects the prevailing trend and gives entry points after pullbacks to significant price levels. To determine the trend it uses a unique filtering algorithm. Suitable for defining entry points for scalping as well as for intra-day trading. Features Works with the prevailing market trend. Suitable for all currency pairs. Ideal for all time frames but higher time frames are recommended. Does not redraw/repaint the arrows on

Индикатор размера бара: уведомление о больших барах Индикатор находит свечи, которые превышают заданный размер, и обозначает их размер. удобно для фильтрации паттернов в период низкой волатильности; указывает на начало тренда; помогает видеть наиболее значимые бары; может использоваться при торговле бинарными опционами ; 2 режима работы: Тело свечи: будет считаться разница между ценами открытия и закрытия; Экстремумы: будет считаться разница между максимальной и минимальной ценой

Shows the direction of the bars on all major timeframes. My #1 Utility : 65+ functions | Version for MT5
The meaning of the visual signals ( squares):
Red : Close price is lower than the Open price: Close < Open; Green : Close price is higher than the Open price: Close > Open; Blue : Close price is equal to the Open price: Close = Open; You can set the Shift of the calculated bar, relative to the current bar: Shift = 0: the direction of the currenttly open (floating) bars, Shift

The falcon indicator works based on the innovative falcon strategy before me, as I used special numbers for the Moving Release indicator and the Bollinger Band, in addition to many indicators for filtering the signal, some numbers from the Nine Square and the Fibonacci numbers, where the results were impressive. We also have a free version for a month in the video description on Youtube download link Thanks

Trading is a trade war So traders are warriors. A warrior needs a weapon.
The Binary Galaxy A1 is a powerful weapon. Extremely accurate This tool can be customized as you like.
Who deserves such an accurate weapon? 1. People who want profits From binary options trading 2. Those who want to trade short, profit fast 3. People who want long-term can do it. 4. Beginners can use it. 5. Old hand works very well.
How it works It works very easy. For binary options Time frame M1 or M5 and expires

Trading is a trade war So traders are warriors. A warrior needs a weapon.
The Scalping One Plus A1 is a powerful weapon. Extremely accurate This tool can be customized as you like.
Who deserves such an accurate weapon? 1. People who want profits From binary options trading 2. Those who want to trade short, profit fast 3. People who want long-term can do it. 4. Beginners can use it. 5. Old hand works very well.
How it works It works very easy. For binary options Time frame M1 or M5 and exp
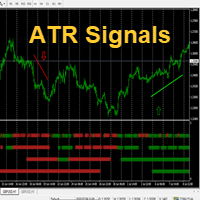
Hello This Indicator will draw Green (Up) and Red (Down) small arrows from Multi TimeFrames based in ( Average True Range ) to help you to take decision to buy or sell or waiting If there 4 green arrows in same vertical line that's mean (Up) and If there 4 Red arrows in same vertical line that's mean (Down) and the options contain (Alert and Mobile , Mail Notifications). Please watch our video for more details https://youtu.be/MVzDbFYPw1M and these is EA for it https://www.mql5.com/en/market/pr

Индикатор Dragon Trend отражает информацию в наглядном виде. Интеллектуальный алгоритм индикатора Dragon Trend с достаточной точностью определяет тренд, отфильтровывает рыночный шум и генерирует входные сигналы.
Одно из самых любимых направлений в анализе ценового графика является использование графического анализа. Состояние рынка, фаза его движения во многом определяет успешность трейдера и выбранной им стратегии. Индикатор использует цветовую сигнализацию: синий - при смене с нисходящего

Ключевое отличие индикатора Trend Channel Generator от других канальных индикаторов состоит в том, что Trend Channel Generator берет в расчет не простые скользящие средние, а дважды сглаженные, что с одной стороны позволяет более четко определять движение рынка, а с другой стороны делает индикатор менее чувствительным. Trend Channel Generator – это индикатор канала без перерисовки, строящийся на основании скользящих средних.
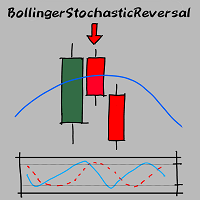
Hello Guys! I want to share with you a very simple but very effective indicator, which I use a lot in my daily trading. Bollinger bands are one of the most effective tools in trading, especially for those who like to operate on low time frames and prefer fast operations.
The indicator detects fast reversals: when the price close above or below the Bollinger Bands, but then re-enters in the Bands on the next candle, the indicator sends a signal and draws an arrow on the newly opened candle! It
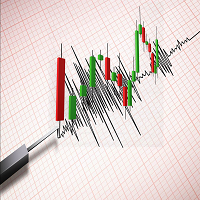
This oscillator helps you to identify sideways movement that allows you to close your current position before you place a new position. It's simple straight and forward.
When the indicator is flat, it indicates it's trending.
When the indicator is printing at the extreme low (-1)/high(1) back and forth like a Richter scale graph, it indicates the market is in correction (sideway/diagonally). I call this earthquake, this is the opportunity for you to either take partial profit or open positio

Victory Price Direction Рада представить вам мой новый индикатор . Этот индикатор включает в себя все лучшие стратегии, которые я исследовала. Индикатором очень просто пользоваться. Сейчас в индикаторе 3 базовые стратегии . Я постоянно занимаюсь поиском улучшений стратегий.
Вы получаете: Простой и эффективный индикатор разворотов. Индикатор поможет вам корректно поставить Take Profit Сообщит когда нужно закрыть сделку, что не позволит уйти в большой минус. Никогд

This indicator is an indicator that detects whether or not each moving average line is currently in the perfect order state. A perfect order is a state in which there are three moving averages on the FX chart, one for each of the short-term, medium-term, and long-term, lined up in the same direction in order to create a trend. The steeper the slope, the stronger the trend and the longer it tends to last. Many traders are aware of this perfect order. Perfect orders include uptrend perfect orders
All moving averages in one indicator
Have you ever wanted an indicator which contains all types of moving averages and show you when they cross? And at the same time works on all timeframes and it's very simple to configure? Well, now it's your chance to have it , because I am very glad to bring you another of my best creations : ALL in one MA indicator
This indicator is the base indicator used for this strategy. https://www.mql5.com/en/market/product/54168#!tab=overview
Features

双均线报警,全中文参数,方便使用 -------------------------------------------------------------------------------------------------------------- 你可以在这里联系我 https://www.mql5.com/zh/users/chaoping0326 可以承接MT4,MT5的指标,EA定制 长期从事编程项目(MT4从2012年,MT5从2016年), 有很好的编程能力,参数设置合理,能很好地理解客户的要求。 请联系我,根据你的要求进行报价。 我对程序的逻辑负责,如果程序有问题,我可以免费修复,如果我不能修复,我可以全额退款。 增加和调整逻辑需要额外收费。 免费提供全英文或中文源代码。
The five guardians
This indicator is a combination of the next indicators, each with their own settings. CCI MACD ADX DMI STOCHASTIC
When all five of them align with the same movement we get a green color which represents the buy movement , and contrary we have a red color which represents a sell movement. If its gray, its undecided, and we have to wait until a better signal will appear.
Logo made by https://www.fiverr.com/aleksa19

The indicator of the indicators. The Most Powerful Technique to Determine Forex Trend Strength in 2023. We have perfected Supreme Commander that it calculates an average of the selected indicators (up to 16) and the selected timeframe (all) with the result of a single trend that indicates the potential of buying and selling. It includes the following indicators:
Accelerator/Decelerator oscillator Average Directional Movement Index Awesome oscillator; Bulls and Bears Commodity Channel Index; D
Features Beginner friendly tools that incorporates one of the most useful indicators into simple and efficient strategy. This oscillator merges MA of RSI and parabolic SAR based on MACD values. Compared to standard parabolic SAR you'll see it is smoother and it seems likely to identify better significant price breaks. You will also have histogram that shows price bias and to assist with making trading decisions based on alignment.
Market to run
It can be adapted to all type of trading style
Features A n indicator will be given if we have a break on high volume.
Up Arrow
Volume> Average_Volume * Multiplier
Price> Highest Price for Last N candle, plus set, Pip / Percentage Value
Down Arrow
Volume> Average_Volume * Multiplier
Price <Lowest Price for Last N candle, minus set, Pip / Percentage Value
Market to run
It can be adapted to all type of trading styles such as scalping, day trading or swing. It doesn't matter if its forex, stock , crypto and so on. It can be ad
DMI ADX Histogram Oscillator I present you one of the most precise and powerful indicator Its made of DMI Histogram together with ADX Oscillator. It has inside arrow to show a buy or sell setup.
Features The way it works its the next one : the histogram is a difference between DMI+ and DMI-. At the same time together we have the oscillator ADX for
Market to run
It can be adapted to all type of trading styles such as scalping, day trading or swing. It doesn't matter if its forex, st
Индикатор разработан для торговли бинарными опционами на малых таймфреймах до м 15 Прост в использовании не нуждается в дополнительных настройках и можно использовать без дополнительных фильтров Рекомендации для торговли При появлении сигнала ( синий стрелки показывающий на верх ) нужно рассматривать направление на buy При появлении сигнала ( красной строки показывающий на низ ) нужно рассматривать направление на sell Заключить сделку стоит на той свечи где пришел сигнал на одну свечу если сиг

KDJ指标,从国内代码中转译而来,带有J线 -------------------------------------------------------------------------------------------------------------- 你可以在这里联系我 https://www.mql5.com/zh/users/chaoping0326 可以承接MT4,MT5的指标,EA定制 长期从事编程项目(MT4从2012年,MT5从2016年), 有很好的编程能力,参数设置合理,能很好地理解客户的要求。 请联系我,根据你的要求进行报价。 我对程序的逻辑负责,如果程序有问题,我可以免费修复,如果我不能修复,我可以全额退款。 增加和调整逻辑需要额外收费。 免费提供全英文或中文源代码。

双线MACD -------------------------------------------------------------------------------------------------------------- 你可以在这里联系我 https://www.mql5.com/zh/users/chaoping0326 可以承接MT4,MT5的指标,EA定制 长期从事编程项目(MT4从2012年,MT5从2016年), 有很好的编程能力,参数设置合理,能很好地理解客户的要求。 请联系我,根据你的要求进行报价。 我对程序的逻辑负责,如果程序有问题,我可以免费修复,如果我不能修复,我可以全额退款。 增加和调整逻辑需要额外收费。 免费提供全英文或中文源代码。

Ежедневный скальпер тренда (DTS) Этот индикатор является частью систем RPTrade Pro Solutions.
DTS — это индикатор дневного тренда, использующий ценовое действие, динамическую поддержку и сопротивление. Он предназначен для использования любым, даже абсолютный новичок в торговле может использовать его. НИКОГДА не перекрашивает. Показания даны от близкого к близкому. Предназначен для использования в одиночку, никаких других индикаторов не требуется. Дает вам тренд и потенциальный Take Profit в н
MetaTrader Маркет предлагает каждому разработчику торговых программ простую и удобную площадку для их продажи.
Мы поможем вам с оформлением и подскажем, как подготовить описание продукта для Маркета. Все продаваемые через Маркет программы защищаются дополнительным шифрованием и могут запускаться только на компьютере покупателя. Незаконное копирование исключено.
Вы упускаете торговые возможности:
- Бесплатные приложения для трейдинга
- 8 000+ сигналов для копирования
- Экономические новости для анализа финансовых рынков
Регистрация
Вход
Если у вас нет учетной записи, зарегистрируйтесь
Для авторизации и пользования сайтом MQL5.com необходимо разрешить использование файлов Сookie.
Пожалуйста, включите в вашем браузере данную настройку, иначе вы не сможете авторизоваться.