YouTubeにあるマーケットチュートリアルビデオをご覧ください
ロボットや指標を購入する
仮想ホスティングで
EAを実行
EAを実行
ロボットや指標を購入前にテストする
マーケットで収入を得る
販売のためにプロダクトをプレゼンテーションする方法
MetaTrader 4のための有料のテクニカル指標 - 55

Forex Pro Analyzer. Find top performing strategies on your MT4 account
This tool enables you to analyze all your Forex trades executed manually or by an expert or several EA's.
It will group and examine all trading positions by magic numbers, and will show you trading performance for each strategy so you can spot the winners immediately.
You get Fast trade statistics fast a on your MT4 chart window.
Imagine you want to test 10 different EA's on one single mt4 terminal with this tool it wi

The indicator is simple and clear, making the work of the trader as easy as possible and giving clear signals to enter the market.
This indicator has two settings for the period. Which makes it more flexible. And at the same time, many false signals do not appear. The larger the period, the smoother the indicator itself will be.
It can be used both independently and together with other indicators of technical analysis (including with oscillators), as well as with another same indicator (wit

Индикатор отображает регнессионный канал с сопровождением каналов фактически создавая уровни поддержки и сопротивления.
Уровни поддержки и сопротивления являются одним из важнейших элементов технического анализа. С этим утверждением согласится любой трейдер. Уровни в трейдинге используются непосредственно, открывая и закрывая ордера у границ диапазона, очерченного ими. Также уровни применяют баланс спроса и предложения в своих торговых стратегиях на различных временных интервалах.
Визуально
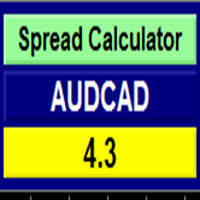
Currency Spread Calculator
This indicator is created with the aim of letting the Traders know the exact points of the spread on the currency pair they are about to buy or sell.
This will safe them of paying exorbitant spread over a single currency pair procurement. Imagine a normal spread become wider from 2 or 3 pips to 15pips or more when there is volatility in the market. It is absolutely outrageous looking for just 20 pips and paying another 20 pips as spread over a currency pair!
A
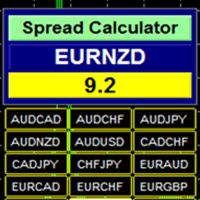
Currency Spread Calculator Plus
This indicator is created with the aim of letting the Traders know the exact points of the spread on the currency pair they are about to buy or sell. What makes it a PLUS is that Symbol/Time frame Changer is coded with this indicator to make it easier navigating from one currency pair to another and one time frame to another on the same chart window without having to open tens of chart window in order to study more currency pairs. It saves time, energy, stress

Abiroid Profit Percent Series 1: Arrows Indicator Stochastic Ichimoku with ATR
Get the Scanner for free. For getting Profit Percentages for Multiple Timeframes and Multiple Pairs. And read detailed description about this indicator and all the settings here. And get extra Indicators, Templates and settings for download: https://abiroid.com/product/profit-percent-stoch-ichimoku-with-atr
Watch the tutorial video here: https://youtu.be/C45-9kWPE2Q
About The Strategy:
This strategy has 3 main

The Point61 indicator is the result of many years of monitoring of price behavior of currency pairs and metals.
It is not a secret, that in times of uncertainty, traders are looking for possible levels of support and resistance - the point, where price should stop its movement.
There are 2 possible scenarios at these points:
1. Reverse (correction) to the opposite direction;
2. Breakthrough to continue movement. Very often these points are used to set stop orders - TakeProfit or

Currency Strength Meter is the easiest way to identify strong and weak currencies. This indicator shows the relative strength of 8 major currencies + Gold: AUD, CAD, CHF, EUR, GBP, JPY, NZD, USD, XAU. Gold symbol can be changed to other symbols like XAG, XAU etc.
By default the strength value is normalised to the range from 0 to 100 for RSI algorithm: The value above 60 means strong currency; The value below 40 means weak currency;
This indicator needs the data of all 28 major currency pair
the indicator for trading binary options is excellent for traders using scalping or trading from support levels of resistance or for their breakdown, the indicator is recommended to be used in conjunction with additional filters to avoid entering a losing trade, signal can also be used with Bollinger Bands Signals are formed on the current candle to enter the next
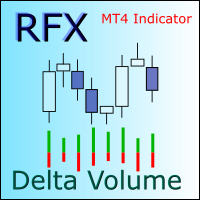
Note: This indicator cannot be tested in the strategy tester. Please download the free demo version from https://www.mql5.com/en/market/product/48627 RFX Delta Volume is an indicator to show bullish and bearish volumes separately for each trading candle. The indicator uses history data of one minute (M1) to estimate the true bullish and bearish volumes in a sub-window. There are two modes of operations for this indicator. In mode "Delta Volume", the indicator shows the difference in bullish a

Risk Management is one of the most critical elements of profitable trading. The 5TT Risk Management Tool is very effective at helping Forex traders calculate the lotsize to any trade; straight on the MT4 charts. The Tool will also display the actual Dollar value of the risk pre-selected. No indicator parameters required. All data input is done on the Tool displayed on the each chart on which the indicator is placed. FOllow the accompanying video here...

MarketSentiment - индикатор рыночного настроения, выполнен в виде осциллятора. В основе индикатора лежит принцип: цена, как правило, идет против толпы. Если большинство трейдеров заключает сделки на продажу, цена часто идет вверх и наоборот. Гистограмма индикатора показывает какие сделки преобладают сейчас на рынке, если гистограмма красная, то больше совершается сделок на продажу, если зеленая - то на покупку. Индикатор очень прост в использовании и не требует дополнительных настроек. Лучше вс

Customize Your Own Strategy and Get Instant Backtest Results
All Oscillators Data in a single indicator, displayed on the chart. Get a 7-Day Free Trial Version: Click Here (Full Access to The Indicator for 7 Days) The Tangram indicator uses an amalgam of 7 different oscillators , then analyses when the price is in Overbought/Oversold territory, when there's a divergence , and when price is trending . Besides being an indicator that helps you analyse the charts, Tangram also gives you the ab

Индикатор ищет подобную ценовую структуру, сравнивая с последней ценовой структурой. Размер паттерна (грубо говоря количество переломов зигзага) настраивается (всегда меньше на 1, чем введено - нулевой перелом не считается). Все найденные совпадения отмечаются прямоугольником. Так же к паттернам существует быстрая навигация с помощью кнопочек "Next patt" и "Prev patt". В индикатор вшиты два индикатора типа ЗигЗа г : стандартный зигзаг и пользовательский , моей разработки. Параметры настройки ста
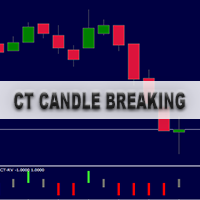
O indicador CT Candle Breaking foi desenvolvido para facilitar a identificação dos rompimentos de velas e para filtrar os movimentos e a força das tendências. Ao observar o comportamento do indicador, podemos ver mais claramente os pullbacks, as continuações e as reversões das tendências, podendo ser usado em qualquer timeframe. A cor verde representa o rompimento da máxima da vela anterior A cor vermelha representa um rompimento da mínima da vela anterior A cor cinza representa um fechamento d

Note !!: Because ZO Power needs a lot of historical candles to analyze, so Free Demo version will not show in the first time but it will show after you run enough candle. We recommend you try test Free Demo with backtest time for more than 6 months for H1 charts. /*--------------------------------------------------------------------------------------------------------------------------------------------------------------------------------------------- ZO Power is a measure of trend strength on

One of the most beloved areas in price chart analysis is the use of graphical analysis. The state of the market, the phase of its movement, largely determines the success of the trader and his chosen strategy. The intelligent algorithm of the Trend RB indicator accurately determines the trend, filters out market noise and generates input signals. The indicator uses a color alarm: blue - when changing from descending to ascending, and red - on the contrary, to descending. You can use the indicat

SWAP / 3x SWAP - Forex is usually charged a triple swap on Wednesday (midnight Wednesday to Thursday, 11:59 pm server time) and is paid because it is for three days at a time: Wednesday, Saturday and Sunday. Fees of some instruments (DAX30 and others) take 3 Swap on Friday. With our Swap Report Indicator, you get details of your current open and history closed positions in your trading account, helping you gauge your trading net profit or loss.

Trend Follow Me Moving
Trend Follow Me Moving is a trend indicator which based on Moving average indicator.
It'll alert signal on next bar open with an audio or pop up on the chart
when SMA cross above SMMA high average price that the signal "Buy" alert
and SMA cross below SMMA low average price that the signal "Sell" alert. Messages/Sounds (Notifications and sound settings)
Send_EMail - enable/disable sending emails. Audible_Alerts - enable/disable messages in the terminal when sign
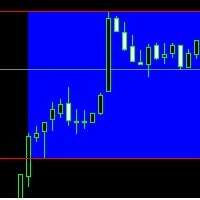
Hi, This is only a simple indicator. It selects a range between two times - you can choose it from how long. Don't wait miracle. This indicator is ideal choose for your break out strategy, for example London break out strategy. Happy trading! We wish you the best! Yours sincerely: MarginCallMasters Team Warning! This is only an indicator, it will not open position or orders to your account.

The MACD indicator is based on volume , which can offer us a very valuable type of information (it marks the long or short strength of each candle), es pecially if we are operating in shorter time frames. Green = bullish signal; Red = bearish signal; Blue = MACD volume
Parameters: Fast: Numbers of bars used for fast period calculations Slow: Numbers of bars used for slow period calculations

設定した時差で時間ラインを表示します。(30分単位の時差には対応していません。) また、100.000、.100、.200のようにキリの良い価格で価格ラインを表示します。 標準ではMT4による時間と価格でグリッドラインが表示されていますが、ブローカーの時間となり価格とともに中途半端な位置で表示されるので、非常に分かりにくいものとなっています。 それを非表示にし ユーザーが設定した時差と価格の分かりやすい位置でグリッドラインを表示します 。他のEAや裁量取引に負荷をかけないよう、軽快に動作するよう実装しております。 時間ラインは未来の時間も表示 します。事前に節目となる時間の把握ができます。(土日の時間軸は表示されません。) アジア、EU、USの時間帯を色付きで表示できます。 マーケットの開始時刻や、イベントの時間など特定の時間をSpecial Timeとしてラインを表示することができます。 パラメーター説明 ・Time offset:
MT4上の時間に対する時差を設定します。
・Bars time range:
時間ラインを表示する範囲をバーの本数で設定します。
・P

BeST_Breakout Strategy is a Metatrader Indicator based on a proprietary algorithm implementing a very powerful tool that can exploit every breakout leading to huge market movements. It timely locates the most likely points for Entering the Market as well as the most suitable Exit points and can be used successfully as a standalone Trading System which often results in huge profits accompanied by very impressive statistics like Success Ratio and Profit Factor.
The BeST_Breakout Strategy is

The indicator is based on the analysis of the volatility of a trading instrument.
The indicator does not repaint (except for the last candle).
On the chart it looks like 2 lines (estimated support / resistance levels) and displays arrows when a trend changes.
It can be used on any timeframe, but best of all, the indicator shows itself on timeframes from H1 and higher.
Extremely easy to set up and use.
Input parameters:
Sensivity - indicator sensitivity. The lower the value, the fast
SPECIAL PRICE Great offers on all products. Great opportunities.
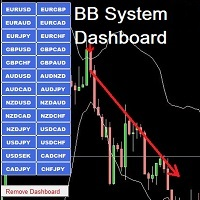
BB System Dashboard is a dashboard that collects signals from the currencies you will select, or from all the currencies of your metatreder by setting the item Check all currency pairs. The buttons are clickable and open the desired chart. Whenever there is a signal, the dashboard warns you with a visual and audio signal. You can immediately open the chart and then open the position. This dashboard will help you to be more profi
BO Trade Simulator is an excellent indicator that will allow us to test our Binary Options strategies correctly and at the desired time.
The Indicator allows you to put amount, expiration time and percentage of profit, everything a Binary Options trader needs without the need to test with demo accounts in different brokers since you will be able to do everything from your Metatrader 4 platform.
Its use is designed to be simple and practical, from the options you can indicate the desired par

Определение текущей тенденции - одна из самых важных задач трейдера независимо от стиля торговли. Индикатор Trend Selection поможет с достаточно высокой вероятностью это сделать. В расчетах индикатора используется авторская методика. Trend Selection подходит для любой валютной пары, любого таймфрейма, и не меняет свои показания. Цвет гистограммы зависит от силы текущей тенденции: чем темнее гистограмма, тем сильнее текущая тенденция. На текущий момент индикатор имеет два метода расчета сиг

PM Redefine : Is Simply, Simple, Straight and Direct in opening orders and closing of orders;
PM Redefine : Can be run in all type of instrument.{Forex, Commodity ,Stock, or Cryptocurrencies}.
PM Redefine : Can be run in all type of TimeFrame,{M1,M5,M15,M30 , H60, H240, D, W, M}.
PM Redefine : can be used for scalping and day trading.
Input Parameters
typeFrom_0_to_9: type in between 0 and 9 ; upper_levelAlert: if line cross this predefine level up , Arrow Buy show if : showArrow =true: lo

Diviner PRO Divine PRO indicator is based on the random forest machine learning algorithm. This is my first standalone product. In this indicator, all calculations of price patterns and the formation of indicator trading signals is performed through 43x Trees. I chose this amount to keep the indicator deep in training and reduce the size of the indicator. DIVINE indicator - universal indicator, can work with the following: EURUSD, USDCHF, GBPUSD . In the future I will conduct experimen

Broker Tester allow you to test the real terms applied by your broker. Using the 28 forex cross, this indicator records the changes in spreads for the duration of the test. It shows moreover the swap applied for long and short position for multiday trades. You can have a clear expression of the quality of your broker in a short time and maybe you can use this information to negotiate better conditions. In the input parameters, you can enter prefixes and suffixes used by your broker for naming

Индикатор LevelFractal - разработан на основе всем известного индикатора Fractal, он берет значения нескольких ближайших к текущей свече фракталов, вычисляет некое среднее значение и, исходя из него строит уровни поддержки и сопротивления. Когда цена пробивает один из этих уровней, появляется сигнал или на покупку или на продажу, на графике они обозначаются стрелками. Индикатор работает на любом таймфрейме и на валютной паре. По вопросам приобретения полной версии пишите в личку.
CRAZY SALE! Was 250, NOW 50 USD till the end of MAY!!!
---> Check all the other products <---
The WTR Dynamic Range Indicator is a powerful and deeply customizable range indicator that takes in account the average upward and downward movement of the price in the past trading days. This fully customizable indicator can be setted for a lot of uses and cases:
• Trend trading on level breakouts
• Spotting high probability targets for Take Profits
• Setting a multiple targets for position

Добрый День уважаемые трейдеры! Вашему вниманию индикатор созданный и работающий на базе трендовика ADX, для торговли на смене направления движения который учитывает коррекцию и даёт возможность на ней заработать. Применяю этот индикатор для скальпинга. Рекомендую таймфреймы от 15 ти минутного(М15) до часового (Н1) периодов. Красный кружок сигнал на продажу- Sell) Зелёный кружок сигнал на покупку Buy) Чем меньше ваш таймфрейм тем меньше пунктов вы зарабатываете. Важно выставлять стопы! !В
This analytical tool is one of the options for Zigzag indicators. On the price chart, it displays arrows. Therefore, ZigZag belongs to the category of arrow indicators. Each arrow indicates a trend reversal. red arrow means a downtrend has formed. green arrow means an uptrend has formed. It is worth considering the redrawing of ZigZag Trend signals - on a zero candle the arrow may appear and disappear several times and the final result will not be displayed at all. But if it appeared and was tra

BZSZ (Buy Zone Sell Zone) follow trend. buy zone if price is above the line, sell zone if price is below the line Works in USDTRY/EURTRY/GOLD/SILVER/EURUSD/EURJPY/GBPUSD/EURGBP/GBPJPY/AUDJPY/AUDUSD/AUDCAD/US500/JP225 and all pairs
Best timeframes
Signal on close of a bar.
DOES NOT repaint. DOES NOT repaint. DOES NOT repaint. DOES NOT repaint.
DOES NOT recalculate. DOES NOT recalculate. DOES NOT recalculate. DOES NOT recalculate No Settings

注意:外国為替トレーダー 「市場で取引するときにあなたにもっとお金を稼ぐチャートインディケーターを取得してください ... 」 はい!私はより多くのお金を稼ぎ、取引をシンプルにし、市場がリアルタイムで何をしているのかを簡単に理解する準備ができています! それに直面しよう、外国為替取引所での取引は複雑でストレスが多く、当惑しているように見えるかもしれません!チャートは、適切なシステムとインジケーターのガイドがなければ、圧倒的で混乱する可能性があります。チャートを正しく分析していないために再び市場に焦げてしまうのではないかと思うので、胃の結び目の感触を取り除きます。 「トレーダーのブロック」はどうですか?すべてのトレーダーが簡単に陥る 1 つの落とし穴は、大きな勝利または大きな損失の後の恐ろしい「トレーダーのブロック」です。あなたは大きな勝利の後に同じ成功を再現することができますか、または大きな損失の後に別の財政的な落とし穴に落ちることができますか?優れた釣り指標ガイドは、この問題を回避し、ストレスと不安を和らげるのに役立ちます。 " 究極の外国為替直感的なテクニカル指標の提示 "

Gossamer is a moving average ribbon indicator that uses a novel approach to identify breakout trades in trending markets. By applying a progressive period shift to each moving average, levels of consolidation become visible. Enter trades when price breaks out in the direction of the prevailing trend. Stoploss should be located on the other side of the consolidation from the breakout. Profits can be taken at the next consolidation or the stoploss trailed and the position built. Applicable to al

Trend Trading. Trend trading is a strategy that allow to trade the market by identify the direction of the price movement in near future ( according to the time frame ). A trend is a tendency for price to move in a particular direction ( Up (as a Uptrend) or Down (as a Down trend) ) over a period of time, sufficiently for open a position and close it in profit. This indicator is showing an Uptrend (Aqua line) and Downtrend (Magenta line). A point of a transition from one color to another is a g

Table of most usable Indicators. Technical Indicators actually work. keep in mind that Technical Indicators won't automatically lead you to profit, but they will do a lot of work for you. In fact, Technical Indicators can do a few wonderful thing: help to find a trade idea; help to find a trend; save time for analysis; show something that not obvious; working with mathematical consistency.

Good day!
To your attention the ForexdivergencePS indicator may not be the newest in the trading strategy
The Forex indicator detects and displays descending and ascending divergences on the chart. When a new pattern is formed, a pop-up window is triggered. An arrow is formed on the chart that shows the type of phenomenon and helps to open an order in the optimal direction.
Friends of traders rate the effectiveness of the tool as above average. You can change settings, including the sensi

Important!! ZO Trend can't work on MN timeframe. /*--------------------------------------------------------------------------------------------------------------------------------------------------------------------------------------------- ZO Trend an indicator used to search for entry point. With the session candle algorithm on many timeframe, ZO Trend creates an area for traders find good Entry Point. ZO SYSTEM BASIC SETUP : https://www.youtube.com/watch?v=qdNOXHWozNw ZO TREND User guide :

SMA Cross Envelopes Alert is a trend indicator based on the Moving average and Envelopes indicator. It'll alert signal on next bar open with the audio or pop up on the chart
when SMA crosses above the Envelopes upper line that the signal "Buy" alert
and SMA crosses below the Envelopes lower line that the signal "Sell" alert.
Settings
SMA: Simple moving average setting period
Envelopes: Envelopes setting period
Deviation: Envelopes setting deviation (%)
Send_EMail: enable/disable

PULL IT BACK is a revolutionary trading system and a complete strategy with advanced algorithm developed to detect the trend direction after a PULLBACK , a RETREACEMENT or a KEY LEVEL BOUNCE . The goal of this indicator is to get as many pips as possible from market trend. Following strictly the rules of the strategy, you can become a better trader and have more safety entries in the market. Best features of our trading system are: Arrow Never repaint Arrow Never lagging Alert appears only
Trend Indicator
This Indicator detects the essential momentum in the market and lets you know when the market has a potential trend
Green means we are going higher and Red Means we are going Lower,
You can customise the Line to Any Color.
The alerts come in immediately there is a potential signal
Defaults Length : 55
This is the Depth of your averaging calculation. The bigger it is the more noise is filtered.
55 Is the Best Optimum Setting For This Indicator

StarTrend è un indicatore a freccia che identifica, con alta probabilità, l'inizio di un nuovo trend. La sua versatilità, però, permette di utilizzarlo anche in strategia in cui cerchiamo operazioni a favore di trend. StarTrend può essere la base del proprio sistema di trading oppure può integrare, per dare conferme o suggerimenti di astensione, il tuo sistema già collaudato. StarTrend invia segnali di preallarme quando c'è un probabile rallentamento della forza del trend e poi disegna una stel
Chart Slice is a very convenient multi-timeframe indicator, with which you can see market information at once on several time slices. This will allow the trader to learn quickly and most importantly understand the vibrant market . The author himself went this way and this indicator helped incredibly. You probably have often wanted to see in detail why at a given point in time the price was rapidly moving away from a certain level or, on the contrary, stopping there. And for this you had to chan

The New York Stock Exchange Session's Hours
This indicator facilitates observing the currency pair's quotations during subsequent parts of the stock exchange session live. Before the session starts, a rectangle is drawn on the chart but not filled in with color. It means the extent of the session duration. Before the first bar enters the rectangle of the session, a sound signal or pop-up window will notify us that the session will just start. When the price graph crosses the edge of the sessi

The NASDAQ Stock Exchange Session's Hours
This indicator facilitates observing the currency pair's quotations during subsequent parts of the stock exchange session live. Before the session starts, a rectangle is drawn on the chart but not filled in with color. It means the extent of the session duration. Before the first bar enters the rectangle of the session, a sound signal or pop-up window will notify us that the session will just start. When the price graph crosses the edge of the session

The "Atomic direction Trend Power Currency Strength Pro" indicator measures the strength of the up and down trend of the 8 main currencies USD-EUR-GBP-AUD-JPY-CAD-CHF-NZD Principal functions: 1) Show the current position of 7 currency pairs simultaneously. 2) Sort the position of each currency pair according to the market level. 3) Calculate and indicate the main trend of each currency.
This indicator unites the main elements of the market information by means of correlations, simplifying buy

スキャルピングインスタントインジケーター。
インディケータの地下値と一緒に売買するシグナルは矢印で示されます。
矢印と4つの時間枠を表示する地下インジケーターが予測で一致する場合、強い信号が考慮されます。
このインディケータには、1つの結果にまとめられた多くのアルゴリズムとタスクが含まれています。これは、Skalpingインスタントインディケータが提供します。つまり、トレーダーに市場の方向性を通知します。したがって、彼は与える
1.スキャルピングシグナル(図1)図1-D1に示すように、D1チャートの選択された期間とインジケーターの地下セクションに買いシグナルがあります。信号は遅滞なく到着します。この場合、スキャルピング戦略を使用して取引することをお勧めします。
2.信号補正またはトレンド。 図2に示すように、地下室のグラフのすべての期間。すべての期間はレッドゾーン->売りポジションにあります。チャート自体の時間枠と地下インジケーターが一致したときに色が変わるまで取引を保持します。 そのため、インジケーターは他の戦略に非常に適応できます。
主要通貨ペアで使用する
The Trends Signal indicator displays the direction of the trend with arrows, works in a simple and clear way. It uses a combination of reliable and simple indicators to analyze prices. The signals of the Trends Signal indicator can be interpreted as follows: buy when the bars are colored blue, and sell when they are red. An effective indicator with a wide range of three parameters for trading.
Parameters: Length - The number of bars to calculate. LevelUP, LevelDN - Levels for determining over
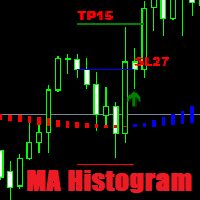
Commercial version of open code . A forex trader can create a simple trading strategy to take advantage trading opportunities using MA Histogram or associated indicators. MA Histogram are used primarily as trend indicators and also identify support and resistance levels.
Improved version 1.30
Added: Take Profit Stop Loss Automatic optimization Result R/R Consecutive losses

Trend Transition is a hybrid indicator, as it is based on signals from several well-known products: RSI and MA. MA is a trend indicator of the average true range, which determines the range of minimum and maximum price fluctuations, as well as closing prices. RSI is an indicator of the family of oscillators. The indicator helps to calculate the oversold and overbought levels of a trading instrument.
When a trend changes, the Trend Transition indicator uses a color alarm: blue - when changing
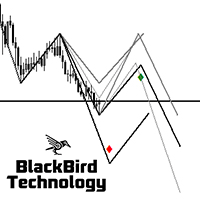
This indicator displays three forecast projections of the last market swings based on the Zig Zag indicator. Price action moves very often according to what happened in the near past, the indicator displays the price pattern that the market will possibly follow. Both short and long patterns are displayed in the chart with an indication of the target price level. If multiple projections overlap or almost overlap, then the next price movement becomes very likely. In this case it's a ranging market

The indicator detects important peaks and troughs (extremes) on the chart. These points can be used to plot support/resistance levels and trend lines, as well as any other graphical analysis. These points can serve as reference points for setting trading orders. The indicator does not redraw .
Settings:
Size_History - the size of the calculated history. Num_Candles_Right - number of candles to the right of the peak or trough.
Num_Candles_Left - number of candles to the left of the pea
SWing3 Metatrader4 流動性と移動平均に依存する指標>これにより、正しい意思決定の98%が売買されます。そして取引を閉じる時間。 価格は時々上昇します>そして最初のEAがいつ起動するかはこの指標に依存して2k以上になります。 1-いつ買いポジションまたは売りポジションを開くか(2本の線Xのクロスに依存し、ポイント計算は選択したフレームに依存します) (十字架は色付きの領域の外側にある必要があります)ろうそくは十字架の間または(1番目または2番目から5番目まで)十字架に触れなければなりません クロスの下で最後の条件が直接確認されたときにカウントされたポイント 2-次のエリアの外側の黄色い線の開始カーブがポジションを閉じるためのシグナルである場合 3-フレームで動作します(1m 5m 10m 15m 30m 1h 4h毎日および毎月)(すべてのペア>およびすべての商品)メジャー推奨 4-ゲインの..(55%)を獲得した後にトレイルストップを置く 5-1000 $スタックの取引ごとに推奨ロット0.01 異なるペアの例でポジションを分配する:(usdjpy eurgbp go

The indicator is usefull for: binary options and forex trading..
.Support all trading Pairs.
--->Recommended expiration time for 3 to 5 candles. Exemple:
Time frame 1 minute then expiration time will be 3 to 5 minutes.
The indicator support MT2trading autotrading platform ;
SELL BUFFER : 0 (red arrow)
BUY BUFFER : 1 ( green arraw)
See #screenshot1.
This is a premium powerfull indicator show hight daily winrate..

この指標は、いくつかの複雑なアルゴリズムを使用して、トレンドを正確に判断します。すべてのアルゴリズムは、プライスアクションに基づいているので、一方では、エントリーがトレンドの終わりにのみ行われ、あなたはすでに数pips未満を持っていることを、例えば、時間の損失はありませんが、これは、このインジケータでは起こりません。一方で、国際取引はほぼ完全にプライスアクションをベースにしているので、こちらの方が安全性も高いです。
入力パラメータ「数」は、表示器が矢印を表示するために必要な適用条件の数である。この値は5を超えてはなりません。
この指標は、エキスパート・アドバイザーへの統合にも非常に適しています。。
Standart MACD indicator but All parameters can be changed for users. Extern Inputs: FastMA method : Simple, Exponential, Smoothed and Linear Weighted FastMA Price : Close, Open, Low, High, Median, Typical and Weighted FastMA count : Default is 12 SlowMA Method : Simple, Exponential, Smoothed and Linear Weighted SlowMA Price : Close, Open, Low, High, Median, Typical and Weighted SlowMA Count : Default is 26 Draw Mode : Line or Histogram SignalMA Method : Simple, Exponential,

Email and push notification Alert This is very powerful tool to get Detailed view of all of your trading on same spot. it can send 2 types of alerts, Email Alerts Push Notification
1: Email Alert email alerts are consist of 4 sections Section 1 includes Account number and name details Section 2 includes Account Balance Equity and Floating Profit/Loss details. Section 3 includes Pair wise Profit and loss Section 4 includes Pair wise+Order wise Detailed view of all trades. its includes numbers

On top of a market has three consecutive rise brick, when price lower than the continuous rise of brick of the lowest price, can do sale, if there is a pay before, should be liquidated, until after a period of time, a reversal (three consecutive falling brick brick of the highest high with new price break), at this time, can hold some sell single warehouse, at the same time set up the check.

Indicator designed for binary options trading buy signals come along with hiding a new candle blue arrow on histogram buy signal red arrow on histogram sell signal buy worth 1 or 2 candles the signal appears with the opening of a new candle but may appear during its formation it’s worth entering the deal only when the signal has arrived at the opening, the signals do not disappear Recommended currency pairs: Any Timeframe: up to H1 You can customize the PERIOD parameter to your trading style Rec

The indicator draws support and resistance lines on an important part of the chart for making decisions. After the trend line appears, you can trade for a breakout or rebound from it, as well as place orders near it. Outdated trend lines are deleted automatically. Thus, we always deal with the most up-to-date lines. The indicator is not redrawn .
Settings:
Size_History - the size of the calculated history. Num_Candles_extremum - the number of candles on each side of the extremum. Type_Ar
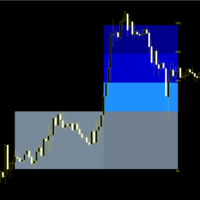
NO REPAINT The system combines several analytical techniques and presents BUY/SELL signals in an easy-to-read form. You don’t have to be a professional to use it. Conservative TP SL can make amazingly accurate market predictions by constantly auto-analyzing every price movement, trading patterns and with the help of complex trading algorithms. This indicator main task is to look for gravity zones and generate buy/sell signal with exact SL and TPs location. When specified conditions are fulf
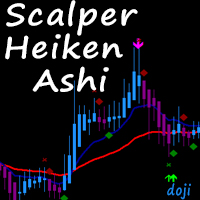
There are several types of Patterns, We choose Doji that is used for continuation and trend reversals.
Signal types : #1 Premium Signal- ---------------- Doji should have the colour of the expected direction change along with normal candle colour matching direction.
#2 Secondary Signal ---------------- Doji has the perfect formation however the bar maybe in the same colour as the previous bar but the candle colour has new direction colour.
Stochastics-Filter: ---------------- The Stoc

FEATURES OF THE HELPTRADER TO ENTER THE MARKET INDICATOR ! four types of moving averages for building a channel; ! ability to select the width of the flat (Central MA) and the margin for the channel borders; ! four options for the display channel; ! three settings for the appearance of the arrow signal; !customizable notification system. The arrow channel indicator HelpTrader to Enter the Market, due to its variability, can become a fairly effective tool for trading in combination with other in

Multi Strategies Combined Signal All in One Multi Strategies Single Combined Select from up to 6 Strategies solo or Combine different strategies for signal generation (Combining more than 2 strategies may LIMIT a lot the number of signals)! ALL inputs and Strategies selection From Chart !!! Also Inputs editing from Chart !!! Push your strategy bottom (one strategy) OR Combine signal from as may strategies (up to 6) : Selected and enabled strategies will be in GREEN !!! 1- BUY SELL areas 2-

---> Check all the other products <---
The Multi Time Frame Chandelier Channel is a good synthesis of the chandelier trailing stop and let you analyze the trend.
Enter when the price breaks one of the two lines, then trail using the opposite line. Ideal for scalping, entering after the dot appears.
Plenty of customization: Choose the lookback period, the longer, the slower Choose the Time Frame to use (must be greater or equal your chart TF Play around with the options to get the
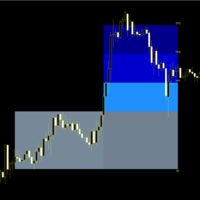
NO REPAINT The system combines several analytical techniques and presents BUY/SELL signals in an easy-to-read form. You don’t have to be a professional to use it. Aggressive TP SL can make amazingly accurate market predictions by constantly auto-analyzing every price movement, trading patterns and with the help of complex trading algorithms.
This indicator main task is to look for gravity zones and generate buy/sell signal with exact SL and TPs location. When specified conditions are ful

Reflector is an auxiliary tool for technical analysis, which helps to determine the direction of the trend: either upward or downward price movement on the selected trading instrument. The indicator is an indicator of a trend type; it smooths out price fluctuations during signal formation by averaging data. The indicator uses calculations designed to smooth out sharp fluctuations that do not affect the overall picture of price movement.
A trend can be increasing (bullish trend) and decreasing
MetaTraderマーケットはMetaTraderプラットフォームのためのアプリを購入するための便利で安全な場所を提供します。エキスパートアドバイザーとインディケータをストラテジーテスターの中でテストするためにターミナルから無料のデモバージョンをダウンロードしてください。
パフォーマンスをモニターするためにいろいろなモードでアプリをテストし、MQL5.community支払いシステムを使ってお望みのプロダクトの支払いをしてください。
取引の機会を逃しています。
- 無料取引アプリ
- 8千を超えるシグナルをコピー
- 金融ニュースで金融マーケットを探索
新規登録
ログイン