|
10+ anni
esperienza
|
3
prodotti
|
79
versioni demo
|
|
28
lavori
|
0
segnali
|
0
iscritti
|
MQL5 Community:
Programmer + Forex Trader
Product on Market:
Forex Currency Power Index indicator for MT5
https://www.mql5.com/en/market/product/101322
Forex Currency Power Index indicator for MT4
https://www.mql5.com/en/market/product/101328
TrendColorBars
https://www.mql5.com/en/market/product/14715
Programmer + Forex Trader
Product on Market:
Forex Currency Power Index indicator for MT5
https://www.mql5.com/en/market/product/101322
Forex Currency Power Index indicator for MT4
https://www.mql5.com/en/market/product/101328
TrendColorBars
https://www.mql5.com/en/market/product/14715


Roberto Jacobs

· 4
Mostra tutti i commenti (4)
Roberto Jacobs
2015.05.27
good day mate, this indicator still in waiting list moderator for review..be patient to wait ^_^
Roberto Jacobs
2015.05.27
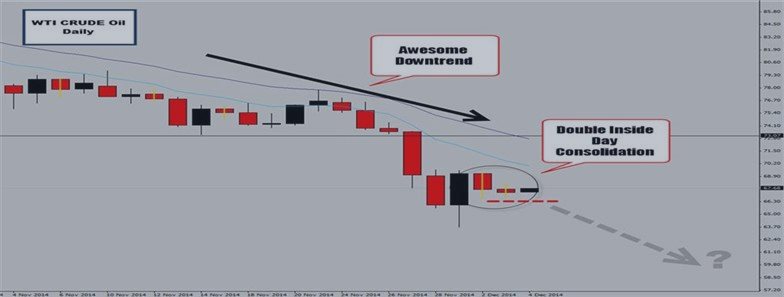
For trading trends, please use the MACD indicator
Read the articles in link below;
https://www.mql5.com/en/blogs/post/5406
https://www.mql5.com/en/code/11633
https://www.mql5.com/en/code/12658
Read the articles in link below;
https://www.mql5.com/en/blogs/post/5406
https://www.mql5.com/en/code/11633
https://www.mql5.com/en/code/12658